You are missing trading opportunities:
- Free trading apps
- Over 8,000 signals for copying
- Economic news for exploring financial markets
Registration
Log in
You agree to website policy and terms of use
If you do not have an account, please register
When calculating the lot ratio, I do the following:
1. first, two external variables (let us call them "volatility coefficients" of two FI) are assigned values of 1
2. from the desired point in time (set in the external variables) - at the same time I look through both charts to detect "left" spikes: as a rule, on M5, M15 the last month is more or less normal - we plot the pair movements in ticks in a separate window:
this is the start of the process:
preliminary value of lots is defined from (although this has to be checked - e.g. depo currency $ and FDAX tick = 12.5 EUR):
TV_Sym1=MarketInfo(Symbol(),MODE_TICKVALUE);
TV_Sym2=MarketInfo(Symbol_2,MODE_TICKVALUE);
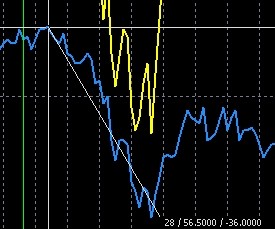
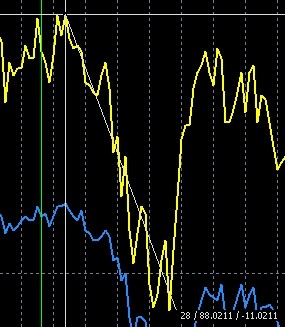
then select 2 similar figures and measure the height of each in ticks:
for oil QM for oil BRN
as we see, in this part of the chart BRN has moved 88 ticks, QM - 56,5 (it is possible to find many similar figures /ten will be enough/ and get thus the ratio of the sum of moves of one instrument to the sum of moves of another) I will not do it in this example, I will just set K2 coefficient to 88/56,6=1,56
the result of this gesture (in parallel we measure the difference of the graphs in this place by height - 43,8 ticks):
now we set external variable Y_shift=43,8 and check:
in this case the calculation of lots is done automatically by this code:
as you can see, the result has changed: i.e. 1.25 / 1 (once again please note that 1 figure is not enough!)
I should note that I had no discrepancies with Leonid (I checked several pairs this way)
Z.I. don't mind that one of the tools is a glue - for the example it's insignificant
The preliminary value of lots is defined from (although this has to be checked - e.g. the depo currency is $ and the FDAX tick = 12.5 EUR):
A similar problem has been solved as follows:
My method of finding the spread is based on solving an optimization problem and is fully automated for any number of FI.A similar problem was solved this way:
Absolutely agree. 100% will work. A very simple and logical construction. (with your permission, I'll add it to my piggy bank)
My method of finding the spread is based on solving an optimization problem and is fully automated for any number of FI.
Well, no comments here, because I am not honoured to be acquainted with your idea :)
Here is the problem statement and here is the solution.
Here is the problem statement and here is the solution.
By the way, for oil, it is more reasonable to arbitrage the CL (or WTI) - BRN spread
The dimensions are the same. And analysts' comments are all made for the dimension of the BRN - CL spread
By the way - an interesting comment this morning. http://top.rbc.ru/finances/07/02/2011/539457.shtml
In general, many "commodity" analysts assume that now this spread(BRN - CL) has reached 11 figures, it won't grow further and there is a reason to get into a long term contraction.
Current situation BRNH1-CLH1=1^1, H1
By the way, on oil it is more reasonable to arbitrage the CL (or WTI) - BRN spread
Well, here's a little treat for those in attendance.
The HEJ1-HEK1 calendar pork spread (April-May).
Perennial seasonal trends . No comment!
However, there will be a comment. Positions to open on this spread - better in the midst of American session trading after 18:30 Moscow timeframe. At this time the Ask Bid of these pork instruments is significantly and meaningfully smaller - dozens of times!