The oil issue ... - page 39
You are missing trading opportunities:
- Free trading apps
- Over 8,000 signals for copying
- Economic news for exploring financial markets
Registration
Log in
You agree to website policy and terms of use
If you do not have an account, please register
Price is not a UFO to change direction instantly ...
I read an article by Goldman Sachs about them making a correlation between the S&P 500 and EURUSD (we have it between oil and USD/RUB for example):
True, if the weekly timeframe, the S&P 500 is just in a correction inside the uptrend (not yet in a downtrend there) and EUR/USD is already in a downtrend ... but if they are right, then the S&P 500 has had a downtrend breakout, which will still be in the euro (could be as a forecast for example).
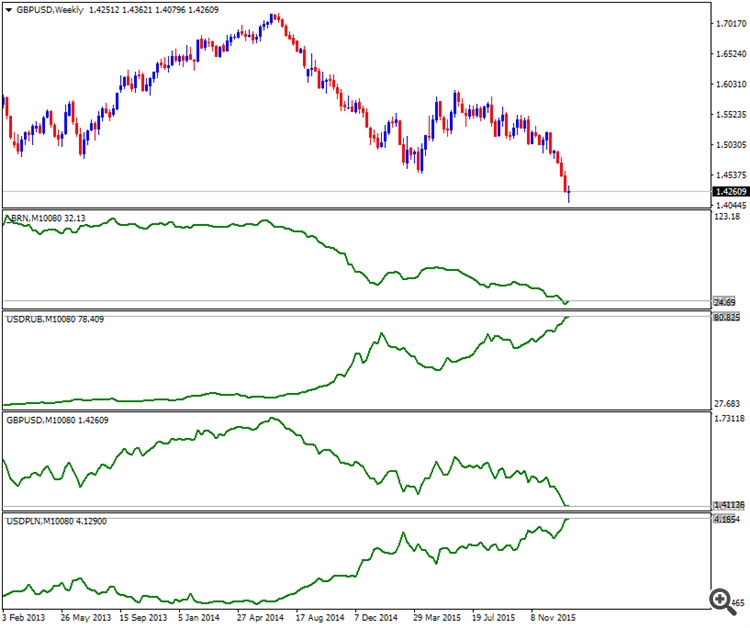
And these are just the patterns :) - From top to bottom on the chart:
All falling, but how beautiful and in sync ...
And these are just patterns :) - From top to bottom on the chart:
All falling, but how beautifully and synchronously ...
Recent events are quite bizarre:
A sharp drop in the price of oil, in theory it should not be like this, now it was up 10% on Friday alone.
This is strange.
The latest developments are quite strange:
A sharp drop in the price of oil, theoretically it shouldn't be like this, now it's up 10% for Friday alone.
This is all weird.
If the daily timeframe, this is the rise (last two bars):
....That is, everyone who does their technical analysis (including TV):
- will talk about falling all year, or
- do an intraday technical analysis, or
- or saying "it's bottom and it's time to buy".
...That is, when things fall, they (commentators on TV and in the media) move to the intraday timeframe (to talk about growth). Here, for example, is oil on the H4 timeframe (four-hour chart):
Price has broken the Senkou Span line and entered the Ichimoku cloud in an area of secondary multidirectional movement. If the price breaks through the resistance level of 32.32 on the closed four-hour bar, then we can talk about the beginning of an upward price movement (on this timeframe).
On the hourly chart, the price has been in an uptrend for many hours:
Because on the weekly timeframe the price is falling (on the daily timeframe too) .... they (commentators) can't keep saying "shit, shit..."... they would get fired from their jobs ... so they make a so-called "move" in the media, showing how the price rises intraday.
They could have published ticks on the one-minute chart :)
Although with the ruble any increase in oil is a good thing.
You can see with the naked eye that it has never even thought about growing - since the end of the Soviet Union
As for its correlation with oil - and correlation of anything with anything at all - I think it is pure coincidence. If we take the rouble, if we make a similar graph we can clearly see that the rouble has been correlated with oil since around 2003.
The ruble is falling... Tying the budget to oil. So they would lock the ruble and oil with some kind of chip and tie the budget to this locus. I do not understand why they are racking their brains... That is the end of stability - live and prosper.