Discussion of article "Self-adapting algorithm (Part III): Abandoning optimization"
GREAT work,
thank you!
I closely follow all your articles, how ever,
I hope you noticed that your box calculation algorithm as you published it, has a repainting factor specially when the market goes side way and horizontal boxes are being drawn. Every now and then after the horizontal zone is broken, the number of boxes differs in the history. Knowing that you are looking in the number of boxes, I can think of two different solutions :
1- find the reason for this repainting and fix it
2- find a way to identify these horizontal zones and count 1 for bullish and 1 for bearish boxes and don't calculate the rest of the boxes being drown on this zone !
These pictures should help.
In the first picture we see total of 5 boxes : https://prnt.sc/10secab
In the second picture, with addition of a single box, not only we loose that horizontal drawing , but also two boxes being drawn bellow the others : https://prnt.sc/10seczw
And few box later, we get three boxes instead of 5 : https://prnt.sc/10segad
The second condition shows that we can't even rely on the 1-1 counting scenario, how ever, if we would not care about the noise, we can see 5 boxes there, however, the last picture shows that we can't rely on this "assumption" and the number of boxes will differ during on time. I am not using the ATR setting with default values for the indicator (just flipped the colors) on GBPUSD-M1.
As I see it, you should really sit back and find this repainting (recalculating with different result) issue before proceeding forward.
Yes, blocks do redraw if they are drawn to the left of a fixed time. I know this is not a problem, this is done on purpose. For those purposes that use this indicator, this situation is a plus. When the blocks are being built, due to their fixed size, create some kind of inaccuracy in determining the trend area. To reduce this error to a minimum and find the maximum trend scale, such a mechanism was made. When blocks are drawn to the right of the fixed time, they are not redrawn.
Very interesting work! Thank you for sharing the approach.
Most of the times, the price go beyond the 100% of the overlays... but all times it go to...
I only read the architecture part of the documents.
Very interesting work! Thank you for sharing the approach.
Most of the times, the price go beyond the 100% of the overlays... but all times it go to...
I only read the architecture part of the documents.
The algorithms described in the last two articles are quite stable. With the same settings, I tested them on 56 shares of the SP500 (5 years), 28 shares of Russian companies (8 years), 28 currency pairs (9 years) and 17 cryptocurrency pairs (3 years). There was no optimization, the robot did everything by itself and showed a stable result, showed a profit based on the results of all tests. One way or another, but he trades in a plus, taking into account all commissions. But there is still work to be done.
This is how it works on 28 SP 500 shares:
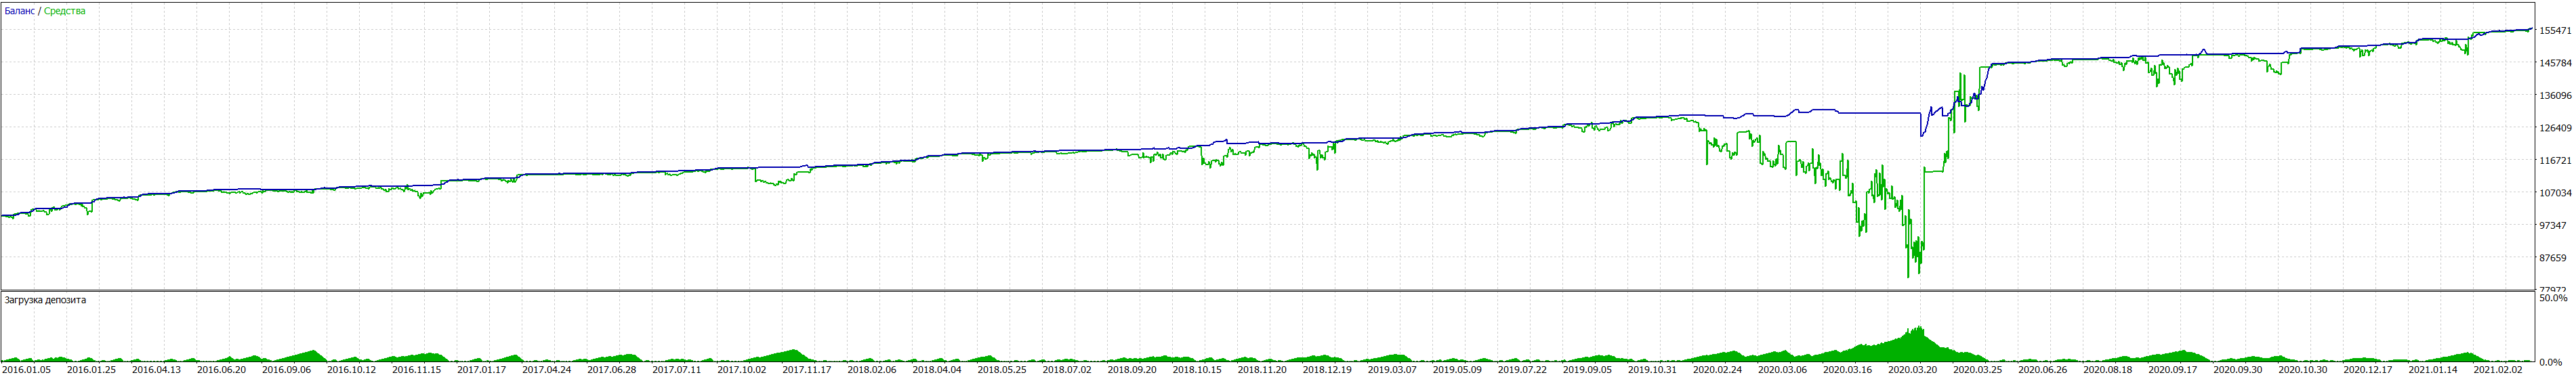
and like this on 28 Russian stocks, with the same settings
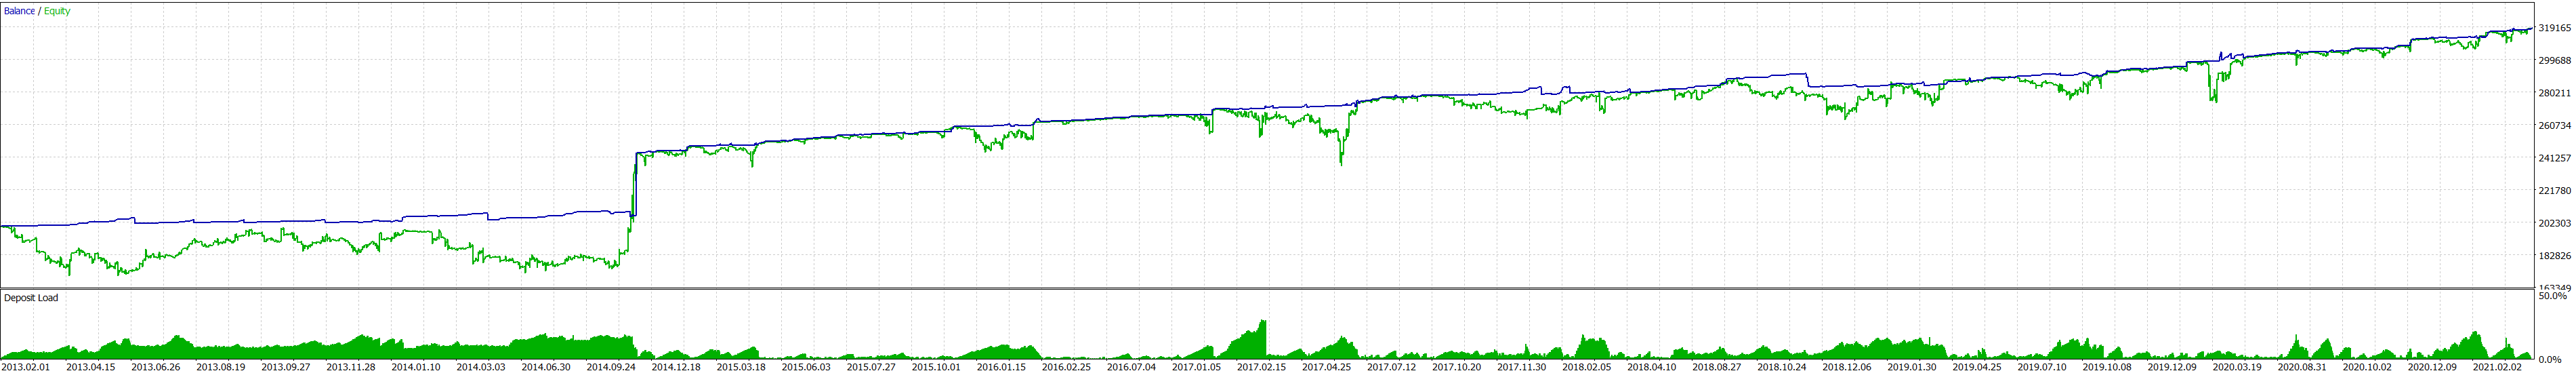
I have been thinking for a long time in the direction that movement does not end with efficiency and a new movement does not start with this. It is clear that no equilibrium exists and the market, always trying to come to equilibrium, creates new deviations from equilibrium. While the market is trading, it is always out of balance. And the more active the trade is, the greater the inflow of funds, the greater the deviation from equilibrium. But you need to rely on something, you still need some kind of zero point. On each scale, this zero point is located in different places, so when on one scale the market reaches the zero point, on the other scale it, on the contrary, leaves it. It turns out that there is a feedback from large to smaller scales in the form of money supply.
I do not post new codes because they are already more expensive. Even the codes that I posted brought me money, and I am not ready to lay out the current developments in the open.
Os algoritmos apurados nos dois artigos são bastante estáveis. Com as configurações, testei-os em 56 ações do SP500 (5 anos), 28 ações de empresas russas (8 anos), 28 pares de moedas (9 anos) e 17 pares de criptomoedas (3 anos). Não houve otimização, o robô fez tudo sozinho e apresentou resultado estável, ganho lucro com base nos resultados de todos os testes. De uma forma ou de outra, ele negocia com vantagem, levando em consideração todas as comissões. Mas ainda há trabalho a ser feito.
É assim que funciona em 28 compartilhamentos SP 500:
e assim em 28 ações russas, com as configurações de configurações
Há muito tempo que penso na direção de que o movimento não termine com eficiência e um novo movimento não confortável com isso. É claro que não existe equilíbrio e o mercado, sempre tentando se equilibrar, cria novos desvios do equilíbrio. Enquanto o mercado está operando, ele está sempre desequilibrado. E quanto mais ativo o comércio, quanto maior o influxo de fundos, maior o desvio do equilíbrio. Mas você precisa confiar em algo, ainda precisa de algum tipo de ponto zero. Em cada escala, esse ponto zero está localizado em lugares diferentes, então quando em uma escala o mercado chega ao ponto zero, na outra escala ele, ao contrário, sai dele. Acontece que há um feedback de escalas grandes para escalas menores na forma de oferta de moeda.
Não posto novos códigos porque já são mais caros. Mesmo os códigos que postei me trouxeram dinheiro, e não estou pronto para expor os desenvolvimentos atuais abertamente.
Seu trabalho é incrível e eu vejo nele, mas de outra dimensão ...
Considerando que em uma vela (fatia comprimida e referenciada do preço), após o mesmo número de que você encontra para a eficiência em seu trabalho, uma variação entre a abertura e o fechamento igual à variação que não se reflete, a volatilidade parte da vela. Todas as velas em todos os prazos, movimentos, instrumentos, qualquer fatia do preço, têm o mesmo efeito. É por isso que você obtém quase os mesmos resultados em todos os instrumentos. Podemos considerar, que um movimento, só termina quando o retrocesso chega a 50%. O equilíbrio. Acho que estamos nos tocando no mesmo lugar ... Como já disse, não sou um especialista em matemática e demorei alguns anos para chegar lá ... Contar velas pode ser um método muito rude ...:)
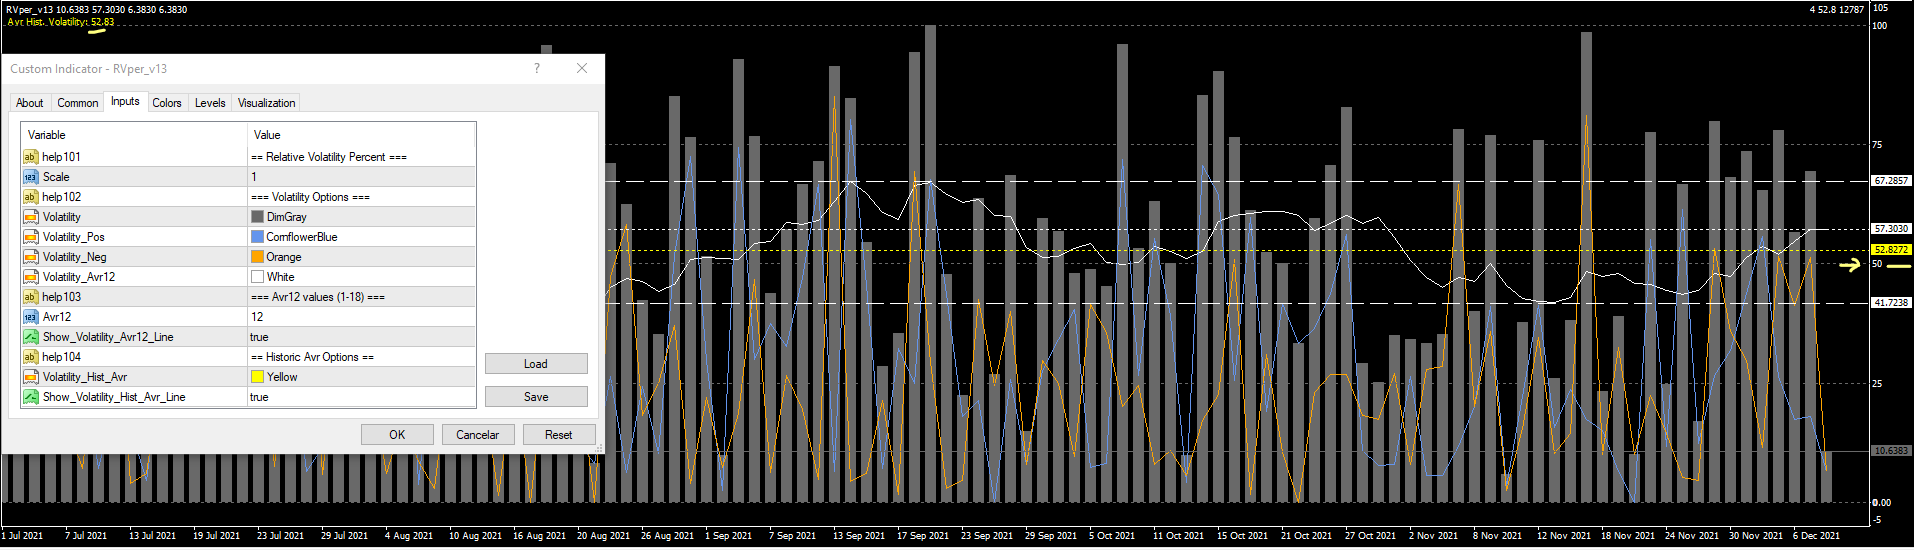
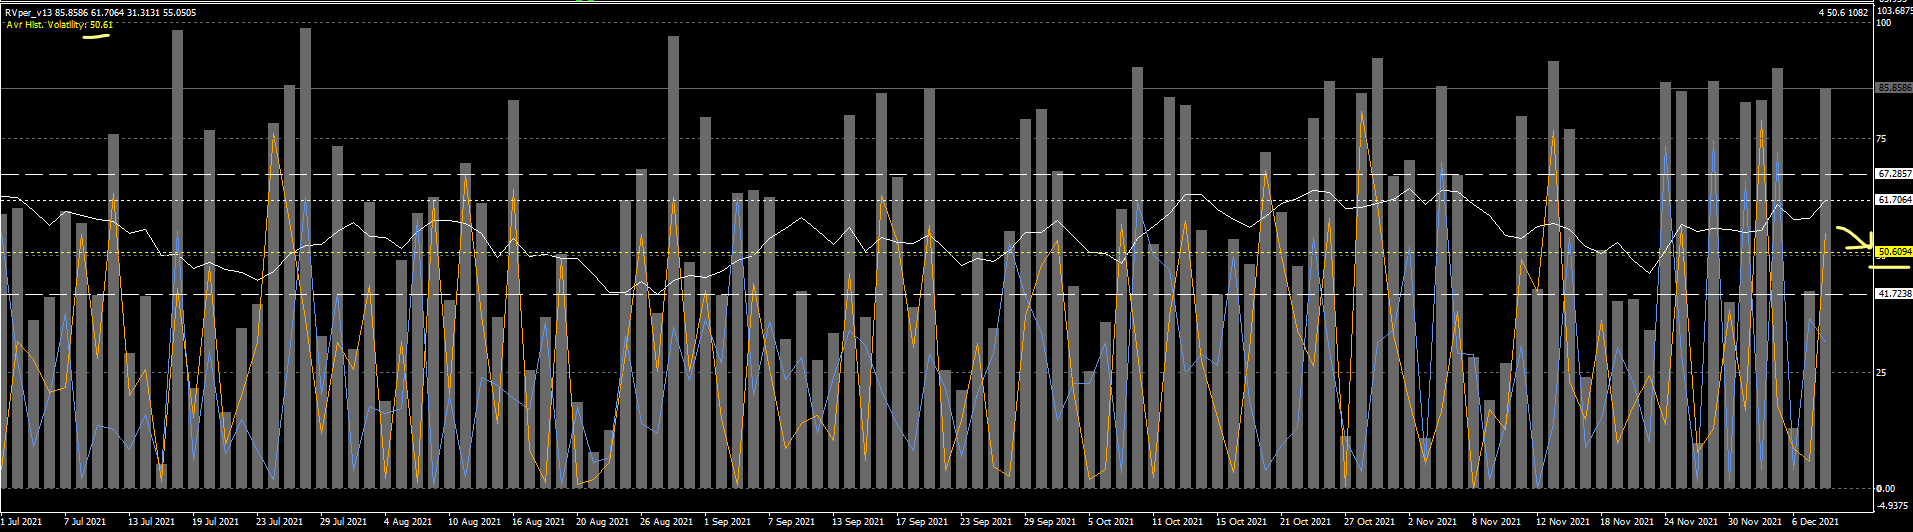
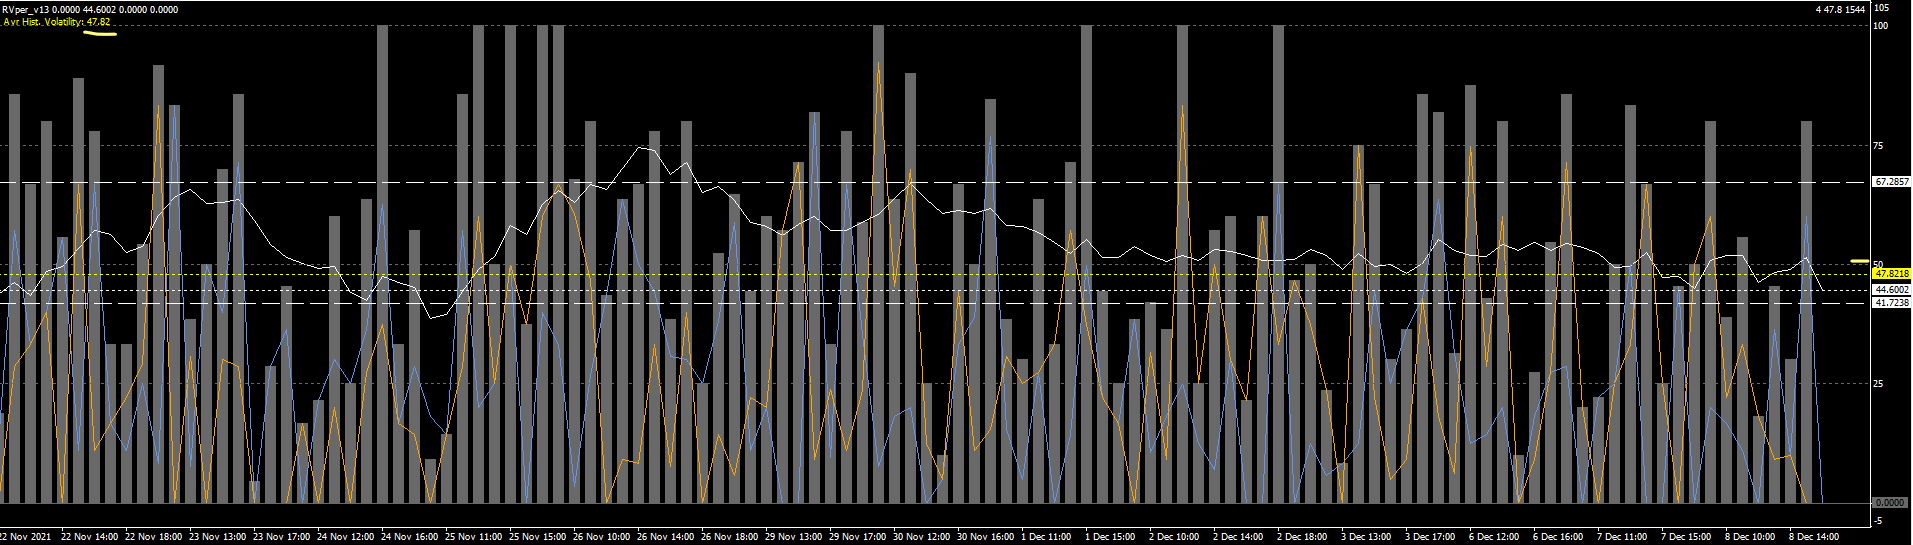
Abaixo, a imagem representa as variações de volatilidade das velas de dias em EURUSD, BRENT & SIEMENS, onde a última vela é hoje. EURUSD BRENT SIEMENS AG
PS - talvez quando o número de velas para igual ao mesmo acúmulo de variações ...? Quem sabe! :)
E eu acho o contrário ... quanto mais liquidez, mais equilíbrio / equilíbrio. Esse método tende a ser melhor e garantido com mais liquidez ... É favorável para o futuro.
Seu trabalho é incrível e eu vejo nele, mas de outra dimensão ...
Considerando que em uma vela (fatia comprimida e referenciada do preço), após o mesmo número de que você encontra para a eficiência em seu trabalho, uma variação entre a abertura e o fechamento igual à variação que não se reflete, a volatilidade parte da vela. Todas as velas em todos os prazos, movimentos, instrumentos, qualquer fatia do preço, têm o mesmo efeito. É por isso que você obtém quase os mesmos resultados em todos os instrumentos. Podemos considerar, que um movimento, só termina quando o retrocesso chega a 50%. O equilíbrio. Acho que estamos nos tocando no mesmo lugar ... Como já disse, não sou um especialista em matemática e demorei alguns anos para chegar lá ... Contar velas pode ser um método muito rude ...:)
Abaixo, a imagem representa as variações de volatilidade das velas de dias em EURUSD, BRENT & SIEMENS, onde a última vela é hoje. EURUSD BRENT SIEMENS AG
PS - talvez quando o número de velas para igual ao mesmo acúmulo de variações ...? Quem sabe! :)
E eu acho o contrário ... quanto mais liquidez, mais equilíbrio / equilíbrio. Esse método tende a ser melhor e garantido com mais liquidez ... É favorável para o futuro.
I no longer analyze candles. Why, I described in detail in this article https://www.mql5.com/en/articles/8136
But in short: the time discretization of the price introduces a random component, which it is desirable to get rid of.
At the moment, I work with blocks of N points, but the size of the blocks is not static, but dynamic and changes from the shape of the graph. I have developed a mechanism for the "correct" price quantization, which removes the random component from the price series to the maximum.
My robot shows the same results on different instruments because I specifically tried to understand how pricing on some assets differs from pricing on others. When we look at the candles, the caritna is distorted and we do not understand why EURUSD differs from oil, we do not understand the fundamental reasons. But if you apply the correct discretization, then everything becomes much easier and the foundation becomes clear.
I have not yet described this in the articles, but the price series have some peculiarities. That they are not linear. The price series is always an x / y function and it has non-linearity. And by analyzing blocks of non-linear size, the structure of the market becomes visible. Most of the assets are trending, but there are also those that are flat. Moreover, for growth, they can be trend, and for a fall, they can be flat. That is, you have correctly shown that it is necessary to separately analyze the rising and falling phases of the market. I had to develop my own concept of trends and I wrote about them in this article https://www.mql5.com/en/articles/8184
That is, the market has fundamental reasons to deviate from the 50% probability. And this reason is the zero point around which it fluctuates. But as far as I understand, you need to analyze not only the last values, but the previous values. Historical values act as an additional coefficient to the current deviations, increasing or decreasing their significance.
On the graph, what did you show, the scale as a percentage, did I understand correctly?

- www.mql5.com
I no longer analyze candles. Why, I described in detail in this article https://www.mql5.com/en/articles/8136
But in short: the time discretization of the price introduces a random component, which it is desirable to get rid of.
At the moment, I work with blocks of N points, but the size of the blocks is not static, but dynamic and changes from the shape of the graph. I have developed a mechanism for the "correct" price quantization, which removes the random component from the price series to the maximum.
My robot shows the same results on different instruments because I specifically tried to understand how pricing on some assets differs from pricing on others. When we look at the candles, the caritna is distorted and we do not understand why EURUSD differs from oil, we do not understand the fundamental reasons. But if you apply the correct discretization, then everything becomes much easier and the foundation becomes clear.
I have not yet described this in the articles, but the price series have some peculiarities. That they are not linear. The price series is always an x / y function and it has non-linearity. And by analyzing blocks of non-linear size, the structure of the market becomes visible. Most of the assets are trending, but there are also those that are flat. Moreover, for growth, they can be trend, and for a fall, they can be flat. That is, you have correctly shown that it is necessary to separately analyze the rising and falling phases of the market. I had to develop my own concept of trends and I wrote about them in this article https://www.mql5.com/en/articles/8184
That is, the market has fundamental reasons to deviate from the 50% probability. And this reason is the zero point around which it fluctuates. But as far as I understand, you need to analyze not only the last values, but the previous values. Historical values act as an additional coefficient to the current deviations, increasing or decreasing their significance.
On the graph, what did you show, the scale as a percentage, did I understand correctly?
Thank you for your reply.
As I run before that you write, I only understand some things after... :)
Yes, I understood your price/candles now and it is an accurate way as I told with delay.
Yes too, my images are with % of volatility.
As I said before, all periods in average, candles, movements, any part of the price, the open close is 50% of the variation that occur inside any period, the truly change, the others 50%, are not reflected...
As I said too, the candles are only a compressed and a referenced piece of the price, but as you said, is not the best reference for your work and now, I understood and is an well approach. You create your own system to slice the price :)
I will continue reading your articles. Very good material. Thank you for sharing!
Below, for curiosity, is an image of the EURUSD daily variations % (volatility plus price change)
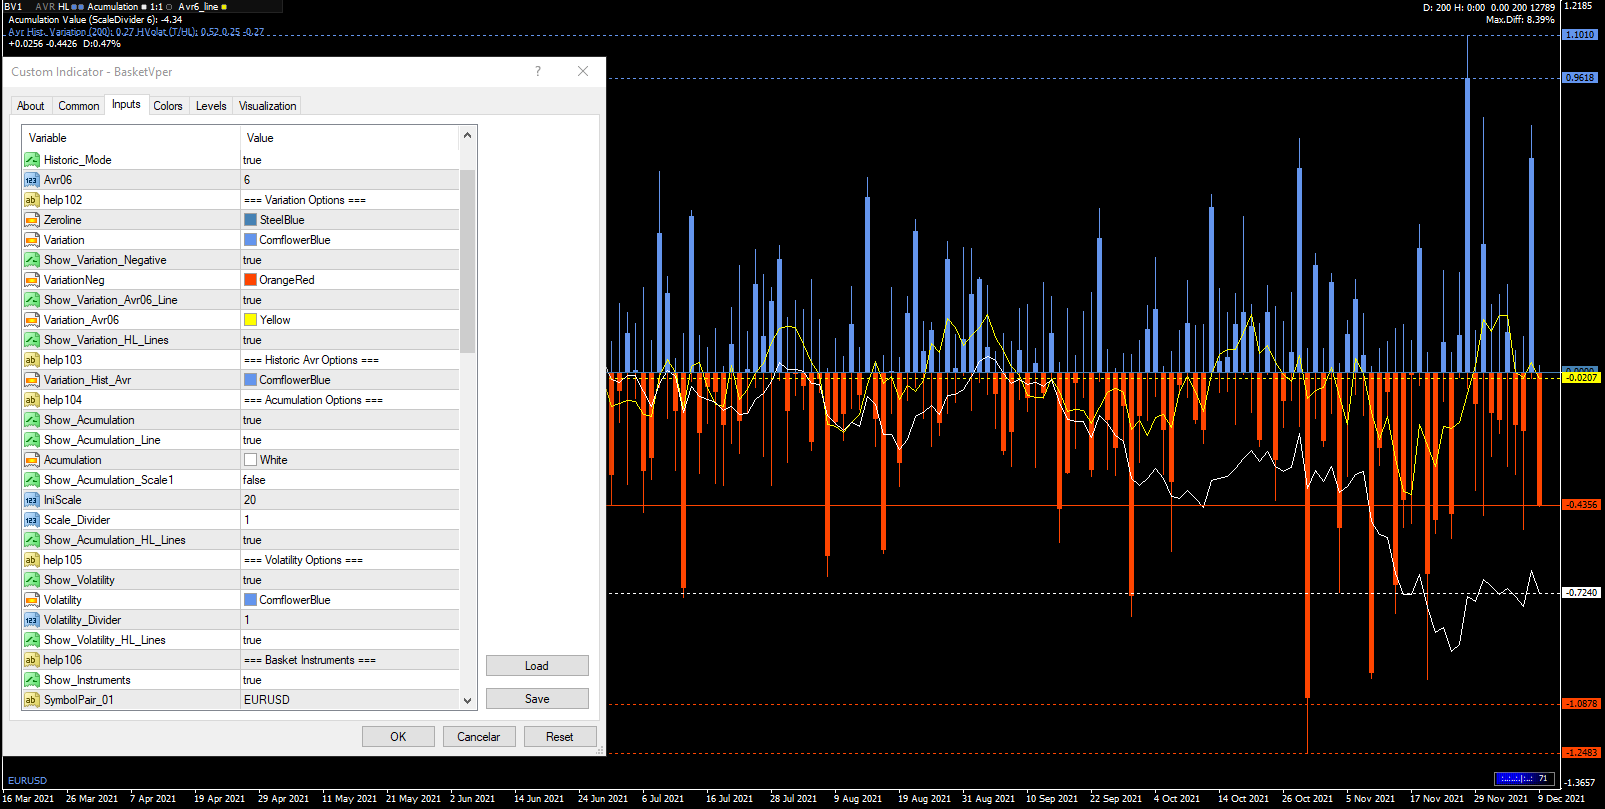
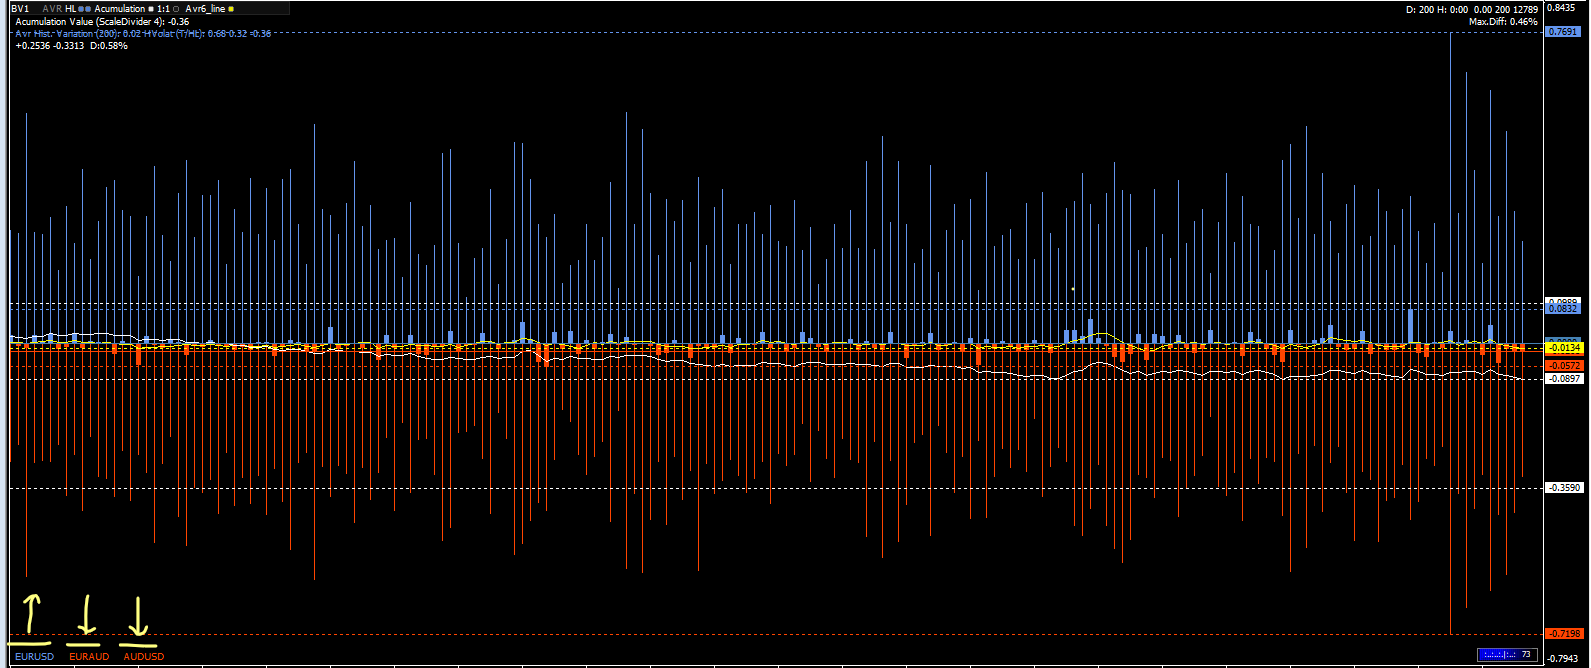
Daily superimposed candles variations % of EURUSD, EURAUD & AUDUSD. If you open a position with the same margin on each one, the result after three months will be the cost of the spread and swap.
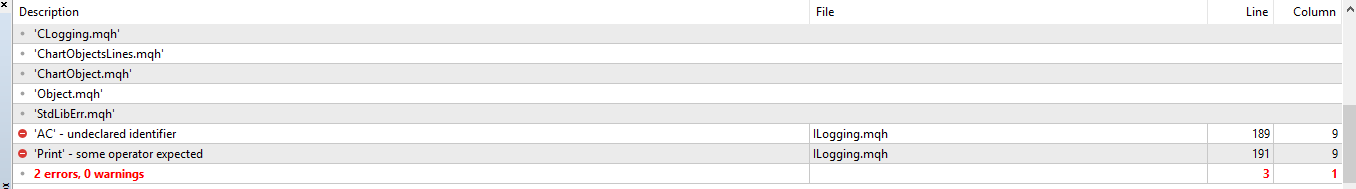
yourindicators shows errr
- Free trading apps
- Over 8,000 signals for copying
- Economic news for exploring financial markets
You agree to website policy and terms of use
New article Self-adapting algorithm (Part III): Abandoning optimization has been published:
It is impossible to get a truly stable algorithm if we use optimization based on historical data to select parameters. A stable algorithm should be aware of what parameters are needed when working on any trading instrument at any time. It should not forecast or guess, it should know for sure.
In the new version, I decided not to use candles because of their unstable parameters. More precisely, only M1 candles are to be used because moving on to handling ticks leads to a significant increase in resource consumption. Ideally, it is better to handle ticks.
I will analyze blocks of N points. The blocks are similar to renko but they are based on a slightly different algorithm. I have already mentioned block charts and their advantages in analysis in the article "What is a trend and is the market structure based on trend or flat".
Figure 1. Block chart
Figure 1 shows a block chart. The general view of the block chart is shown in the bottom part of the figure, while the upper image demonstrates how blocks look on the price chart. BLocks are built into the past and future from a fixed time. In the figure, the fixed time is shown as a yellow vertical line. This is a zero point, from which blocks are built into the past and future. The construction algorithm is mirrored. The fact that the blocks are built into the past and the future will be important in further development.
Blocks are needed because their main parameters are stable, controllable and, most importantly, profit/loss depends mainly on price movement in points.
Author: Maxim Romanov