Multi Time Frame ( MTF ) indicator

- www.mql5.com
Was a solution to this ever given?
Thanks.finally i know that it is a mt4 or mt5 property. they can can just save limited candle data. ( i think it was 1440 candle at each timeframe) and if you want more of them you must open the chart every day. by this action information of them saved to your PC and you can use them.
finally i know that it is a mt4 or mt5 property. they can can just save limited candle data.
( i think it was 1440 candle at each timeframe) and
if you want more of them you must open the chart every day. by this action information of them saved to your PC and you can use them.
Hello,
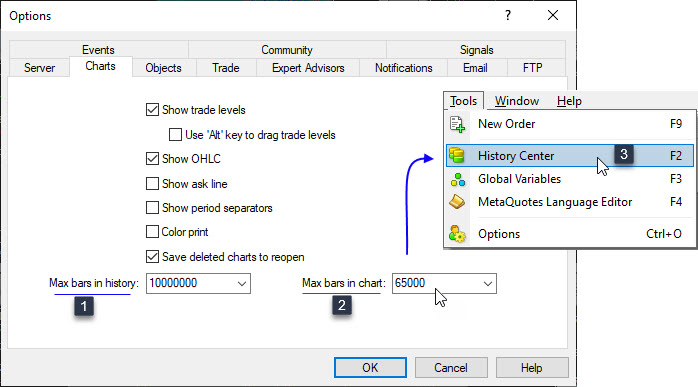
You may solve it by this way:
Tools -> Option -> Charts.
Note.
As long as your broker provides more complete data,
> then your charts will have more complete data.
There are some countries that limit the completeness of data in chart history.
An example is India. The broker only provides historical data for the past 3 months.
Regards.
- Free trading apps
- Over 8,000 signals for copying
- Economic news for exploring financial markets
You agree to website policy and terms of use
Hi. I have created an MFT indicator that for each candlestick in the current time frame, sums the volume of the bearish and bullish candles in the M1 time frame separately and shows it in the diagram. But my problem is that the graph is only shown in a small interval and does not calculate the rest of the values. Can you help me solve the problem?