How to identify a flat trend
https://www.mql5.com/en/forum/9950/page76

- 2016.08.12
- www.mql5.com
Market Condition Evaluation based on standard indicators in Metatrader 5 - forum thread
When should I jump on - forum thread
-------------
Forum on trading, automated trading systems and testing trading strategies
Market Condition Evaluation based on standard indicators in Metatrader 5
Sergey Golubev, 2019.05.21 10:06
Market Phase Index MT4 - indicator for MetaTrader 4
and
Market Phase Index MT5 - indicator for MetaTrader 5
----------------

Indicator to determine the trend and flat market based on the amplitude of the price and the intersection of bars.
- If the indicator values are higher than 0.4, it is recommended to trade based on trend strategies.
- If the indicator values below 0.4 - recommended trading based on flat strategies.

- 2012.12.29
- www.mql5.com
Forum on trading, automated trading systems and testing trading strategies
How to Start with Metatrader 5
Sergey Golubev, 2016.08.12 19:08
If you are the coder so you can look at this indicator (inside the code) related to the market condition -AbsoluteStrengthMarket - indicator for MetaTrader 5
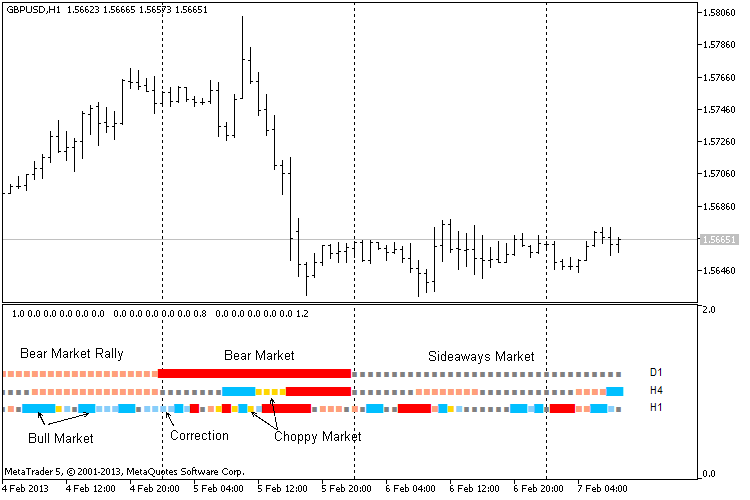
This indicator with a sufficient accuracy allows defining 6 market states, exactly:
- Bull market (Bull Market).
- Bear market (Bear Market).
- Correction (Correction) in a bull market.
- Correction in a bear market (Bear Market Rally).
- Choppy market (Choppy Market).
- Flat market (Sideways Market).
By the way, AbsoluteStrength indicator (on the way I described it on the posts above) is used as a filter for some martingale EAs ... and there is some term (terminology) related to it - Control Martingale, means - trading in predefined market condition only. For example, trading correction/rally only, trading ranging only, trading on the flat only (for martingale scalpers), trading bullish/bearish trend only (trend following EAs), and so on.
..and more on the forum and on CodeBase.
----------------
How to make a search on the forum
https://www.mql5.com/en/forum/193510

- 2017.05.29
- www.mql5.com
I was searching for something easier such as ADX and/or ATR solution.
I was searching for something easier such as ADX and/or ATR solution.
You can use many standard indicators to determine the market condition (MACD, and so on).
And it depends about how you read the indicators and how often you used them to determine the market condition (it may be good to have some experience for example).
because flat = no uptrend and no downtrend on the same time.
do not confuse with ranging market condition:
because ranging = buy/uptrend and sell/downtrend on the same time.
"buy" and "sell" are estimated confirmation by indicators.
----------------
Average True Range - Oscillators - MetaTrader 5 Help
Average True Range can often reach a high value at the bottom of the market after a sheer fall in prices occasioned by panic selling. Low values of the indicator are typical for the periods of sideways movement of long duration which happen at the top of the market and during consolidation. Average True Range can be interpreted according to the same principles as other volatility indicators. The principle of forecasting based on this indicator can be worded the following way: the higher the value of the indicator, the higher the probability of a trend change; the lower the indicator’s value, the weaker the trend’s movement is.
You need to search by yourself because there is a lot of the information incl codes in documentation, special indicators on CodeBase, the threads on the forum and the EAs by source codes on the forum which work in particular market condition. So, this subject is well-depends in theory and in practics including the coding and trading.
How to make a search on the forum
https://www.mql5.com/en/forum/193510

- www.metatrader5.com
You can use many standard indicators to determine the market condition (MACD, and so on).
And it depends about how you read the indicators and how often you used them to determine the market condition (it may be good to have some experience for example).
because flat = no uptrend and no downtrend on the same time.
do not confuse with ranging market condition:
because ranging = buy/uptrend and sell/downtrend on the same time.
"buy" and "sell" are estimated confirmation by indicators.
----------------
Average True Range - Oscillators - MetaTrader 5 Help
Average True Range can often reach a high value at the bottom of the market after a sheer fall in prices occasioned by panic selling. Low values of the indicator are typical for the periods of sideways movement of long duration which happen at the top of the market and during consolidation. Average True Range can be interpreted according to the same principles as other volatility indicators. The principle of forecasting based on this indicator can be worded the following way: the higher the value of the indicator, the higher the probability of a trend change; the lower the indicator’s value, the weaker the trend’s movement is.
You need to search by yourself because there is a lot of the information incl codes in documentation, special indicators on CodeBase, the threads on the forum and the EAs by source codes on the forum which work in particular market condition. So, this subject is well-depends in theory and in practics including the coding and trading.
How to make a search on the forum
https://www.mql5.com/en/forum/193510
So what's your point about trend type on those three graphs?
So what's your point about trend type on those three graphs?
I've developed a strategy which it's working fine on flat trends such as EURUSD and some periods of other currency pairs, so I would like to adapt it to work multipair.
Look at this results from the last 3 years:
EURUSD, profitable during the whole period.
GBPJPY, non-profitable cause long trends.
NZDCAD, profitable during the last year.
I would appreciate if somebody sheds some light on this topic.
The only way is to test the input parameters on the pairs you want to use it on
I've developed a strategy which it's working fine on flat trends such as EURUSD and some periods of other currency pairs, so I would like to adapt it to work multipair.
Look at this results from the last 3 years:
EURUSD, profitable during the whole period.
GBPJPY, non-profitable cause long trends.
NZDCAD, profitable during the last year.
I would appreciate if somebody sheds some light on this topic.
The question is not accurate. You asked how to identify a flat trend, which has two meanings:
1. How to identify that what happened up to that point in time is a flat trend (that's possible, but I'm afraid it's not what you mean).
2. How to identify if the market from now on will be in a flat or trending (that's impossible, but I'm afraid it's what you really want, because the tests you supply probably are done when the trend / flat is already known, after they have happened).
In conclusion, If any one knew when the markets are flat, it implies they also know when they are trending (when not flat) - and from that point its very easy making money. The problem is that markets are unexpected, even when trending, they can suddenly correct themselves counter-trend, etc.
So the best we can do, is go for #1 - and hope it will continue, which can't be guaranteed.
- Free trading apps
- Over 8,000 signals for copying
- Economic news for exploring financial markets
You agree to website policy and terms of use
I've developed a strategy which it's working fine on flat trends such as EURUSD and some periods of other currency pairs, so I would like to adapt it to work multipair.