MetaTrader5 python library
I've discovered this library today and I've started to play with it. I was looking for answers in the forum but I didn't found...
My first question is about getting data from copy_rates_range and copy_ticks_from.
It seems that for all periods the maximum number of bars obtained is 100k. I mean the result from
gives a range of data between 2020-02-19 20:36:00 and 2020-05-27 16:52:00, independently of "start" (i.e., the last 100k minutes, nothing when "end" is below the upper range of the previous range).
Instead, when I try to obtain tick data:
the range goes from 2013-05-22 03:54:12 to 2013-05-22 20:19:19. That is I can obtain all ticks (by batches) from 2013 and only all minutes from Feb-2020.
This is quite strange, isn't it? It depends only on the broker?
I was trading/checking code with a demo account. In order to open a trade I used:
When I use this piece of code twice, with different comments, sl or tp, in the terminal both orders appear joined with the comment, sl or tp from the last execution (also when I look for open positions in python with positions_get). How can I obtain two different orders (with different tickets and identifiers)?
I hope these questions are not too obvious...
Thank you in advance for your replies.
It sounds like you're on a netting account where all your trade transactions are merged into a single position. If you want multiple positions in the same instrument you'll need to use a hedging account.
It sounds like you're on a netting account where all your trade transactions are merged into a single position. If you want multiple positions in the same instrument you'll need to use a hedging account.
I always worked with MT4 and never had this problem even for demo accounts.
You are right, when I open positions directly from the terminal the same happens, so it is not a problem from the python package but it is from the account itself.
Solved with my broker (hedging allowed by default in MT4 but not in MT5).
Thanks!

- www.mql5.com
No worries. Also, make sure you open settings in your terminal and then go to the chart tab and set maxbars to Unlimited. That should fix your first problem.
Yes, I did it. However, I have a problem (possibly from my broker) with the data quality. More precisely,
start_time = time.time()
init_mql5()
df = mt5.copy_rates_range(symbol, mt5.TIMEFRAME_M1, start, end)
mt5.shutdown()
df = pd.DataFrame(df)
df['time']=pd.to_datetime(df['time'], unit='s')
print('Range: {}-{}'.format(df.time.min(), df.time.max()))
print('{} bars loaded'.format(len(df)))
print("Elapsed time: {}".format(str(timedelta(seconds=time.time() - start_time))))
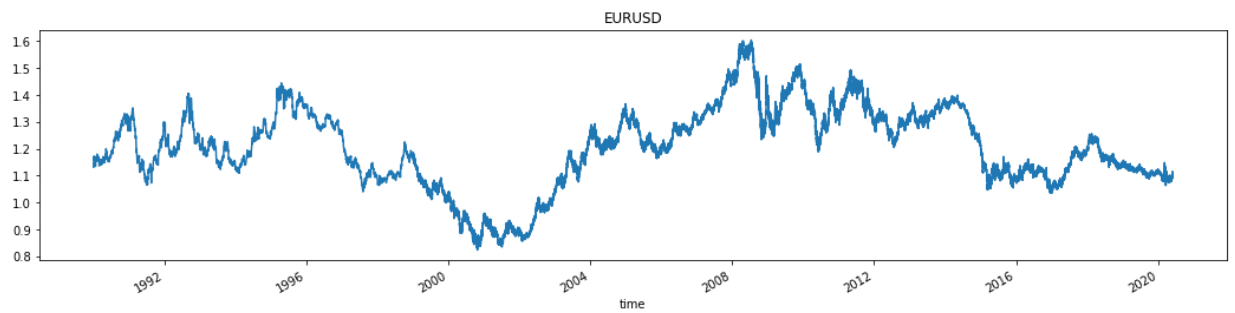
df.set_index('time').close.plot(title=symbol, figsize=(18,4))
display(df.head(2))
display(df.tail(2))
df['date'] = df.time.dt.date
df['year'] = df.time.dt.year
df['month'] = df.time.dt.month
df['dow'] = df.time.dt.dayofweek
#Only from Monday to Thursday
fig = df[df.dow<4].groupby(['date']).time.count().reset_index().rename(columns={'time': 'n_minutes_for_day'}).set_index('date')\
.plot(figsize=(18,4), title='Number of minutes loaded per day from Monday to Thursday ({} expected minutes)'.format(24*60))
plt.axhline(y=24*60, color='r', linestyle='--')
plt.axhline(y=24*60-60, color='r', linestyle='--')
plt.show()
The following plot from Monday to Thursday shows that I can obtain data from de end of the 90' up to now (first years only have a minute...).However, the quality 2007-2008 (aprox.) seems to be quite bad...
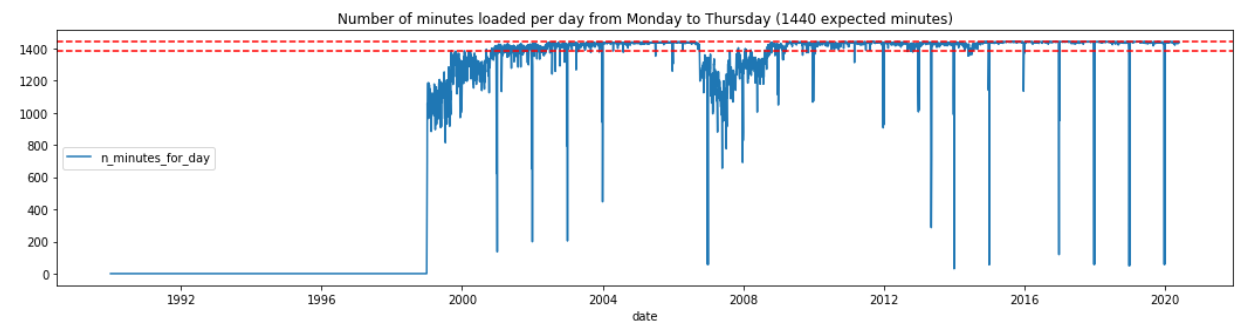
The quality from 2009-2013 seems to be quite good and from 2014- really good...
- Free trading apps
- Over 8,000 signals for copying
- Economic news for exploring financial markets
You agree to website policy and terms of use
I've discovered this library today and I've started to play with it. I was looking for answers in the forum but I didn't found...
My first question is about getting data from copy_rates_range and copy_ticks_from.
It seems that for all periods the maximum number of bars obtained is 100k. I mean the result from
timezone = pytz.timezone("Etc/GMT-2")
start = datetime(1974, 1, 1, tzinfo=timezone)
end = datetime(2021, 1, 1, tzinfo=timezone)
symbol = 'EURUSD'
start_time = time.time()
df = mt5.copy_rates_range(symbol, mt5.TIMEFRAME_M1, start, end)
df = pd.DataFrame(df)
df['time']=pd.to_datetime(df['time'], unit='s')
print('Range: {}-{}'.format(df.time.min(), df.time.max()))
print('{} bars loaded'.format(len(df)))
print("Elapsed time: {}".format(str(timedelta(seconds=time.time() - start_time))))
df.set_index('time').close.plot(title=symbol, figsize=(18,4))
display(df.head(2))
gives a range of data between 2020-02-19 20:36:00 and 2020-05-27 16:52:00, independently of "start" (i.e., the last 100k minutes, nothing when "end" is below the upper range of the previous range).
Instead, when I try to obtain tick data:
start = datetime(1974, 1, 1, tzinfo=timezone)

start_time = time.time()
eurusd_ticks = mt5.copy_ticks_from(symbol, start, 100000, mt5.COPY_TICKS_ALL)
ticks_frame = pd.DataFrame(eurusd_ticks)
ticks_frame['time']=pd.to_datetime(ticks_frame['time'], unit='s')
ticks_frame['time_msc']=pd.to_datetime(ticks_frame['time_msc'], unit='ms')
# display ticks on the chart
ticks_frame.set_index('time_msc')[['ask', 'bid']].plot(title='EURUSD ticks', figsize=(18,4))
print('Range: {}-{}'.format(ticks_frame.time_msc.min(), ticks_frame.time_msc.max()))
print('{} bars loaded'.format(len(df)))
print("Elapsed time: {}".format(str(timedelta(seconds=time.time() - start_time))))
display(ticks_frame.head(2))
the range goes from 2013-05-22 03:54:12 to 2013-05-22 20:19:19. That is I can obtain all ticks (by batches) from 2013 and only all minutes from Feb-2020.
This is quite strange, isn't it? It depends only on the broker?
I was trading/checking code with a demo account. In order to open a trade I used:
When I use this piece of code twice, with different comments, sl or tp, in the terminal both orders appear joined with the comment, sl or tp from the last execution (also when I look for open positions in python with positions_get). How can I obtain two different orders (with different tickets and identifiers)?
I hope these questions are not too obvious...
Thank you in advance for your replies.