MQL5.com Freelance: Developers' Source of Income (Infographic)
It would be possible to make a dynamic top, so that the user could choose his own criteria for building the list.... For example, by the criterion "Total earnings" the TOP would look different.... Yes, I support my colleague who says that the TOP does not take into account other merits... for example, GODZILLA, a multi-tasker, would be somewhere close....
Infographics are not MQ's style. Surprisingly...
That's how there are rankings... top by rating) Add different tops just so others won't be offended).
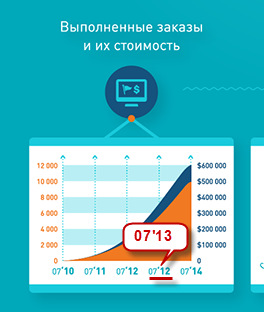
Looks like the last chart got the average cost figures mixed up during layout. We will check and correct, thank you for your attention.
You may not trust it, but take it and calculate it yourself - all information is publicly available in the top section of the service.
Looks like the typesetter is going to be stripped of his bonus....
- Free trading apps
- Over 8,000 signals for copying
- Economic news for exploring financial markets
You agree to website policy and terms of use
Four years have passed since the launch of the MQL5 Freelance service. In June 2010, it was launched together with the Payments service allowing users to order and pay for the development of MQL applications without leaving the MQL5.com website. The service was then called Jobs, and nobody could imagine what the future had in store for it.
On the occasion of the MQL5 Freelance Service fourth birthday, we have prepared an info-graphic demonstrating the service results for the entire time of its existence. The figures speak for themselves: more than 10 000 orders worth about $600,000 in total have been executed to date, while 3 000 customers and 300 developers have already used the service.
Check out the interesting data collected. These figures have never been published before. A similar info-graphic about the Market service results will be also provided soon.