Discussion of article "Exploring Seasonal Patterns of Financial Time Series with Boxplot"
Matstat is good) I also follow the approach of looking for differences between prices and SB (one of the possible models of efficient market). By the way, Fama himself does not adhere to this theory very much anymore because of the problem with its verification.
The first impression of the article is good, except that I didn't see the test of statistical significance of deviations. But this is not so important in comparison with their "economic" significance)
Matstat is good) I also follow the approach of looking for differences between prices and SB (one of the possible models of efficient market). By the way, Fama himself doesn't really adhere to this theory anymore because of the problem with its verification.
The first impression of the article is good, except that I didn't see the test of statistical significance of deviations. But this is not so important in comparison with their "economic" significance)
It seems that an article written in the language of a housewife usually goes down better and is easier to apply later in practice :)
1. 10 years of analysis without logarithmisation - you can run into skewness. A point 10 years ago and now are two big differences.
2. Why are there places where the whiskers hit the body?
Напишем простого торгового эксперта, который будет эксплуатировать найденную закономерность на рис. 9. А именно предположение о том, что с 0.00 до 04.00 часов по GMT+2 цены на пару EURUSD растут относительно своего среднего, на протяжении всех четырех часов.
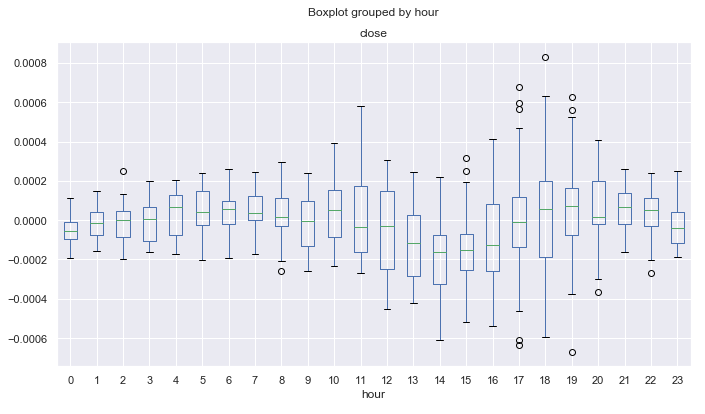
It is clear from the chart in Figure 9 that the maximum difference between the closing prices and the moving average, over this period, is -0.0002 points, and the average is above zero.
3. Is zero in the negative zone or am I misinterpreting?
4. -0.0002 is below no value. Why is the condition triggered then?
This validation bot does not have stops and other checks and is only designed to check if there is a pattern.
5. For speeding up in countorders, it is better to do a reverse loop and refuse to check for a symbol and magic. It will be noticeably faster on such an "idle" robot.
Even faster is the flag true after OrderSend and false - OrderClose.
Another disadvantage is that the distributions are evaluated only at closing prices, because of which outliers in prices are not taken into account.
6. It is solved by the "at opening prices" mode.
Let's allow opening trades only in 0-1 hours, with the assumption that in the next few hours the trade will still be closed in profit, because the deviation from the average tends to be positive.
7. I would apply BestInterval at once. And at once - without time limits in the code of the very first version of the robot.
Among the advantages of this approach we can highlight the work with specific market patterns and virtually no overoptimisation in terms of parameter selection, thanks to which the TS can have high stability.
8. Disagree. There are only three parameters in the TS: the MA period, upper and lower deviation limits. It's a sin not to run it on M15-open Optimisation and get the whole picture within a few minutes. Even the things that escaped your eyes during visual analysis. I.e. the Optimiser would "see" exactly as much. That is why the statement about stability is debatable.
I really liked the ability to quickly look at many things on the knee, which in MT5 you refuse to take on at once, because you have to spend a lot of time. Thank you!
The graph demonstrates well that it is foolish to engage in "all-time" TC.
Well, it is necessary to apply walk-forward and even cluster walk-forward analysis to such a simple robot.
And also apply a multitester for a hundred symbols.
Then Tester becomes a head above Python in terms of quality/quantity of results and speed of getting them. But Python is cool!
1. 10 years of analysis without logarithmisation - you can run into skewness. A point 10 years ago and now are two big differences.
2. Why are there places where the moustache hits the body?
3. Is zero in the negative zone or am I interpreting it wrong?
4. -0.0002 is below no value. Why is the condition triggered then?
5. For speeding up in countorders it is better to do a reverse loop and refuse to check for symbol and majic. It will be noticeably faster on such an "idle" robot.
Even faster - flag true after OrderSend and false - OrderClose.
6. It is solved by the "by opening prices" mode.
7. I would apply BestInterval at once. And at once - without time limits in the code of the very first version of the robot.
8. I disagree. There are only three parameters in the TS: the MA period, upper and lower limits of deviations. It is a sin not to run it on M15-open Optimisation and get the whole picture within a few minutes. Even the things that escaped your eyes during visual analysis. I.e. the Optimiser would "see" exactly as much. That is why the statement about stability is debatable.
I liked very much the possibility to quickly look at many things on the knee, which in MT5 you refuse to take up at once, because you have to spend a lot of time. Thank you!
1. You can do with logarithm and other options (not necessarily increments and MA), it was a trial, whether it makes sense to use such statistical analysis at all.
2,3 didn't understand where the whiskers get into the body?
4. Here I made a small oversight in grouping the data. The charts actually look a little different, but generally the shape is retained. They show more outliers than are shown here. I'll either redo the screenshots or just drop the updated python code.
8. What I mean is that when I saw a box with a moustache on the graph, I immediately checked it in the tester and it worked immediately, without selecting parameters at all. I.e. I interpreted the pattern correctly. If you search for muwings within (10-40) and even TF (5-30 min), the pattern will not change much. I.e. it is a pure regularity, found not through fitting.
If there were boxes with whiskers or similar - I would do it in MQL5. But in Python it is really done in 3 lines, the Pandas package was originally written to work with financial BP and is almost a standard
2,3 I don't get it, where does the moustache get into the body?
1, 3, 4.
8. I mean that when I saw a box with a moustache on the graph, I immediately checked it in the tester and it worked at once, without selecting parameters at all. I.e. I interpreted the pattern correctly. If you search for muwings within (10-40) and even TF (5-30 min), the pattern will not change much. I.e. it is a pure regularity, found not through fitting.
Just because a person sees some data on the charts does not mean that there is a pure regularity.
Great article. Max digs where it is necessary and gives hope to those who suffer.
It would be nice to do the exact same analysis on the same data for tick volumes and compare the results.
Just because some data a person sees on charts doesn't mean there's a pure pattern there.
If there's no data above the interquartile range, the moustache sticks to the body.
Great article. Max digs where it needs to be and gives those suffering hope.
It would be nice to do the exact same analysis on the same data for tick volumes and compare the results.
If it helps, I can do it )
Actually, I'm planning a cooler study on this topic, I just need to go to the right end of it
for example, how to look for drifting cycles
- Free trading apps
- Over 8,000 signals for copying
- Economic news for exploring financial markets
You agree to website policy and terms of use
New article Exploring Seasonal Patterns of Financial Time Series with Boxplot has been published:
In this article we will view seasonal characteristics of financial time series using Boxplot diagrams. Each separate boxplot (or box-and-whiskey diagram) provides a good visualization of how values are distributed along the dataset. Boxplots should not be confused with the candlestick charts, although they can be visually similar.
Prices have a shift in the average value over time and form trends, therefore the statistical analysis is not applicable to such raw series. Percentage price changes (price increments) are usually used in econometrics to ensure they all lie in the same value range. The percentage changes can be received using the pd.DataFrame(rates['close'].pct_change(1)) method.
We need average monthly price ranges. Let us arrange the table so as to receive the average values of monthly increments by years and display them on the boxplot diagram.
Fig. 1. Average price increment ranges by month, over 10 years.
Author: Maxim Dmitrievsky