Indicator that shows actual current buys and sells
- bulls and bears power
- [ARCHIVE] Any rookie question, so as not to clutter up the forum. Professionals, don't pass by. Nowhere without you - 3.
- How to know if Volumes Indicator is currently for Bear or Bull using mq4
Atm im using bulls and bears powers together.
Please write correct English on this forum.
Forum on trading, automated trading systems and testing trading strategies
Please don't write ur - it's "you are" or "your"
Keith Watford, 2014.03.04 23:15
I am noticing more instances of poster's using "texting" style language creeping into the forum.
Can I respectfully ask that posters use the English language?
Not everyone's native language is English and your posts may just seem like nonsense to them.
What is "Atm im" ?
Please write correct English on this forum.
What is "Atm im" ?
Sorry.
Atm is the short version of at the moment.
Edit:
I found one for my self:

- www.mql5.com
At the moment i am using bulls and bears powers indicator together.
By definition Bulls power - Bears power equals High-Low of the current candle (or the i.th candle if shift is used). So you'd get kind of volatility measure.
Bulls = High-EMA
Bears = Low-EMA
 =>
Bulls-Bears = High-Low
By definition Bulls power - Bears power equals High-Low of the current candle (or the i.th candle if shift is used). So you'd get kind of volatility measure.
Yeah first i tought it shows the number of bulls or bears currently are in a deal, unlucky it is not.
I checked SYMBOL_SESSION_BUY_ORDERS and SYMBOL_SESSION_BUY_ORDERS_VOLUME and those values are not supportet for me so i cant use anything else wich does what i searched for.
The indicator i linked is atleast close to SYMBOL_SESSION_BUY_ORDERS_VOLUME close[i]-open[i])/high[i]-low[i]
,but nothing else may close to SYMBOL_SESSION_BUY_ORDERS.
The second one would be extreme helpful on multiple strategies, intraday - swing ..
As example if some fundamentals happen you can see in real time where the tendenz for the trend is.
Right, some time ago I thought that Bulls and Bears Power could be combined like that, until recently when I looked up the definition. But this Balance of Power indicator looks interesting, I'm going to check how it works later.
A simple subtraction of Bulls and Bears yields a volatility indicator as shown above. An addition yields a MACD(1,13,X) (median price mode, X irrespective) or Awesome Oscillator of the same kind.
Right, some time ago I thought that Bulls and Bears Power could be combined like that, until recently when I looked up the definition. But this Balance of Power indicator looks interesting, I'm going to check how it works later.
A simple subtraction of Bulls and Bears yields a volatility indicator as shown above. An addition yields a MACD(1,13,X) (median price mode, X irrespective) or Awesome Oscillator of the same kind
Edit:
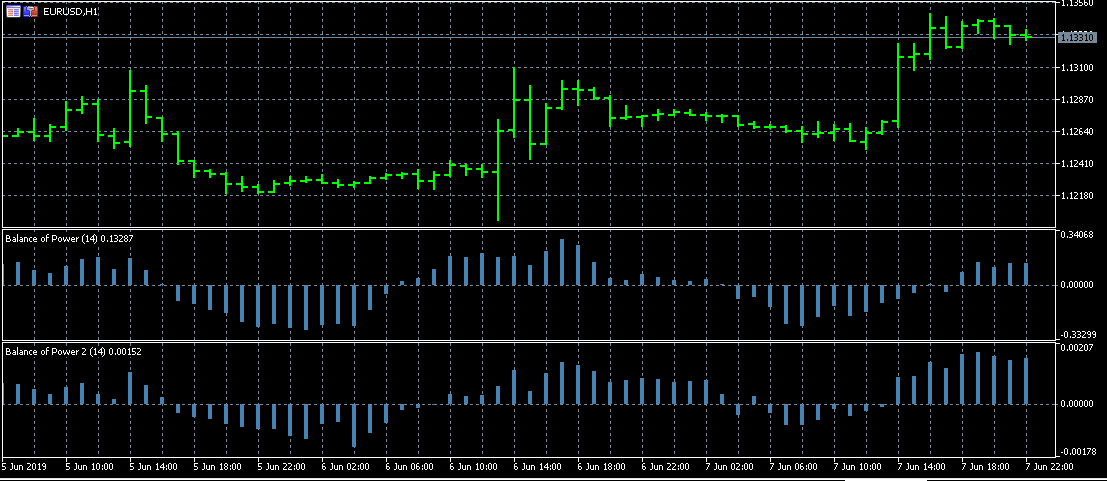
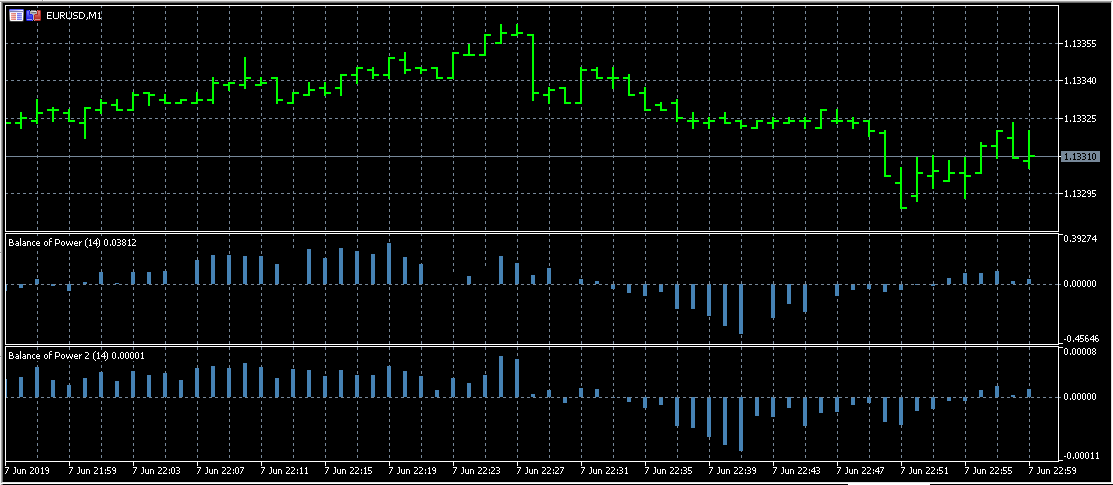
The first picture 1h second 1m, the balance of power2 is my edited version (difference only) the first one the normal. It should be the closest to "SYMBOL_SESSION_BUY_ORDERS_VOLUME", but i guess the normal would be better tough ;D.
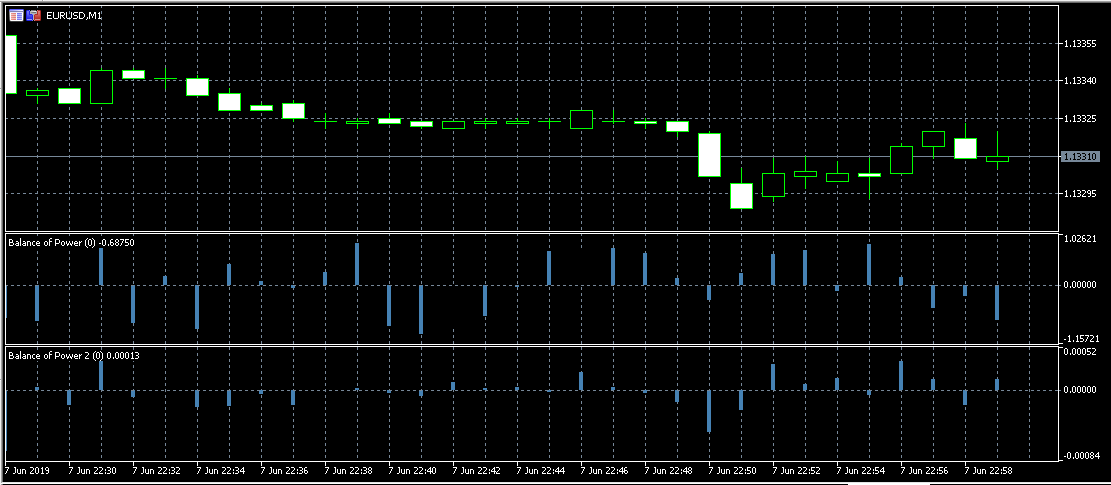
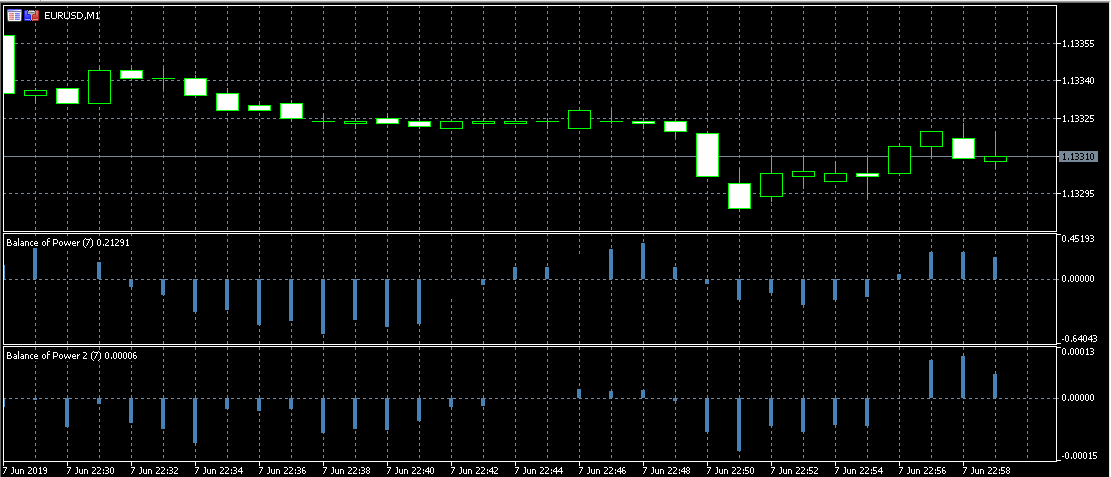
Edit: bigger changes in formula and i reduced the periode to 0 on both picture 3. Pictuere 4 period of 7.
Its pretty close i guess, nice.
- Free trading apps
- Over 8,000 signals for copying
- Economic news for exploring financial markets
You agree to website policy and terms of use