Will there be a mini-manual on how to use the current version of the library without studying all the previous articles?
Yes, but only after the main part of the library and all the necessary functionality will be formed.
Thank you, but I would like to repeat the question
Will there be a mini-manual how to use the current version of the library without studying all the previous articles?
Thanks, but I would like to repeat the question
Will there be a mini-manual on how to use the current version of the library without studying all the previous articles?
Maybe someday there will be.
You don't need to study all the articles to learn how to use the library.
Start with the examples that are presented in these articles:
- Trading Expert Advisor with GUI: Creating a Panel (Part I)
- Trade Expert Advisor with GUI: Filling it with functionality (Part II)
The example posted in the article does not compile. When compiling, it generates an error: "'ON_END_CREATE_GUI' - undeclared identifier Programme.mqh 307 29" !
The latest version is always here: EasyAndFast
And update the classes that are attached to the article.
Partially.
Anatoly, thank you once again for your work.
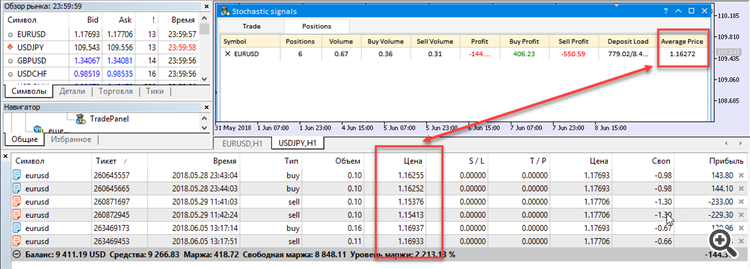
I have a question. On the average price of an aggregate position.
I have TradePanel Expert Advisor hanging on the chart.
There are 6 multidirectional positions. The panel, as you can see, shows that the opening price of the aggregate position is equal to 1.16272. Is it correct to calculate the average price for multidirectional positions in this way?
...
There are 6 multidirectional positions. The panel shows that the opening price of the cumulative position is 1.16272.
Is it correct to calculate the average price for multidirectional positions in this way?
I don't know. What do you think?
It is possible that from the point of view of "sorting out the situation for multidirectional positions", it is better to count separately for buy and sell.
I don't know. What do you think?
It is possible that from the point of view of "sorting out the situation on multidirectional positions", it is better to count separately for buy and for sell.
The right way is to calculate the average price for each direction separately. Then subtract the smaller one from the larger position - this will be the volume and direction of the total position. And also the average price of the position, which is equal to the average price of the larger position.
The correct way is to calculate the average price for each direction separately. Then subtract the smaller one from the larger position - this will be the volume and direction of the total position. And also the average price of the position, which is equal to the average price of the larger position.
Rashid, thank you for your comment. Then in my case the calculation is on the larger side (Buy):
| Open price | Base Volume | Quote Volume |
| 1,16255 | 10 000,00 | 11 625,50 |
| 1,16252 | 10 000,00 | 11 625,20 |
| 1,16937 | 16 000,00 | 18 709,92 |
| 36 000,00 | 41 960,62 | |
| Average: | 1,16557 |
There's also the cost approach, where everything is combined into one pile.
| Open price | Base Volume | Quote Volume |
| 1,16255 | 10 000,00 | 11 625,50 |
| 1,16252 | 10 000,00 | 11 625,20 |
| 1,15376 | -10 000,00 | -11 537,60 |
| 1,15413 | -10 000,00 | -11 541,30 |
| 1,16937 | 16 000,00 | 18 709,92 |
| 1,16933 | -11 000,00 | -12 862,63 |
| 5 000,00 | 6 019,09 |
Average: 1.20382
The second case takes into account the fact that they sold cheap, so the price of the remaining purchases became higher.
- Free trading apps
- Over 8,000 signals for copying
- Economic news for exploring financial markets
You agree to website policy and terms of use

New article Expert Advisor featuring GUI: Adding functionality (part II) has been published:
This is the second part of the article showing the development of a multi-symbol signal Expert Advisor for manual trading. We have already created the graphical interface. It is now time to connect it with the program's functionality.
The gif image below displays the following. The table features the list of forex symbols containing USD. Then, we quickly form the list of symbols containing EUR. To do this, enter "EUR" in the Symbols filter input field and click Request. If you want to see all symbols with USD and EUR available on the server, they should be comma-separated: "USD,EUR".
Fig. 3. Forming the list of Forex symbols
Forming the list of forex symbols and getting the indicator handles is performed on the period specified in the Timeframes combo box. If we select another timeframe in the drop-down list, we should receive the new handles and update the table values. To achieve this, we need the CProgram::ChangePeriod() method. If the combo box ID has arrived, first update the timeframe in the object chart. Then, get the handles and indicator data for all table symbols. After that, the table is updated to display the implemented changes.
Author: Anatoli Kazharski