Discussion of article "The power of ZigZag (part I). Developing the base class of the indicator"
The author's previous works on visualisation are known and interesting.
The idea to take into account the spread when building indicators is absolutely correct, as it is an important price parameter, which for some reason is not taken into account in classical indicators.
As for the ZigZag indicator, even in your version, it is clearly seen on the pictures (visualisation) that the trend (if I understood correctly - the green line) sometimes has a critical lag.
The reason is that if we use the trend as a trading criterion (otherwise why use the ZigZag indicator), we should take into account not only the spread, but also the dynamics factors, and first of all - the amplitude of backward emissions (to take into account when building a trend). However, this is a mistake of traditional analysis in determining trends in general.
It is interesting to see the results of your Expert Advisor's test (we will probably see them in the sequels to the article).
The article is useful, and the visualisation is clear as always. Thanks to the author for his work.
ZigZag allows you to find abstractions of any level of complexity.
The next article will show examples of how this can be used.
low_ask_buffer[i] =low[i]+(spread[i]*_Point);Run it on real ticks for comparison.
fxsaber:
Боюсь, это неверно
low_ask_buffer[i] =low[i]+(spread[i]*_Point); Run it on real ticks for comparison.
I agree. It is not a fact that the minimum spread was exactly when the bid price reached its minimum level.
And historical data (in bars) contains exactly the minimum spread.
So we need to get real ticks - CopyTicks(), and determine the minimum difference (ask-bid) on the minimum bid minimum ask (Low Ask).
Is this what you wanted to say?
Agreed. It is not a fact that the minimum spread was exactly when the bid price reached its minimum level.
And historical data (in bars) contains exactly the minimum spread.
So we need to get real ticks - CopyTicks(), and determine the minimum difference (ask-bid) on the minimum bid minimum ask (Low Ask).
Is this what you wanted to say?
Probably CopyTicks is a bit expensive for such a thing. It is easier to just chase real ticks and build a ZigZag by ticks. Frankly speaking, I don't understand why you decided to get caught up in the indicator execution of ZZ.... You don't need visualisation when writing a TS anyway.
I once posted exactly the same ZZ directly in an Expert Advisor. It works quickly, and probably nothing else is needed.
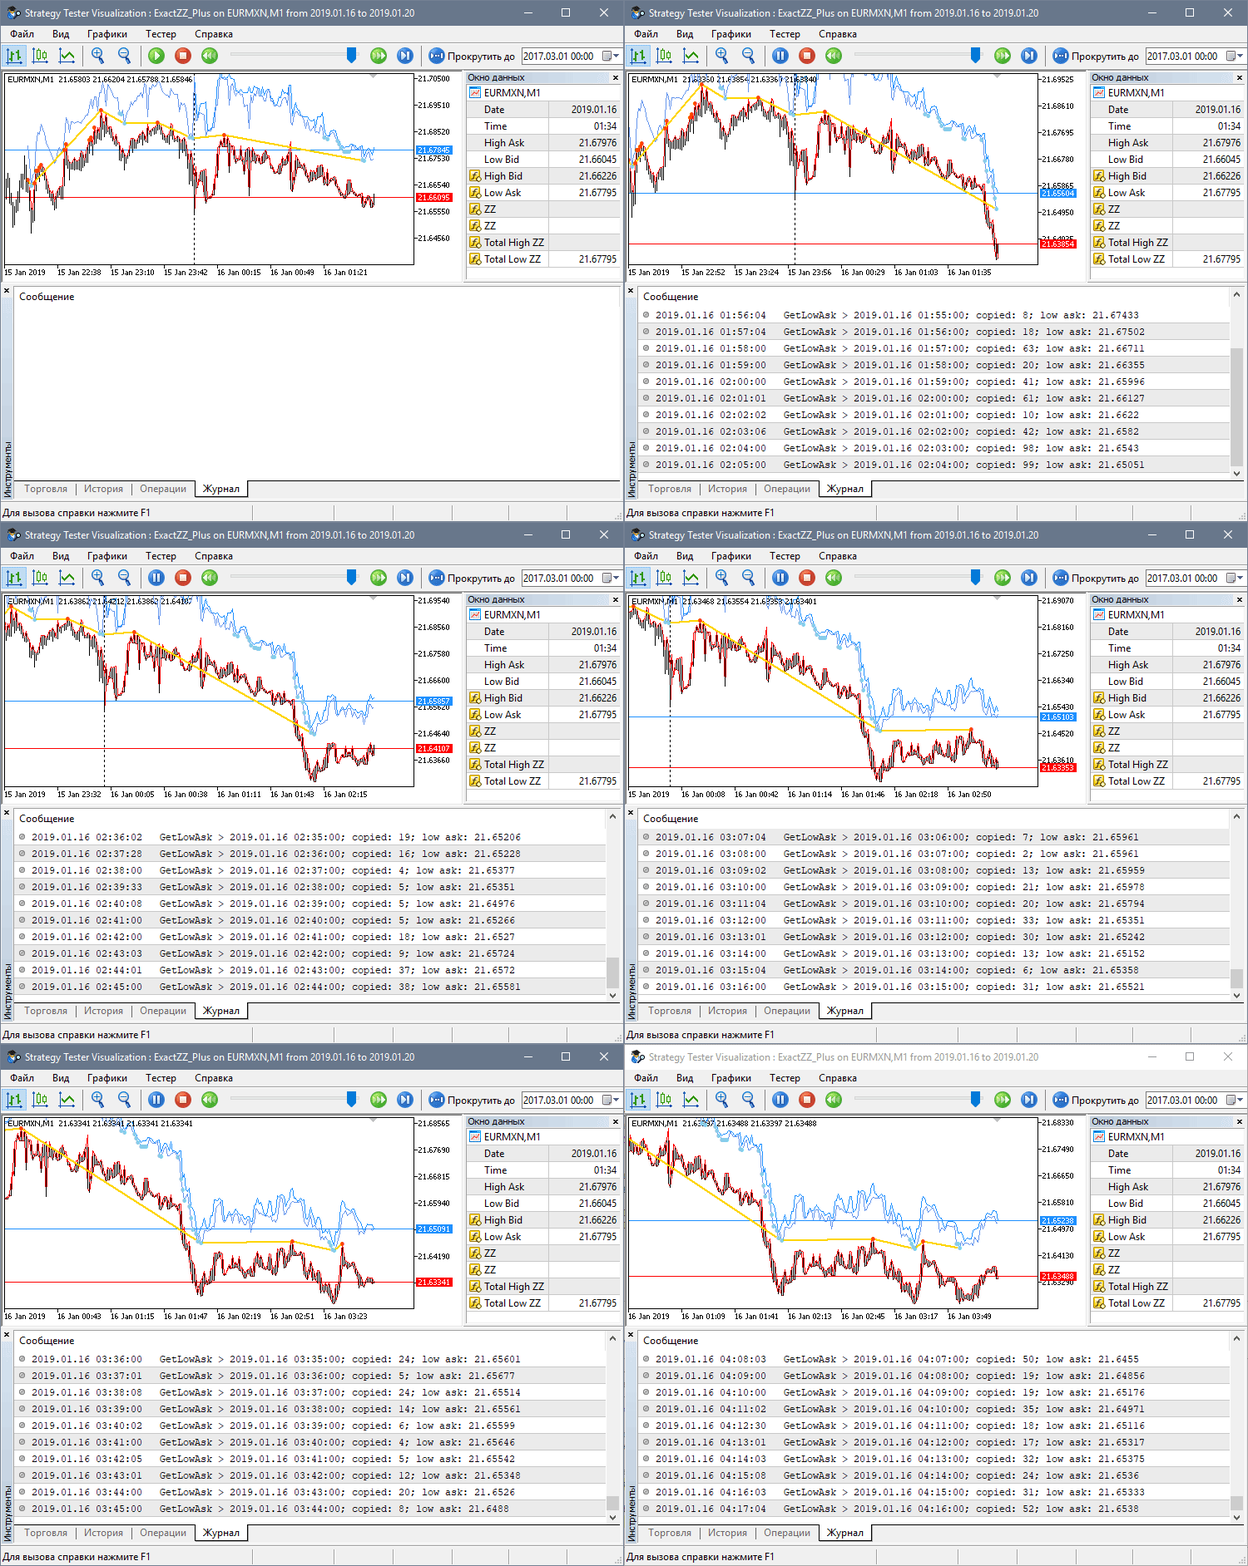
If you want to have a real Low Ask, add this code to the indicator.
External parameter to enable the mode:
input bool RealTicksMode =false; // Real ticks mode
Method to get minimum ask from real tick data:
//+------------------------------------------------------------------+
//| Returns the minimum ask price from tick data |
//+------------------------------------------------------------------+
double GetLowAsk(const int i,const datetime &time[])
  {
//--- Exit if real ticks mode is disabled
   if(!RealTicksMode)
      return(0.0);
//--- Exclude the last (current) bar
   if(i>=g_rates_total)
      return(0.0);
//---
   MqlTick  ticks[];
   double   low_ask  =0.0;
   datetime end_time =time[i]+PeriodSeconds();
//--- Get ticks in the specified range
   int copied_total=CopyTicksRange(_Symbol,ticks,COPY_TICKS_ALL,(ulong)time[i]*1000,(ulong)end_time*1000);
   if(copied_total>0)
     {
      low_ask=ticks[0].ask;
      for(int k=1; k<copied_total; k++)
        {
         if(ticks[k].ask<low_ask)
            low_ask=ticks[k].ask;
        }
     }
//---
   return(low_ask);
  }
//---
If the minimum ask is not obtained, the minimum spread is used.
//+------------------------------------------------------------------+
//| Fills the indicator buffers High Bid and Low Ask |
//+------------------------------------------------------------------+
void FillAskBidBuffers(const int i,const datetime &time[],const double &high[],const double &low[],const int &spread[])
  {
//--- Exit if you have not reached the start date
   if(time[i]<first_date)
      return;
//--- Get the minimum ask from the tick data
   double low_ask=GetLowAsk(i,time);
//--- Save the values
   high_bid_buffer[i] =high[i];
   low_ask_buffer[i]  =(low_ask>0)? low_ask : low[i]+(spread[i]*_Point);
  }
Result:

Honestly, I don't understand why you decided to latch on to the indicator design of the ZZ.....
For study and research.
- Free trading apps
- Over 8,000 signals for copying
- Economic news for exploring financial markets
You agree to website policy and terms of use
New article The power of ZigZag (part I). Developing the base class of the indicator has been published:
Many researchers do not pay enough attention to determining the price behavior. At the same time, complex methods are used, which very often are simply “black boxes”, such as machine learning or neural networks. The most important question arising in that case is what data to submit for training a particular model.
Generally, ZigZag type indicators are built based on bars' highs and lows with no spread consideration. This article presents a modified version, in which a spread is considered when constructing segments for lower ZigZag extreme points. It is assumed that deals are to be performed inside the price channel in the trading system. This is important since it often happens that the buy price (ask) is significantly higher than the sell one (bid). For example, this may happen at night time. So it would be wrong to build an indicator only based on bid prices. After all, it makes no sense to build the lower extreme points of the indicator based on bar lows if there is no possibility to buy at these prices. Of course, the spread can be taken into account in trading conditions, but it is better when everything is immediately visible on the chart. This simplifies the development of the trading strategy, since everything is more plausible initially.
In addition, you may also want to see all the points the ZigZag extreme values were updated at. In this case, the picture becomes even more complete. Now let's consider the indicator code. We will dwell only on the basic features and functions.
Author: Anatoli Kazharski