Discussion of article "The power of ZigZag (part II). Examples of receiving, processing and displaying data"
More than 10 years ago I was also "fascinated" by zigzags and created a large number of them.
In Attach examples - multi-zigzag for 9 timeframes and Zigzag Builder, etc. a small number of developments based on zigzags.
But the practical sense is important. Much more serious is the task of identifying those ektremums, from which you can "push back" in the analysis.
As an example:
We have selected three extrema using a zigzag. We tied the Andrews Fork to them. And we see that the market has exactly reached the dotted line a few days ago and exactly rebounded from it.
And there are a lot of such pictures. Not any extrema found by zigzag can be used for this.
In the menu picture with numbers 0-10 and 12-14 there are 14 zigzag algorithms. And at number 11 there are 7 more zigzag algorithms for finding patterns. There are 21 algorithms in total.
In the attachment you can create a lot of algorithms with the help of the Constructor. You can use them in your own developments.
And more pictures
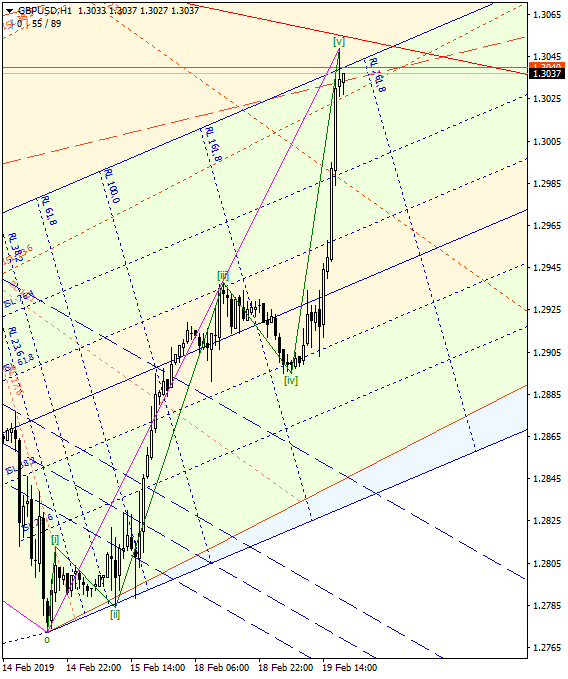
Let's go lower
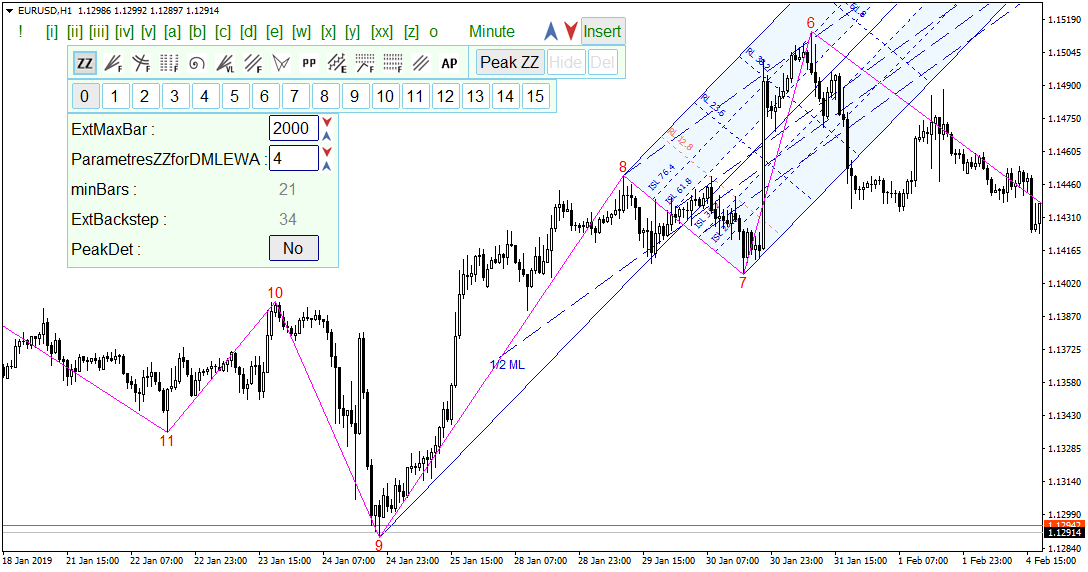
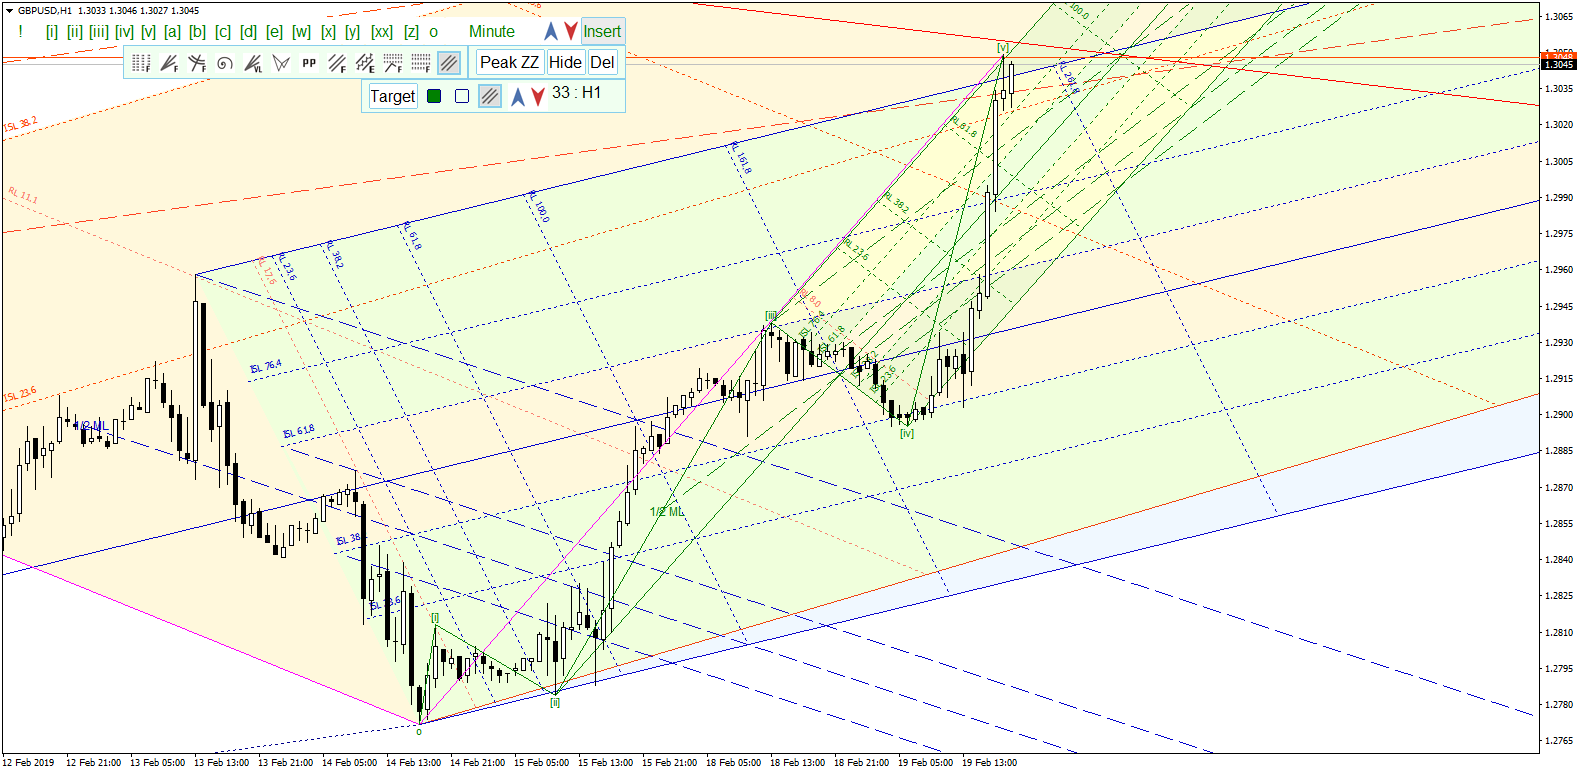
Let's go even lower and see how the extremum at number 1 on the chart above was formed.
This is achieved not by grinding the rays and extrema of the zigzag. And not by calculating some not quite clear statistical patterns of the zigzag.
It is more important to find such an algorithm that would detect significant extrema.
Загрузив индикатор SumSegmentsZZ на график, Вы увидите результат, как на скриншоте ниже. Здесь видно, что когда синяя линия выше красной, то это означает, что сумма сегментов направленных вверх больше суммы сегментов направленных вниз. И обратная логика — когда красная линия выше синей. Говорит ли нам это однозначно о том, куда продолжит двигаться цена, покажут эксперименты в тестере стратегий. На первый взгляд можно сказать, что, чем дольше сумма однонаправленных сегментов больше суммы противоположных сегментов, тем выше вероятность разворота.

Fig. 3 - Demonstration of SumSegmentsZZZ indicator operation.
Общее количество сегментов — 302145. Видно, что максимальное количество сегментов в диапазоне от нуля до 100. Далее от уровня к уровню количество сегментов уменьшается. За указанный временной период максимальный размер сегмента достигал 2400 пятизначных пунктов.

Fig. 14 - Result of counting the number of segments by size.
It is necessary to look for the reason why the segments on the screen 2100 and 2300 are zeroed.
Extremums are important, but they are not a sufficient factor - the price dynamics around these levels is no less (and often more) important.
As for trend detection, ZigZag is a lagging indicator, as it "runs" on fully formed fractals.
And the last candle of a fractal can have a significant inverse amplitude.
As far as trend detection is concerned, ZigZag is a lagging indicator, as it is "held" by fully formed fractals.
There are, shall we say, common misconceptions. One of them is highlighted above in red colour.
Above were presented pictures, where the extrema, found by zigzag sometimes several months ago, allow us to bind graphical tools to them.
And already these graphical tools become leading "indicators", because by them it is possible to determine the targets that the market reaches in the future.
Here is today's example:
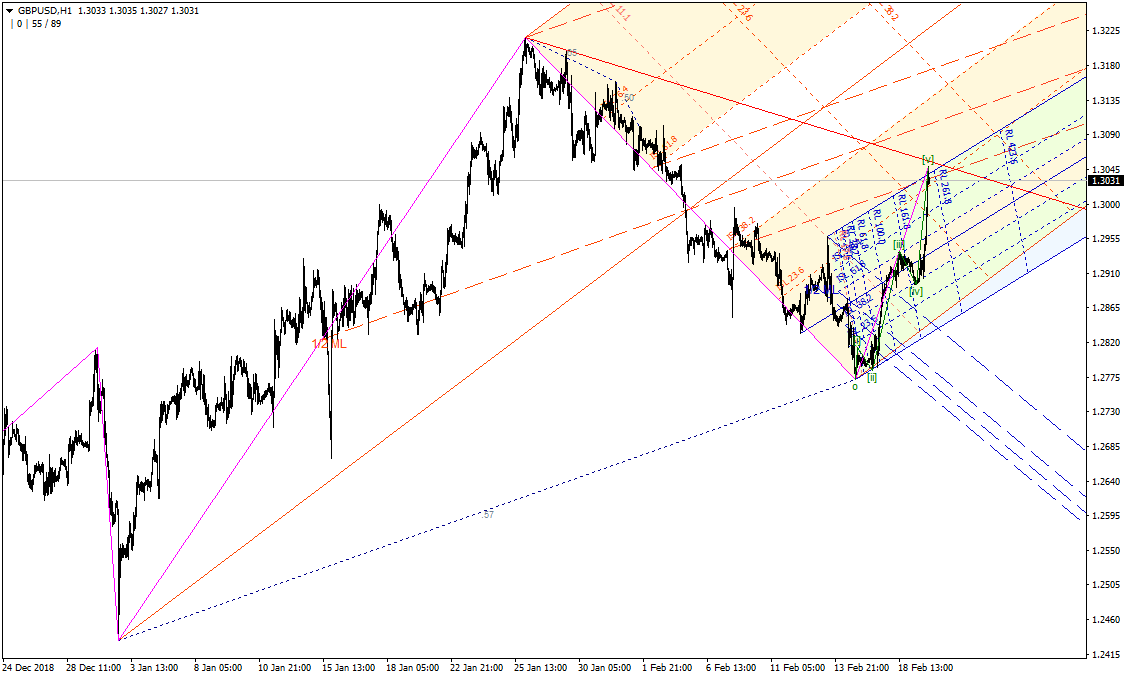
The target in the area of the intersection of the SLM382 line (from the Andrews pitchfork set in red) with the upper signal line of the pitchfork in blue and with the downtrend line in red.
This target was identified long before it was reached. Extremes found with the zigzag were used to anchor all the charting tools.
That is, the lagging indicator zigzag allowed us to determine the goals in the future. Long before the goals are reached.
But practically all indicators - different muving, RSI, stochastics, etc. etc. are lagging indicators. It is impossible to determine the goals with their help.
Counting the number of extrema, sizes of zigzag rays and other statistical calculations of zigzag parameters, probably, allow you to create an Expert Advisor that works in accordance with the obtained statistical values. But this, in my opinion, is shooting blindly.
Below are pictures with the binding of pitchforks to consecutive wave tops. The wave markup is also a zigzag. But let's just say that a perfect zigzag is the zigzag to strive for. Strive to create an algorithm that can mark up a chart according to Elliott waves.


Market extrema formed far in the past provide an opportunity to identify targets in the future. Sometimes in a future that is several years away. Sometimes they are intermediate targets. But still they are a benchmark and give an understanding that that is where the market will arrive.
==============
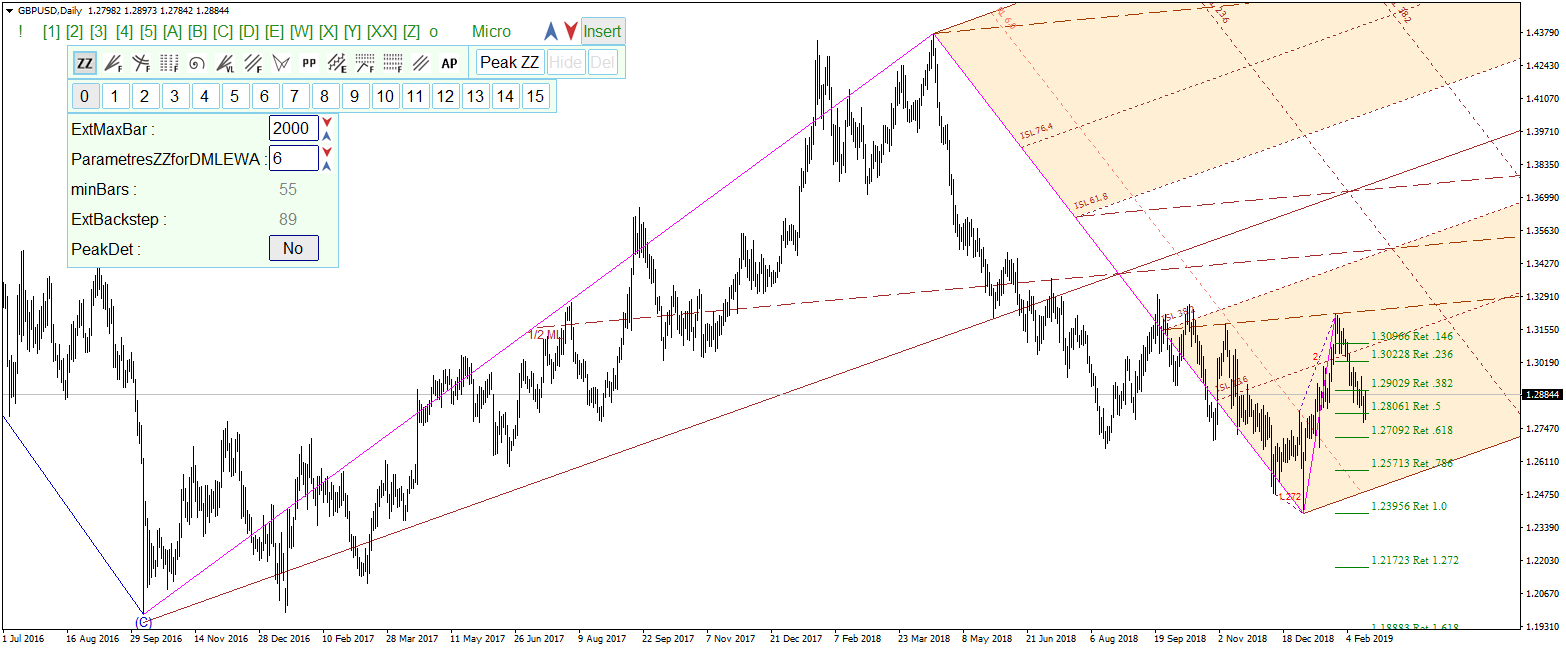
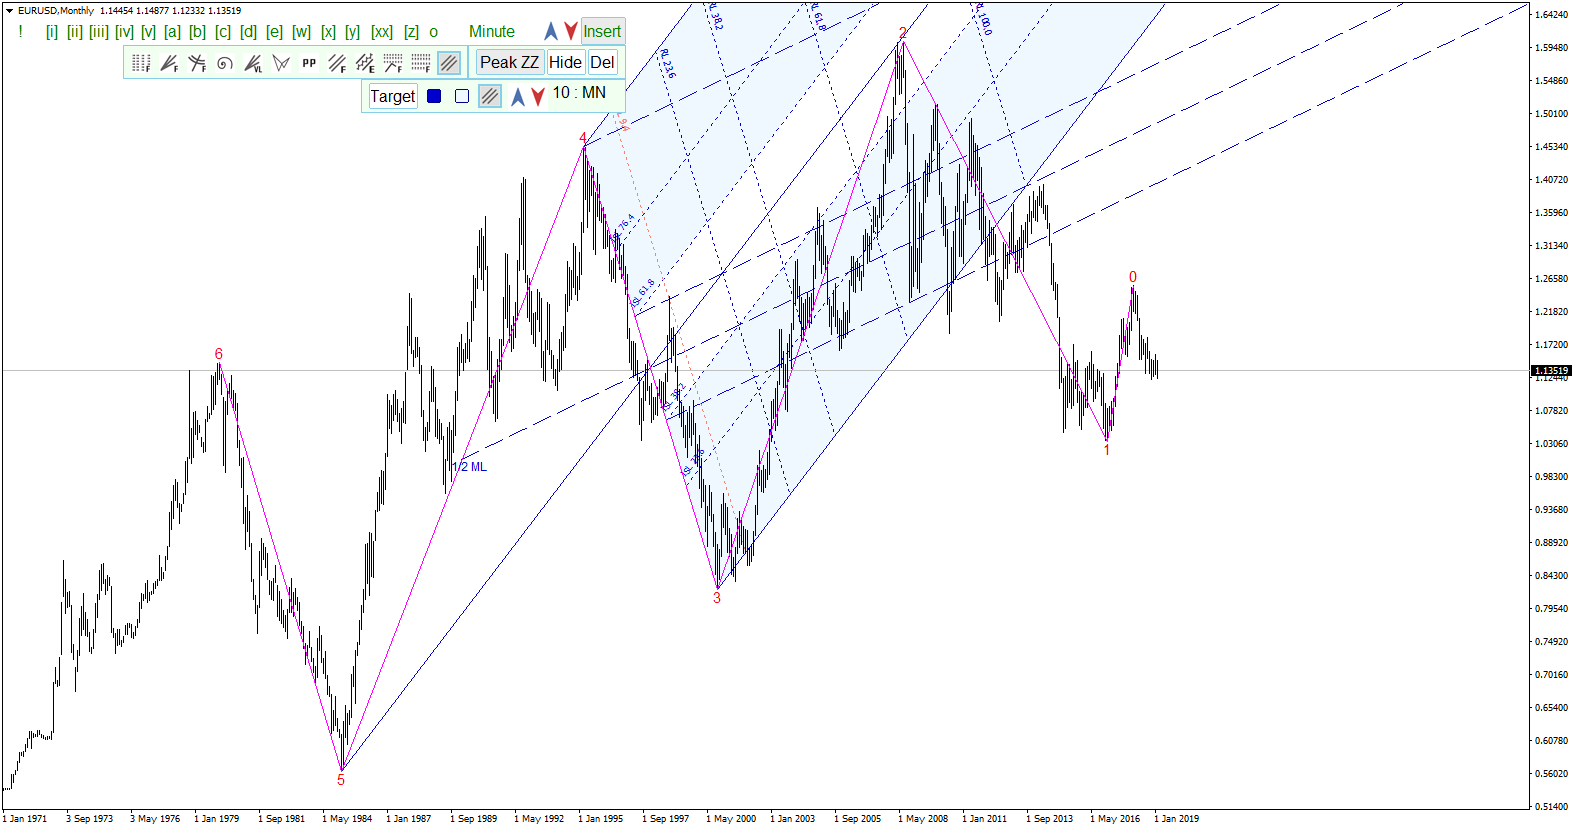
My favourite examples are on the monthly chart. The pitchfork anchor points are a dozen years in the past. And a dozen years into the future the pitchfork predicted targets.
First chart. The target at the intersection of the median with the Schiff end line is point 3:
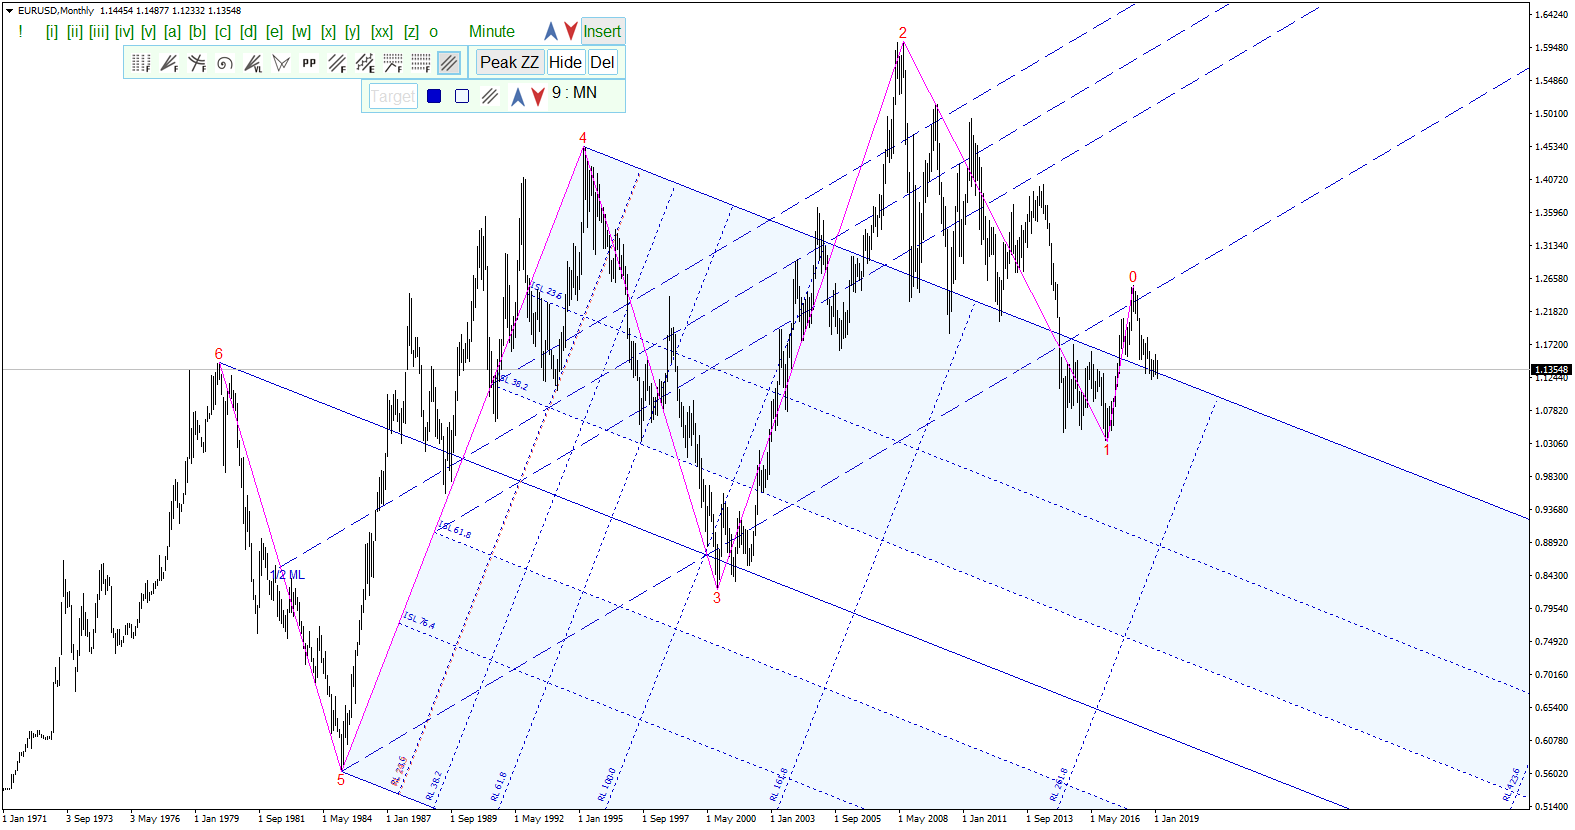
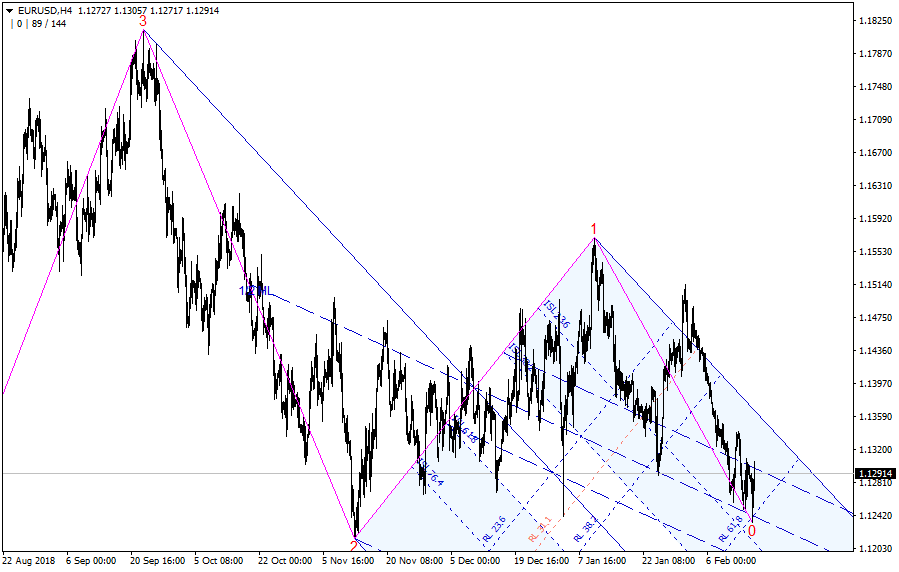
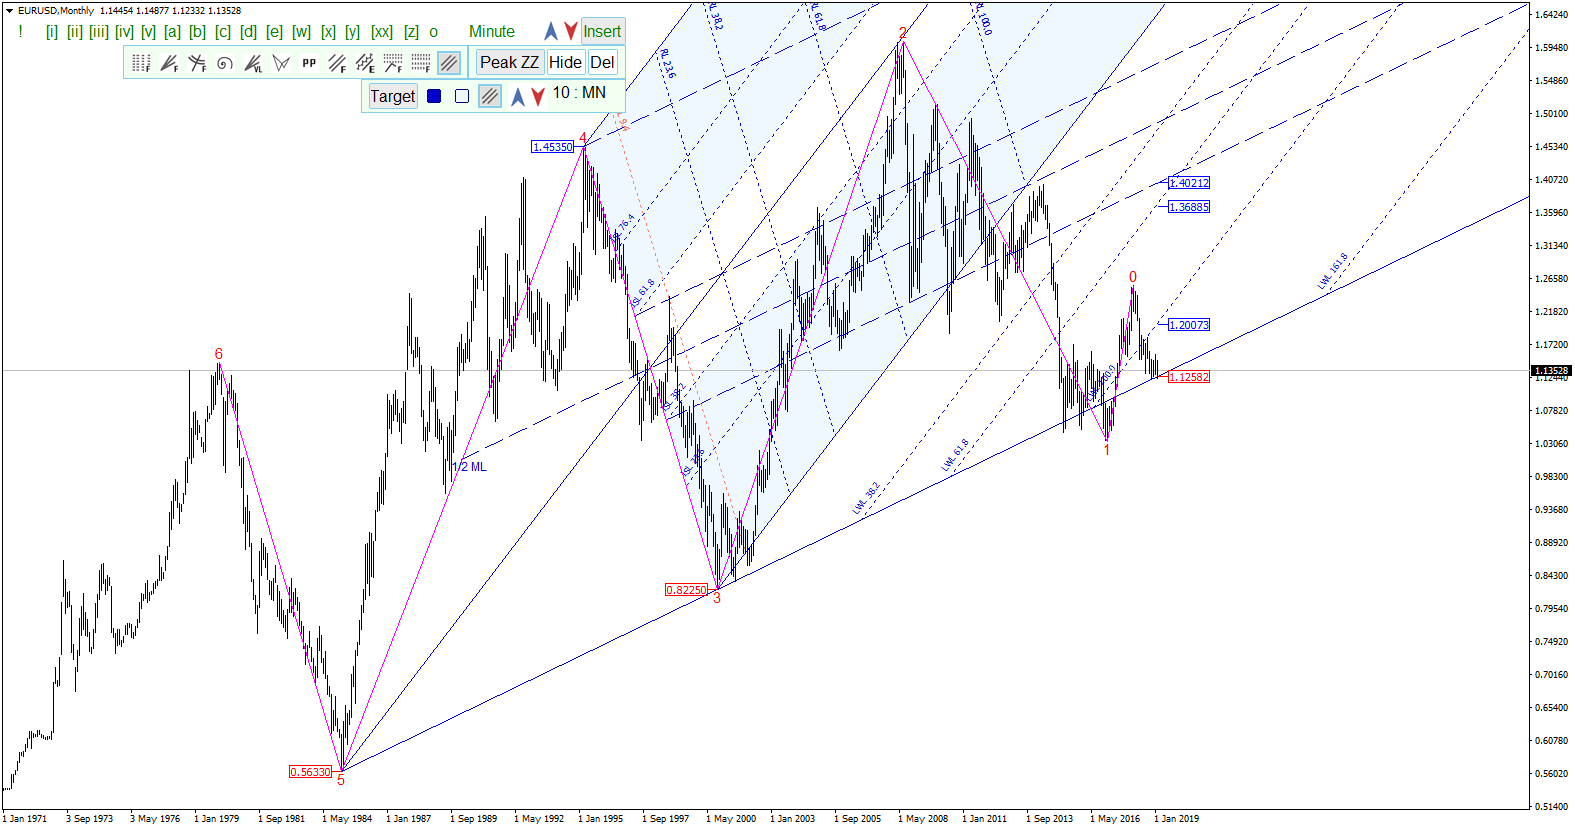
The second graph - the target at the median of the pitchfork - point 2:
And further movement to the initial Schiff line:
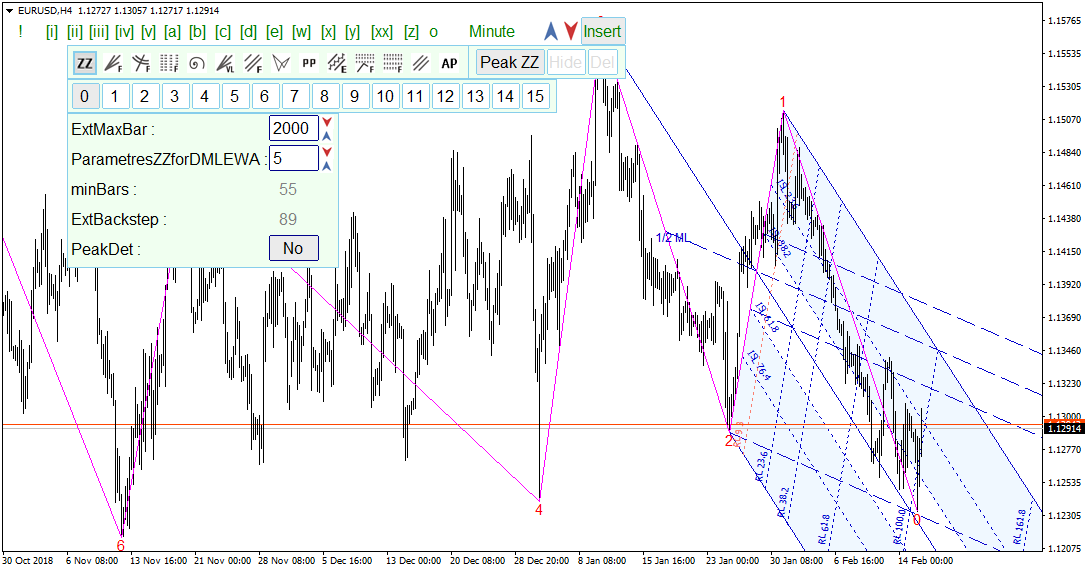
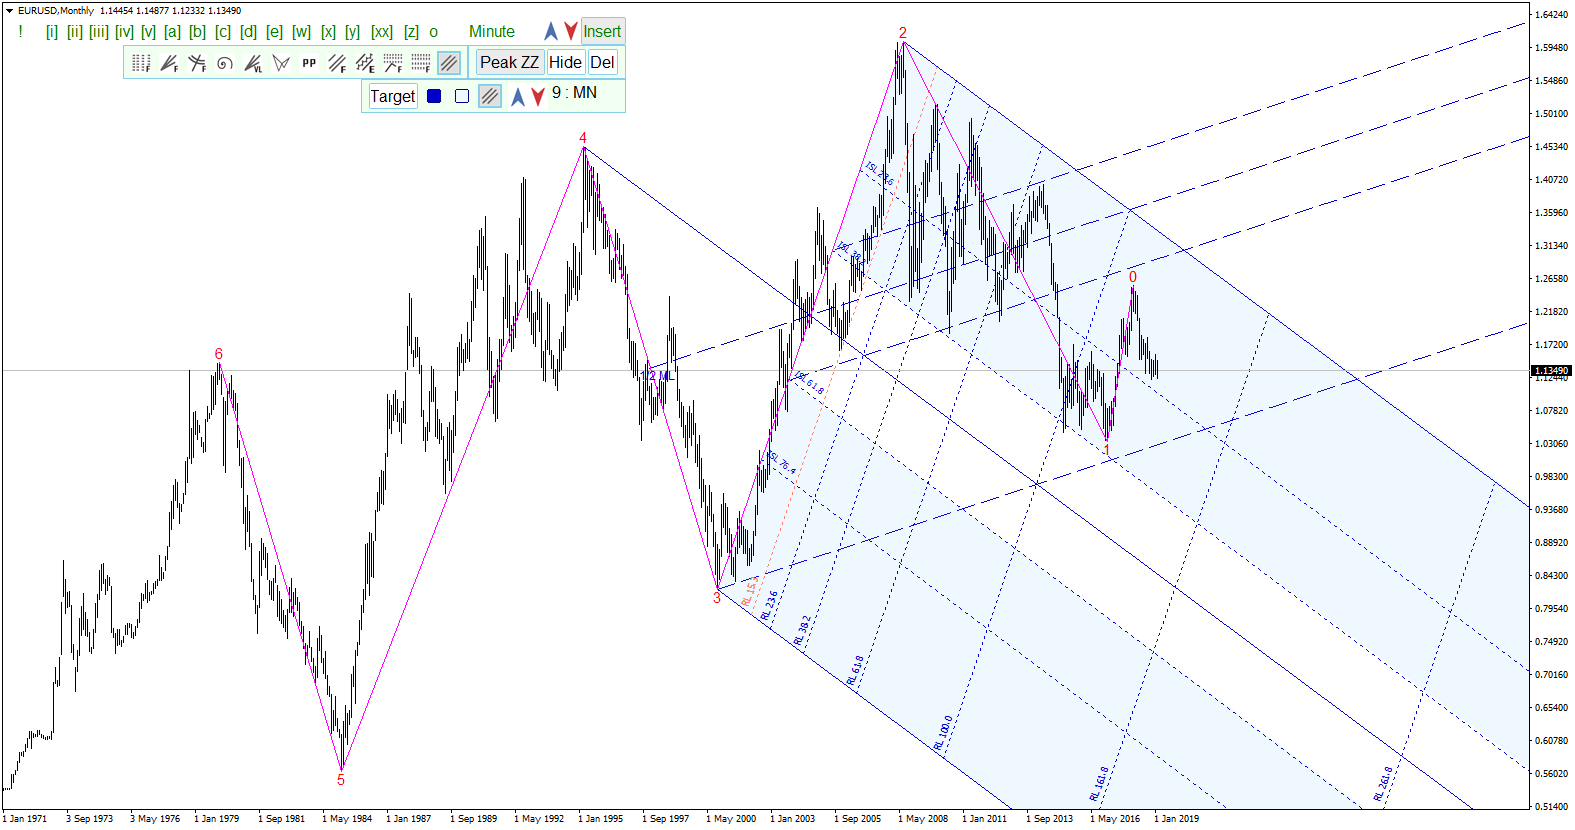
Third chart. Here the target was sliding along the ISL382 line (ISL- internal signal line) to the final Schiff line:
==============
It is necessary to understand how to use the zigzag. And then it can become an indispensable assistant.
There are, shall we say, common misconceptions. One of them is highlighted in red above.
-------
It is necessary to understand how to use the zigzag. And then it can become an indispensable assistant.
If there was a test of a trading robot based on the zigzag with quality results (of course, in real life, on different financial instruments and a long period of testing), then we could say that this indicator has become an indispensable assistant. But there are no such examples.
Besides, each trader uses this indicator in his own way (one uses some fractals, another - other fractals, and on the same chart segment). That is - full subjectivity of analysis, including in your example.
At the same time, this indicator is certainly useful for general perception of the process, but not more than that.
If there was a test of a trading robot based on zigzag with qualitative results (of course, in real life, on different financial instruments and a long period of testing), then we could say that this indicator has become an indispensable assistant. But there are no such examples.
Besides, each trader uses this indicator in his own way (one uses some fractals, another - other fractals, and on the same chart segment). That is, complete subjectivity of analysis, including in your example.
At the same time, this indicator is certainly useful for general perception of the process, but not more than that.
This indicator can serve as a basis for forming, visualising and following not only local, but also composite and even global trends.
Yes, but only as an element, and the main thing is to take into account the structure of risks associated with the price dynamics of financial instruments - more details in the article How to reduce trader's risks

- www.mql5.com
Yes, but only as an element, and the main thing is to take into account the structure of risks associated with the price dynamics of financial instruments - more details in the article How to reduce trader's risk
- Free trading apps
- Over 8,000 signals for copying
- Economic news for exploring financial markets
You agree to website policy and terms of use
New article The power of ZigZag (part II). Examples of receiving, processing and displaying data has been published:
In the first part of the article, I have described a modified ZigZag indicator and a class for receiving data of that type of indicators. Here, I will show how to develop indicators based on these tools and write an EA for tests that features making deals according to signals formed by ZigZag indicator. As an addition, the article will introduce a new version of the EasyAndFast library for developing graphical user interfaces.
Below you can see how this looks in the GUI. In this case, the results show that the lesser the value, the lesser the number of trends in the considered area. It would be wise to set as wide range of dates as possible in order to obtain information using as much data as possible.
Fig. 12. Color scale for visualizing table data
The wider the range of dates, the more data are used and, accordingly, the more time it will take to generate data and calculate the parameters. If there is not enough data, an attempt is made to download them from the server.
Author: Anatoli Kazharski