Display immediatly from OnCalculate (?)
You can turn on and off instantaneously by switching colors.
I uploaded a sample to refer it.
Attention:
Do not open a new thread each time you ask questions. You should continue to use the same thread.
Attention:
Do not open a new thread each time you ask questions. You should continue to use the same thread.
ah, ok.
I tought i have because the subject was not the same. Thank you.
You can turn on and off instantaneously by switching colors.
I uploaded a sample to refer it.
Yes, smart idea...I didn't tought about it.
I prefere true "hide/show", but if i think i will do it like your suggestion.
Thank you.
You can turn on and off instantaneously by switching colors.
I uploaded a sample to refer it.
Attention:
Do not open a new thread each time you ask questions. You should continue to use the same thread.
The probleme with your smart/fast suggestion is that technically, the moving averages are still on the graph and are detectabled on "Mouse Over".
Even if we cannot see them.
Can we to the indicateur undetectable on the graph by "Mouse Over" ?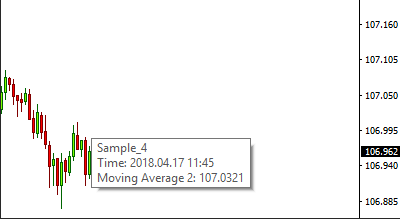
If you have another idea to realy hide/show on click...
-------
PS : And another question please, is there a way to hide the color buffers options in the indicator pop up window ?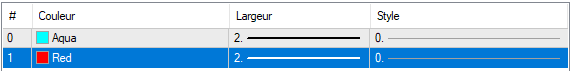
If you display moving averages as objects instead of using buffers, you should be able to achieve these purpose.
If you display moving averages as objects instead of using buffers, you should be able to achieve these purpose.
ah ok...Thank you Veeery much :)
If you display moving averages as objects instead of using buffers, you should be able to achieve these purpose.
Have you, an good example to do it please....?
I have ever seen a program created by other before, but I have never programmed it myself.
I think that it is not difficult because it only draws lines.
It's always a buffer question ... :/
https://www.mql5.com/en/docs/customind/indicators_examples/draw_line
Maybe i will do it your way to not uselessly waste time.
Thank you again.

- www.mql5.com
#property strict
#property indicator_chart_window
#property indicator_buffers 1
#property indicator_plots   1
//--- plot _
#property indicator_label1  "_"
#property indicator_type1   DRAW_LINE
#property indicator_color1  clrRed
#property indicator_style1  STYLE_SOLID
#property indicator_width1  1
//--- indicator buffers
double         _Buffer[];

#include <ChartObjects\ChartObjectsTxtControls.mqh>
#include <Indicators\Trend.mqh>

class MyMA : public CiMA
{
   int m_size;
public:
   MyMA():m_size(0){}
   int size()
   {
      if(m_size == 0)
         for(;Main(m_size)>0.0; m_size++);
      return m_size;
   }
};

input int InpMaPeriod = 50;

CChartObjectButton button;
MyMA ma;
//+------------------------------------------------------------------+
//| Custom indicator initialization function                         |
//+------------------------------------------------------------------+
int OnInit()
  {
//--- indicator buffers mapping
   SetIndexBuffer(0,_Buffer);
   SetIndexEmptyValue(0,EMPTY_VALUE);
   ArrayInitialize(_Buffer, EMPTY_VALUE);
   ArraySetAsSeries(_Buffer,true);

   if(!button.Create(0,"button",0,120,50,120,50)
      || !button.Description("ToggleMA")
      || !button.Corner(CORNER_RIGHT_LOWER)
   )
      return INIT_FAILED;

   if(!ma.Create(_Symbol,(ENUM_TIMEFRAMES)_Period,InpMaPeriod,0,MODE_SMA,PRICE_CLOSE))
      return INIT_FAILED;


//---
   return(INIT_SUCCEEDED);
  }
//+------------------------------------------------------------------+
//| Custom indicator iteration function                              |
//+------------------------------------------------------------------+
int start()
{
   if(button.State() && ma.size() > 0)
      _Buffer[0] = ma.Main(0);
   return 0;
}
//+------------------------------------------------------------------+
//| ChartEvent function                                              |
//+------------------------------------------------------------------+
void OnChartEvent(const int id,
                  const long &lparam,
                  const double &dparam,
                  const string &sparam)
{
   if(id==CHARTEVENT_OBJECT_CLICK && sparam==button.Name())
   {
      if(button.State())
         for(int i = fmin(ma.size()-1,3000);i>=0;i--)
            _Buffer[i] = ma.Main(i);
      else
         ArrayInitialize(_Buffer,EMPTY_VALUE);
   }
}
Use SetIndexEmptyValue to something like EMPTY_VALUE. Then if you don't want to plot the buffer just set all the elements to EMPTY_VALUE. Example indicator.
Thank you, higher than my actual knowledge with class and include.
But i kep it.
Regards.
- Free trading apps
- Over 8,000 signals for copying
- Economic news for exploring financial markets
You agree to website policy and terms of use
Here is my goal :
Immediatly hide/show Moving Averages after click on button.
But, now, it always waits a tick, as the function is placed in "OnCalculate".
How can I do it please ?
Here is my code :
Any idea / solution ?
Regards.