Something Interesting in Financial Video April 2014
Have you considered automated trading?
Forum on trading, automated trading systems and testing trading strategies
newdigital, 2014.04.01 18:48
George W Bush Says Average Investors Need an Automated Trading System
He mentions that traders and investors need a level playing field to be successful and the only way to do this is with the use of an automated trading system.
Technical Analysis Indicator MACD part one
Most technical analysis indicators are lagging. Let show you how to use MACD properly and its Leading indicator values.
Forum on trading, automated trading systems and testing trading strategies
newdigital, 2014.01.28 07:59
What is the MACD Indicator? How do I use it? (based on dailyforex article)
One of the most common technical indicators that is used by day traders in the financial markets can be seen in the Moving Average Convergence Divergence -- more commonly referred to as the MACD. But one mistake that many new traders make is that they will simply start using this indicator without really understanding how it functions or makes its calculations. This can lead to costly mistakes that should have been completely avoidable. So, it makes sense to study the logic and calculations behind the MACD (and all other indicators) in order to more accurately configure your day trading positions and generate gains on a consistent basis.
The Moving Average Convergence Divergence (MACD) Defined
Anyone with any experience in the forex markets and in technical analysis strategies has likely heard a great deal about the Moving Average Convergence Divergence (MACD). But what exactly does the MACD tell us -- and how is it calculated? Without an understanding of these areas, it can be difficult to see trading signals as they emerge. Here, will deconstruct the MACD indicator and explain how and why it is commonly used.
“In its most basic form,” said Haris Constantinou, markets analyst, “the MACD is a momentum indicator that is designed to follow existing trends and find new ones.” The MACD does this by showing the differences and relationships between a two-level combination of moving averages and price activity itself.
MACD Calculations
To determine and calculate the MACD, we must subtract a 26 period Exponential Moving Average (EMA) from a 12 period EMA. Then, a 9 period EMA of the MACD is plotted, and this becomes the Signal Line for the indicator. The Signal Line is plotted over the MACD and this will be used as the trigger reading for trading signals (both buy signals and sell signals). These elements form the basis of the MACD construction, and it is important to have a strong understanding of these elements if you plan on using the indicator in your daily trading.
Three Common Approaches to the MACD
Now that we understand the basics of how the MACD is calculated, it is a good idea to look at some of the common ways that the MACD is viewed by traders so that we can get a sense of how exactly the indicator is used to identify trading opportunities. There are a few different ways the indicator can be interpreted, and the three of the most common methods proven to be the most effective for traders include
- Crossovers,
- Divergences,
- and in identifying Overbought / Oversold conditions
Part two of the three part series on MACD
Forum on trading, automated trading systems and testing trading strategies
newdigital, 2013.08.01 09:16
MACD Oscillator Technical Analysis Fast Line and Signal Line
MACD is used in various ways to give technical analysis information.
- center line crosses indicate bullish or bearish markets; below zero is bearish, above zero is bullish.
- MACD crossovers indicate a buy or sell signal.
- MACD oscillations can be used to indicate oversold and overbought regions
- Used to look for divergence between price and indicator.
MACD Construction
The MACD is constructed using two exponential moving averages and MACD indicator plots two lines. The two default exponential moving averages used are 12 and 26. Then a smoothing factor of 9 is also applied when drawing.
Summary of how MACD is plotted
MACD uses 2 EMAs + a smoothing factor (12, 26 Exponential Moving Averages and 9 smoothing periods)
MACD only plots two lines- the fast line and the signal line
- The Fast Line is the difference between the 26 EMA and 12 EMA
- The signal line is the 9 period moving average of the MACD fast line.
Implementation
The MACD indicator implements the MACD line as a continuous line while the signal line is implemented as a histogram.
The fast line and signal line is used to generate trading signals using the crossover method.
There is also the center-line which is also known as the zero mark and it is a neutral point between buyers and sellers.
Values above the center-mark are considered bullish while those below are bearish.
The MACD being an oscillator indicator, oscillates above and below this center line.
Forum on trading, automated trading systems and testing trading strategies
newdigital, 2013.08.01 16:52
MACD Indicator Fast Line and Center Line Crossover
MACD Center line crossovers generate Forex trading signals using the MACD center line. The sentiment of the Forex market can be confirmed using MACD crossovers. MACD crossover above the center mark generates bullish Forex market sentiment while crossover below the center line generates bearish market sentiment.
- When the MACD fast line crosses below the center mark it is an indication of a bearish market sentiment.
- When the MACD fast line crosses above the center mark going upwards, it is an indication that market sentiment is changing to bullish.
- MACD Center-line crossover signals will lag the market trend, but they are good for confirming MACD crossover signals.
Using the EURUSD Forex chart in the example below, when MACD fast line crossed below the zero line, the sell signal was confirmed and the market sentiment changed to bearish.
Also in the example below when MACD fast line later crosses above zero line a buy signal was generated and the market sentiment changed to bullish.
Oscillation of the MACD indicator
The MACD Forex indicator is an oscillation indicator that moves up and down around a zero mark. The center-line is the neutral measurement, values above zero will indicate bullish Forex market conditions while values below indicate bearish forex market region.
The MACD is also used to indicate overbought and oversold levels. When the MACD reaches overextended levels, then a currency is overbought or oversold. However, in a strong upward trending market prices will stay overbought in this case its better to buy.
Also in a strong down trending Forex market its better to sell, because prices will stay in the oversold region for a long time.Overbought conditions occur above the zero line while oversold conditions occur way below the zero mark.
Technical Analysis Indicator MACD part three
The final wrap up in the three part series on MACD
Forum on trading, automated trading systems and testing trading strategies
newdigital, 2013.08.01 16:56
MACD Classic Bullish and Bearish Divergence
MACD Classic divergence is used as a possible sign for a trend reversal. Classic divergence is used when looking for an area where price could reverse and start going in the opposite direction. For this reason classic divergence is used as a low risk entry method and also as an accurate way of exit out of a trade.
1. It is a low risk method to sell near the market top or buy near the market bottom, this makes the risk on your trades are very small relative to the potential reward.
2. It is used to predict the optimum point at which to exit a Forex trade
There are two types:
- Classic Bullish Divergence
- Classic Bearish Divergence
Classic Bullish Divergence
Classic bullish divergence occurs when price is making lower lows (LL), but the oscillator is making higher lows (HL).
MACD Classic bullish divergence
Classic bullish divergence warns of a possible change in the trend from down to up. This is because even though the price went lower the volume of sellers that pushed the price lower was less as illustrated by the MACD indicator. This indicates underlying weakness of the downward trend.
Classic bearish divergence
Classic bearish divergence occurs when price is making a higher high (HH), but the oscillator is lower high (LH).
MACD Classic bearish divergence
Classic bearish divergence warns of a possible change in the trend from up to down. This is because even though the price went higher the volume of buyers that pushed the price higher was less as illustrated by the MACD indicator. This indicates underlying weakness of the upward trend.
Forum on trading, automated trading systems and testing trading strategies
newdigital, 2013.08.01 17:00
MACD Hidden Bullish and Bearish Divergence
MACD Hidden divergence is used as a possible sign for a trend continuation.
This setup occurs when price retraces to retest a previous high or low.
1. Hidden Bullish Divergence
2. Hidden Bearish Divergence
Hidden Bullish Divergence
Forms when price is making a higher low (HL), but the MACD oscillator is showing a lower low (LL).
Hidden bullish divergence occurs when there is a retracement in an uptrend.
MACD bullish divergence
This divergence confirms that a retracement move is complete. This divergence indicates underlying strength of an uptrend.
Hidden Bearish Divergence
Forms when price is making a lower high (LH), but the MACD oscillator is showing a higher high (HH).
Hidden bearish divergence occurs when there is a retracement in an uptrend.
MACD bearish divergence
This setup confirms that a retracement move is complete. This diverging indicates underlying strength of a downtrend.
NB: Hidden divergence is the best divergence to trade because it gives a signal that is in the same direction with the trend. It provides for the best possible entry and is more accurate than the classic type of diverging.
Forex Price Action Trading: Strategies and Examples
Basic Set-ups and Stop Placement
Most price action traders place buy or sell stop orders with a pre-determined stop loss level, and a take profit or target level. The buy or sell stop sets the level that price much reach for the order to be filled; the stop loss level sets the margin of loss that a trader will accept before closing the position; the take profit level sets the level at which to automatically close a successful position.
Basically, you determine risk based on where you are placing your stop, and then determine your target with regard to this risk level; commonly, traders will aim for at least a 1:3 risk to reward ratio, although scalpers and those who trade on shorter time frames often have to accept smaller ratios.
The buy or sell stop, or entry level, is typically set at a significant support or resistance level so that it will only be filled when price has broken definitively in the desired direction; by setting strategic entry levels in their orders, traders can ensure that they enter trades with the momentum of the market.
Perhaps the most basic set-up is the pinbar, which, if you remember has an open and close within the previous bar, and a wick at least 3 times the length of the candle body, protruding beyond the levels of prior bars.
The long wick and short body implies that traders have made a strong attempt to push price in one direction, but price has returned to earlier levels, often indicating the possibility of a reversal in trend direction.
The basic way to trade a pinbar is to place the stop loss level at the extreme of the wick, and to place your entry level above the body in a bullish scenario, and below the body in a bearish scenario. the target is set relative to the risk level represented by the stop loss, often at a resistance level in a bullish scenario, or at a support level in a bearish scenario.
Another basic strategy is the inside bar, a bar or series of bars contained by the preceding bar; since the shrinking candle size implies consolidation, it can mean that a big move is on the way, either a strong continuation of the current trend, or a reversal. Because the price direction is uncertain, traders often place a orders on both sides of the inside bar, so that a downward movement will trigger a sell, and an upward movement will trigger a buy. A liberal entry point would be set just beyond the high or low of the inside bar; a more conservative entry point would be at the open or close of the preceding mother bar.
Inside bars are more effective to trade on larger time frame charts because they are so common on faster chart.
Two Examples
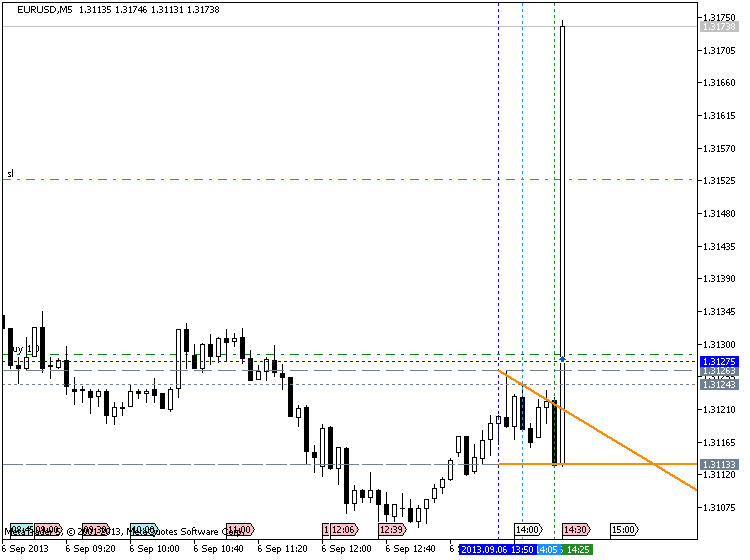
To conclude, we have two actual filled orders from trader Simit Patel. The first is a pin-bar style order placed on the Canadian Dollar/Swiss Franc pair on January 6th to sell at .85341, the black line, with a stop loss at .85995, both of which are historical resistance levels. the take profit level is set at .823333.
we can see that later on in the same day of simit's order, price reached the sell stop level at .85341, before dropping almost exactly to simit's target level of 8.23333
This second trade as in inside-bar style order place on the euro/british pound pair on December 12th. Simit sets his sell stop order at the black line, .84026, and his stop loss at the red line, about .84750, and his target the green line down at .80978. we can see that after his order was place, price did reach his sell stop order, just before a major reversal in price, allowing Simit to take profit when price begins to look bullish again, around .82800
Forum on trading, automated trading systems and testing trading strategies
Something Interesting in Financial Video January 2014
newdigital, 2014.01.19 07:43
01: NON FARM PAYROLL (Part 1) - ECONOMIC REPORTS FOR ALL MARKETSThis is the 1st video in a series on economic reports created for all markets, or for those who simply have an interest in economics. In this and the next lesson, we cover the Employment Situation Report, also known as Non Farm Payroll.
============
Non-farm Payrolls (metatrader5.com)Non-farm Payrolls is the assessment of the total number of employees recorded in payrolls.
This is a very strong indicator that shows the change in employment in the country. The growth of this indicator characterizes the increase in employment and leads to the growth of the dollar. It is considered an indicator tending to move the market. There is a rule of thumb that an increase in its value by 200,000 per month equates to an increase in GDP by 3.0%.
- Release Frequency: monthly.
- Release Schedule: 08:30 EST, the first Friday of the month.
- Source: Bureau of Labor Statistics, U.S. Department of Labor.
============
FF forum economic calendar :
- Source : Bureau of Labor Statistics
- Measures : Change in the number of employed people during the previous month, excluding the farming industry
- Usual Effect : Actual > Forecast = Good for currency
- Frequency : Released monthly, usually on the first Friday after the month ends
- Why Traders Care : Job creation is an important leading indicator of consumer spending, which accounts for a majority of overall economic activity
- Also Called : Non-Farm Payrolls, NFP, Employment Change
============
mql5 forum thread : Non-Farm Employment Strategy
============
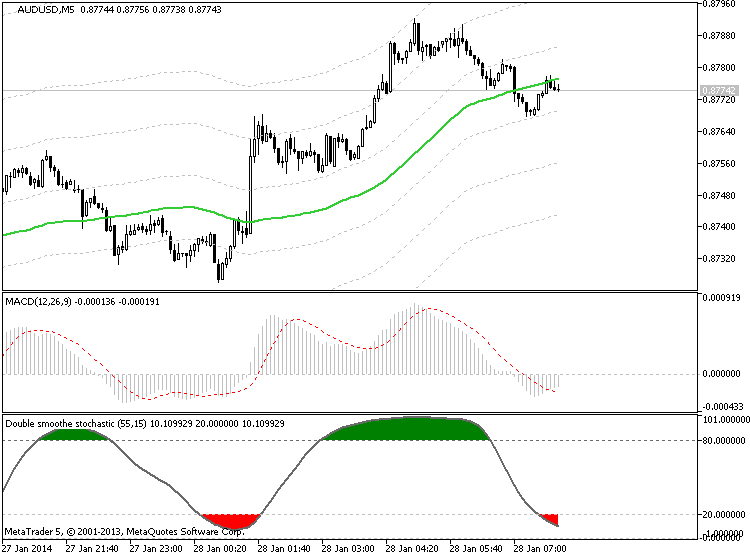
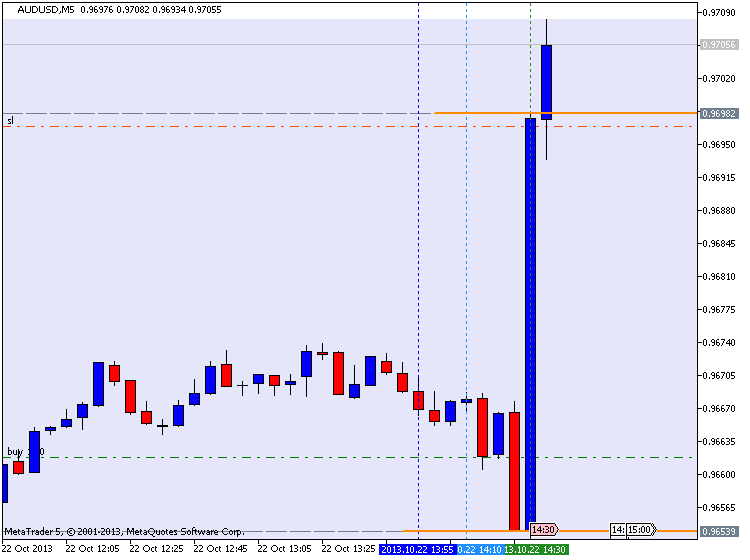
AUDUSD M5 with 45 pips in profit (by equity) for NFP :
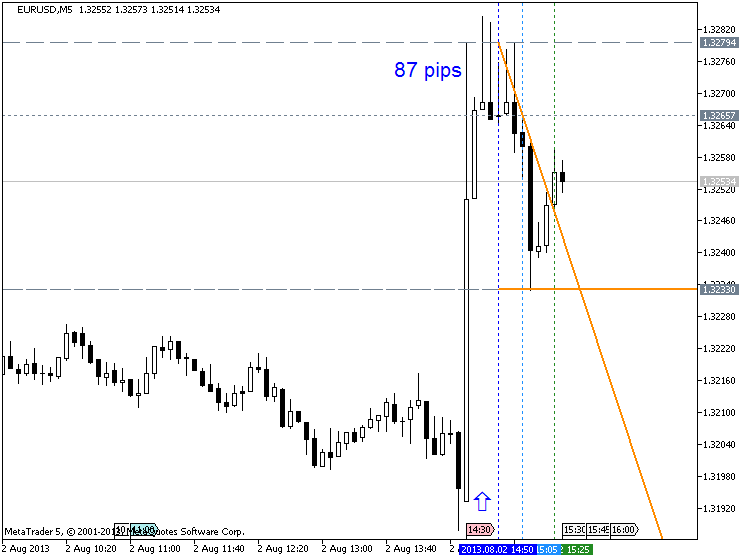
EURUSD M5 : 87 pips price movement by NFP news event :
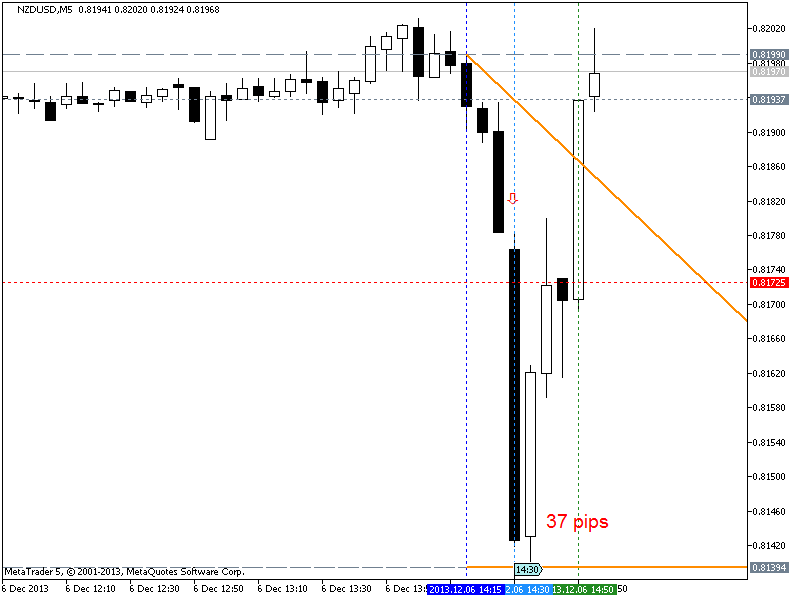
NZDUSD M5 : 37 pips price movement by USD - Non-Farm Employment Change :
Trading EURUSD during NFP :
==================
Forum on trading, automated trading systems and testing trading strategies
Something Interesting in Financial Video January 2014
newdigital, 2014.01.23 12:58
02: NON FARM PAYROLL (Part 2)- ECONOMIC REPORTS FOR ALL MARKETS
This is the second part of video lesson about nfp. The first part of the lesson is on this post :
============
Forum on trading, automated trading systems and testing trading strategies
newdigital, 2014.04.05 17:18
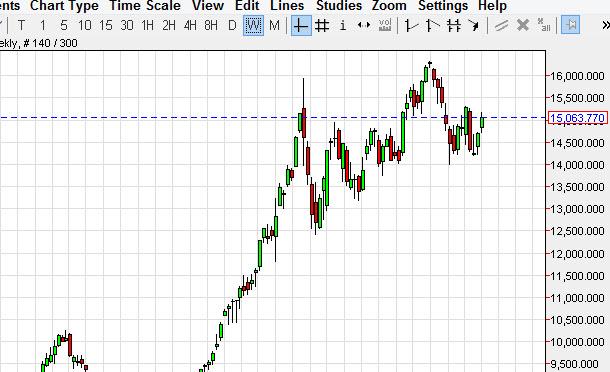
Nikkei forecast for the week of April 7, 2014, Technical AnalysisThe Nikkei as you can see gapped higher during the week, and then just went higher from there. We believe that this market will continue to go bullish, and now that we are above the ¥15,000 level, we believe that the market will target the recent highs which were above the ¥16,000 level. With that being the case, we are buyers, although we anticipate a bit of volatility between here and there. There is no interest in selling, as the market should be supported by not only a weakening Japanese yen, but also a Bank of Japan which continues to flood the markets with liquidity.
Forum on trading, automated trading systems and testing trading strategies
newdigital, 2014.04.05 17:20
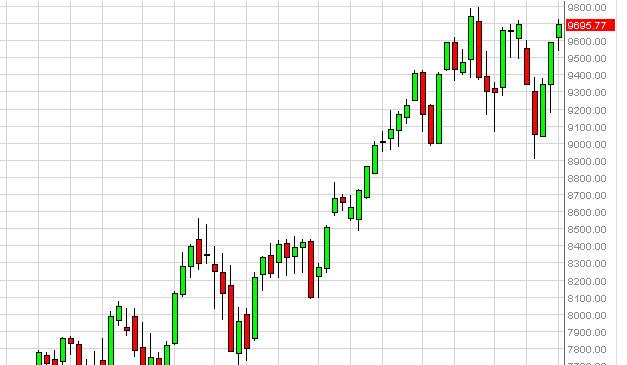
DAX forecast for the week of April 7, 2014, Technical AnalysisThe German index fell during the week, but found enough support below the €9600 level in order to pop back up and form a hammer. This hammer of course suggests that the market is going to find buyers here, and because of this we believe that the market will ultimately break out to the upside. The €9800 level courses the resistance area that we are looking at, but above there we think the market is free to go to the €10,000 level. Any pullback from here will more than likely be some type of buying opportunity as there seems to be plenty of support below.
- Free trading apps
- Over 8,000 signals for copying
- Economic news for exploring financial markets
You agree to website policy and terms of use
Trading and training video (from youtube for example) about forex and financial market in general.
Please upload forex video you consider as interesting one. No direct advertising and no offtopic please.
The comments without video will be deleted.