Something Interesting in Financial Video April 2014 - page 2
You are missing trading opportunities:
- Free trading apps
- Over 8,000 signals for copying
- Economic news for exploring financial markets
Registration
Log in
You agree to website policy and terms of use
If you do not have an account, please register
Forum on trading, automated trading systems and testing trading strategies
Press review
newdigital, 2014.04.05 17:24
NASDAQ forecast for the week of April 7, 2014, Technical AnalysisThe NASDAQ initially try to rally during the week, but as you can see found the 4300 level to be a bit too resistive. Because of this, we ended up forming a massive shooting star, but we are sitting right on top of a massive hammer from two months ago. With that, we feel there is far too much support all the way to the 4000 level to start selling, and quite frankly would feel much more comfortable buying a supportive candle if and when it prints. At this moment, we are on the sidelines.
Forum on trading, automated trading systems and testing trading strategies
Press review
newdigital, 2014.04.05 17:59
S&P 500 forecast for the week of April 7, 2014, Technical AnalysisThe S&P 500 as you can see rallied during most the week, but he got beat back just underneath the 1900 level in order to form a massive shooting star. That shooting star of course suggests that there is weakness coming into the marketplace, but we see so much support at the 1840 level that it’s almost impossible to start selling here. With that, we are bullish long-term, but recognize that a little bit of consolidation may be coming. As far as support is concerned, we see all the way down to the 1780 level.
Forum on trading, automated trading systems and testing trading strategies
Press review
newdigital, 2014.04.05 18:00
Dow Jones 30 forecast for the week of April 7, 2014, Technical AnalysisThe Dow Jones 30 tried to rally during the week, and although it did keep some of the gains, we saw a significant sell off at the 16,600 area. Because of this, we ended up forming a shooting star and we believe that this market may pullback a little bit from here. We don’t look at this is a selling opportunity though, we actually look at it as a continuation of the consolidation that we’ve seen for so long. There is a significant amount of support below, so at this moment in time we are looking for supportive candles below in order to start buying again, or a break of the highs.
Forum on trading, automated trading systems and testing trading strategies
Press review
newdigital, 2014.04.05 18:02
Silver forecast for the week of April 7, 2014, Technical AnalysisSilver markets did almost nothing during the week, so therefore there really isn’t a whole lot to look at when it comes to this chart. However, gold looks like it’s trying to bottom, so perhaps silver is to. We still see the $19 level is massive support, so therefore we can’t short being that close to it. On the other hand, we need to see at least a close on the daily chart above the top of the weekly candle here in order to start buying, which we think would release this market to go to the $22 level.
Forum on trading, automated trading systems and testing trading strategies
Press review
newdigital, 2014.04.05 18:05
Crude Oil forecast for the week of April 7, 2014, Technical AnalysisThe light sweet crude markets fell during the week initially, testing the $99 level for support. That being the case, the market found enough support down there to bounce and form a massive looking hammer. This hammer suggests the course of the market is going to go higher, probably stretching the market to the $105 level initially, or perhaps it just simply treading water in this general vicinity. Because of this, the market is certainly positive in our opinion, and we have no interest whatsoever in selling this market.
That being the case, we feel that until we get below the $97 level, it’s impossible to sell this market. That’s especially true with the hammer being formed, as it is such a bullish sign. We believe that ultimately this market will continue to drift higher, probably as high as $110 over the next several months
Brent
The Brent market fell during the majority of the week as well, but did find the $104 level to be supportive. That area has been supportive in the past, and the fact that the candle formed a hammer for the week, suggests that we are going to have plenty of support underneath going forward. With that, we are much more bullish again, and we believe that we heading towards the $112 level given enough time. It isn’t until we break below the $104 level that we feel that this market starts to really lose its luster.
On top of that, the $102 level should be supportive as well, so really we don’t have a scenario where we feel comfortable selling. On top of that, it appears that the employment situation in the United States picking up, so that will drive demand for commodities in general. Going forward, we would expect pullbacks to continue to offer buying opportunities in a market that certainly seems to have a bid in it at the moment. However, all things being equal we actually prefer the light sweet crude market over the Brent market, as it is more favorable to North American consumption.
Forum on trading, automated trading systems and testing trading strategies
Press review
newdigital, 2014.04.05 18:06
Natural Gas forecast for the week of April 7, 2014, Technical AnalysisThe natural gas markets fell during the beginning of the week, but as you can see found enough support near the $4.20 level to turn things back around and form a pretty impressive looking hammer. With this in mind, we feel that a break to the upside could be a buying opportunity again, but we do believe ultimately that the natural gas markets will start to fall again. However, the technical analysis suggests that we are going to see continued buying, heading towards the $4.80 level more than likely if we can break to the upside.
Forum on trading, automated trading systems and testing trading strategies
Press review
newdigital, 2014.04.05 18:08
Gold forecast for the week of April 7, 2014, Technical AnalysisThe gold markets fell initially during the week, but as you can see found enough support below the $1300 level to bounce and form a hammer. This hammer suggests that the market is going to go higher, something that we see on the daily charts as well. We believe the market will head towards the $1400 level, and then possibly break out above there. We are buyers on a break of the top of the hammer as it should continue to show bullishness in this market as gold may have just bottomed and the $1200 level.
Forum on trading, automated trading systems and testing trading strategies
Press review
newdigital, 2014.04.05 18:10
USD/JPY forecast for the week of April 7, 2014, Technical AnalysisThe USD/JPY pair rose during the bulk of the week, but fell backwards and formed a shooting star. This suggests that we are going to continue to bounce around in the consolidation area that we’ve seen recently, so while it is a bearish signal, we believe that there’s enough support below to keep this market somewhat afloat. That being the case, we feel that the market will be a “buy on the dips” type of situation, and believe that that opportunity will present itself rather soon. Selling is not an option.
Forum on trading, automated trading systems and testing trading strategies
Press review
newdigital, 2014.04.05 18:11
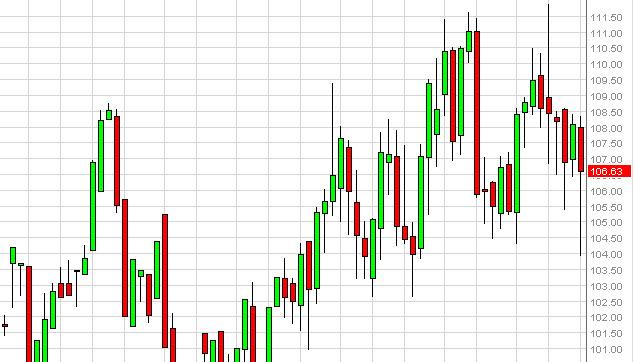
USD/CAD forecast for the week of April 7, 2014, Technical AnalysisThe USD/CAD pair fell during the bulk of the week, breaking below the 1.10 level. That of course is a negative sign, but we see support only down to the 1.09 handle, so even though we’ve had a fairly negative week, it would not surprise us at all to see support come back into the marketplace in this general vicinity. Right now, we do not have a trade signal at all but are paying attention to this next week as it could be pivotal for our positioning in this market going forward.
Forum on trading, automated trading systems and testing trading strategies
Press review
newdigital, 2014.04.05 18:12
NZD/USD forecast for the week of April 7, 2014, Technical AnalysisThe NZD/USD pair spent most of the week falling, but as it approached the 0.85 level, found enough buyers to push the market back up. The resulting candle is somewhat of a hammer, and it tells us that the market is more than likely going to try to continue to go higher, and a break of that high has this market looking for the 0.90 level given enough time. The 0.85 level is now support as far as we can tell, and in fact we considered it the “floor” of the market.