macd indicator
Forum on trading, automated trading systems and testing trading strategies
Indicators: MACD Histogram, multi-color
Sergey Golubev, 2014.06.19 12:01
Moving Average Convergence Divergence (MACD)MACD stands for Moving Average Convergence Divergence and was first developed by Gerald Appel in the late 1970s. It is an Absolute Price Oscillator (APO) and can be used in an attempt to identify changes in market direction, strength and momentum.
It calculates the convergence and divergence between a ‘fast’ and a ‘slow’ Exponential Moving Average (EMA) known as the MACD Line. A signal EMA is then plotted over the MACD Line to show buy/sell opportunities. Appel specified the MA lengths as the following percentages:
- Slow EMA = 7.5% (25.67 period EMA)
- Fast EMA = 15% (12.33 period EMA)
- Signal EMA = 20% (9 period EMA)
One of the biggest challenges when dealing with financial data is noise or erratic movements that cause false signals. By smoothing data out you can reduce the number of false signals. But this comes at a cost, and causes an increase in the lag of your signals. The genius of the MACD is that it begins by smoothing data (thus causing lag) and then speeds up the signals from the smoothed data. This combination helps to reduce false signals while minimising the lag.
By comparing EMAs of different lengths the MACD can help to identify subtle changes in the trend and momentum of a security. It is a great visual representation of the acceleration or rate of change in a trend.
How to Calculate a MACD
MACD Formula:
- MACD Line = EMA,12 – EMA,26
- Signal Line = EMA[MACD,9]
- MACD Histogram = MACD – Signal Line
- Histogram Trigger = EMA[MACD Histo,5]
MACD Excel File
We have put together an Excel Spreadsheet that will automatically adjust to the MACD settings you desire. Find it at the following link near the bottom of the page under Downloads – Technical Indicators: Moving Average Convergence Divergence (MACD)
Test Results
Is the MACD an effective indicator? We are putting it into the ring for the Technical Indicator Fight for Supremacy. It will be tested through 300 years of data across 16 global markets to discover which settings produce the best results and how it performs compared to other indicators:
- Moving Average Crossovers – Completed - Golden Cross – Which is the best?
- Moving Average Convergence Divergence (MACD) – Completed – Results
- ZeroLag MACD (ZL-MACD)
- MACD Z Score (MAC-Z)
Forum on trading, automated trading systems and testing trading strategies
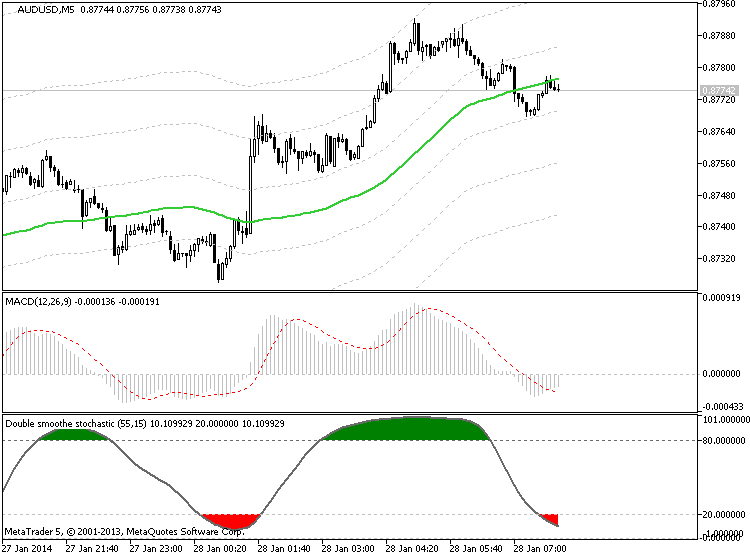
Sergey Golubev, 2014.01.28 07:59
What is the MACD Indicator? How do I use it? (based on dailyforex article)
One of the most common technical indicators that is used by day traders in the financial markets can be seen in the Moving Average Convergence Divergence -- more commonly referred to as the MACD. But one mistake that many new traders make is that they will simply start using this indicator without really understanding how it functions or makes its calculations. This can lead to costly mistakes that should have been completely avoidable. So, it makes sense to study the logic and calculations behind the MACD (and all other indicators) in order to more accurately configure your day trading positions and generate gains on a consistent basis.
The Moving Average Convergence Divergence (MACD) Defined
Anyone with any experience in the forex markets and in technical
analysis strategies has likely heard a great deal about the Moving
Average Convergence Divergence (MACD). But what exactly does the MACD
tell us -- and how is it calculated? Without an understanding of these
areas, it can be difficult to see trading signals as they emerge. Here,
will deconstruct the MACD indicator and explain how and why it is
commonly used.
“In its most basic form,” said Haris Constantinou, markets analyst, “the
MACD is a momentum indicator that is designed to follow existing trends
and find new ones.” The MACD does this by showing the differences and
relationships between a two-level combination of moving averages and
price activity itself.
MACD Calculations
To determine and calculate the MACD, we must subtract a 26 period
Exponential Moving Average (EMA) from a 12 period EMA. Then, a 9 period
EMA of the MACD is plotted, and this becomes the Signal Line for the
indicator. The Signal Line is plotted over the MACD and this will be
used as the trigger reading for trading signals (both buy signals and
sell signals). These elements form the basis of the MACD construction,
and it is important to have a strong understanding of these elements if
you plan on using the indicator in your daily trading.
Three Common Approaches to the MACD
Now that we understand the basics of how the MACD is calculated, it is a
good idea to look at some of the common ways that the MACD is viewed by
traders so that we can get a sense of how exactly the indicator is used
to identify trading opportunities. There are a few different ways the
indicator can be interpreted, and the three of the most common methods
proven to be the most effective for traders include
- Crossovers,
- Divergences,
- and in identifying Overbought / Oversold conditions
Technical Analysis Indicator MACD part one
Most technical analysis indicators are lagging. Let show you how to use MACD properly and its Leading indicator values.
- Free trading apps
- Over 8,000 signals for copying
- Economic news for exploring financial markets
You agree to website policy and terms of use
Hello,
Can someone please explain how to use macd indicator?
Thanks