Indicators: Moving Averages, multi-timeframe
Let me tell you a little nuance -
iMA on H1 with period 24 is approximately equal to iMA on D1 with period 1 at 23:59 these values are equal
This approach can be very useful for taking support resistance lines from higher timeframes - d1 w1, on h1 graph, for example.
esta muy bien pero la parte de ponerle niveles a la media movil no aparese en el original de movil average si tiene opcion de niveles , hay alguna forma de hacerla mul tiperiodo pero como la original
this very well but put part of the moving average levels aparese not in the original if you average mobile option levels, is there any way to make multi tiperiodo but as the original
Death Cross pattern (based on How to Trade the Death Cross on Oil article)
What is the ‘Death Cross’ pattern?
Though its sounds scary and ominous, the ‘Death Cross’ (DC) pattern is neither. In fact, consumers that are tired of paying $80 or more to fill up their gas tank will rejoice at what this pattern means to the price of oil. The DC occurs when the short-term 50-day simple moving average crosses below the 200-day simple moving average. Typically, in a moving average crossover, a shorter term moving average crosses below a longer term moving average a sell signal is generated and price is expected to move lower. What makes the DC different is that the 200-day SMA is watched by so many traders to determine long term bullishness or bearishness that when the 50-day crosses below the 200, the selling can be substantial as institutional and retail selling converge.
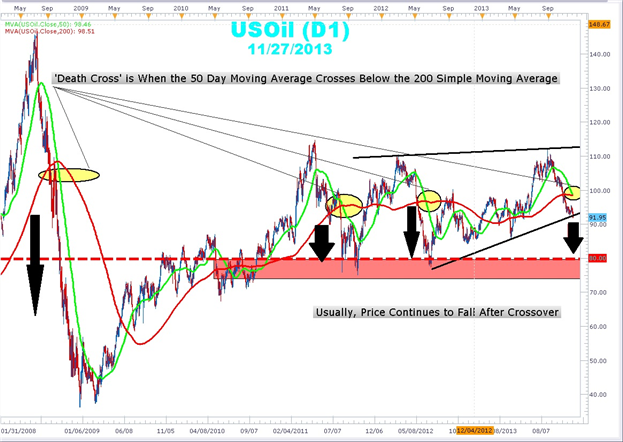
In the chart above there are 4 DCs on USOil which led to significant price moves lower. There is one DC on June 18, 2010 in which the decline was minimal. In fact, since 1984, there has been 21 Death Cross (DC) formations on oil with an average decline of 8.3% over the following 6 months after the crossover. With the current price of oil just south of $92.00 per barrel, we could see a decline down to the $80- $84.00 region once oil closes, on a daily basis, below the current trend line. This will be good news for oil bears and US holiday drivers but bad news for Oil bulls, for now.
In each of case of the DC, the following price decline was short-lived and a sharp rebound followed. This could give new life and a great entry point for those who are bullish oil. Such a rebound would need confirmation. Oil bulls will wait their turn and may look for the advent of the Golden Cross before initiating longs. The Golden Cross is made up of the 50-day simple moving average crossing above the 200-day simple moving average and is a major buy signal. The DC is nothing to fear if you know which direction to trade. It marks the possible acceleration and extension of and oil “slide” lower.

- www.dailyfx.com
Compilation error
![]()
It can't be compiled. The code has some errors and warnings.
Change line 50 from this :
To this :
Compilation error
- Free trading apps
- Over 8,000 signals for copying
- Economic news for exploring financial markets
You agree to website policy and terms of use
Moving Averages, multi-timeframe:
The iUniMA MTF indicator allows the user to choose between different types of moving averages (SMA, EMA, SMMA, LWMA, AMA, DEMA, TEMA, FRAMA, and VIDYA). It can be applied to any timeframe, higher or lower than the current chart's timeframe.
Compared to the original iUniMA indicator, the only extra setting is the second timeframe used as input for the calculations. When the indicator is applied to a timeframe lower than the current chart's time frame it's not possible to display all values. In this case, depending on the price type chosen, it will use a different approach to give the most appropriate value.
Author: traderak20