Triangular moving average (TMA) ... - page 69
You are missing trading opportunities:
- Free trading apps
- Over 8,000 signals for copying
- Economic news for exploring financial markets
Registration
Log in
You agree to website policy and terms of use
If you do not have an account, please register
Got the TMA slope normalized histo too three colors and the color gray means the area of the flat or the reversal exactly the same as that of TMA. Want say that the TMA slope normalized 1.5, which did Mladen is also misspelled?
I did not make the "tma slope". I believe it is written in the code who made it. What I made was some code changes that some forum members asked and that is all.
Mladen, please add the signals at the output of the upper band on the indicator, the Extreme TMA line, which I posted just above. It has a third color and mode redraw false. Could be a very good indicator
I don't want to say that this indicator is also misspelled. If this is an error, it is very good because it highlights the area of the flat.
Mladen, please add the signals at the output of the upper band on the indicator, the Extreme TMA line, which I posted just above. It has a third color and mode redraw false. Could be a very good indicator
Hi,
I would like to know what do you think about this TMA strategy: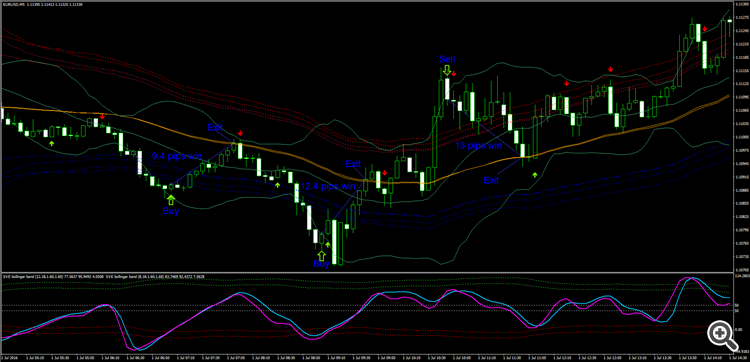
Problems with this strategy:
1. If you trade on 5 min or more chart, there aren't many opportunities to enter.
You can increase your entry opportunities by trading more currency pairs simultaneously.
You can increase opportunities by entering every time a candle crosses the most outer TmaTrue line. By doing that you'll increase your chances of losing and you will in most cases decrease number of pips you win and increase the number of pips you lose.
2. If you trade on 5 min, 15 min or 30 min chart, you will have to sit and wait a long time between your entry and exit, because it's impossible to know for sure when the price will touch the middle line(when you exit).
You can go into 1 min chart, which will increase the number of your entries and you won't need to wait too long between entry and exit. The down side is that there things move much faster and you win and lose much less pips. Not to mention the spread and the delay!
3. The biggest problem with this strategy is this:
Something like this occurs maybe once every two days on a 5 min chart. You can avoid some of the lost by entering only once and look for the next entry after the price touches the middle line. By doing that you may miss out on some of the winning entries.
Please, let me know what you guys think about the strategy and how it can be improved.
The original strategy: http://www.forexstrategiesresources.com/trading-system-metatrader-4-iii/397-tma-band-true/
One last thing, what do you think about binary options? If you can find or create a strategy that is at least around 65% accurate(itm), you can make a lot of more.
Safe trading!
S
Try this indicator , it's fantastic !!
Yes it is interesting but we have to wait till open market and see what it do in real :)
Try this indicator , it's fantastic !!
Hello TCT,
Made the Sma centered envelopes, some cosmetic changes made the sma centered multi colored, also now the upper and lower envelopes have separate deviation controls, hopefully to make a better fit. If 1 color for the sma centered is preferred just need to change the first 3 colors to the color desired.
Happy Holidays!
Hello,
sma centered envelopes doesnt't work on the actual version of mt4.
can someone solve the problem?
thanks
lucmat
Hello,
sma centered envelopes doesnt't work on the actual version of mt4.
can someone solve the problem?
thanks
lucmat