Analysis
Is it a Candle? Is it a Trend?
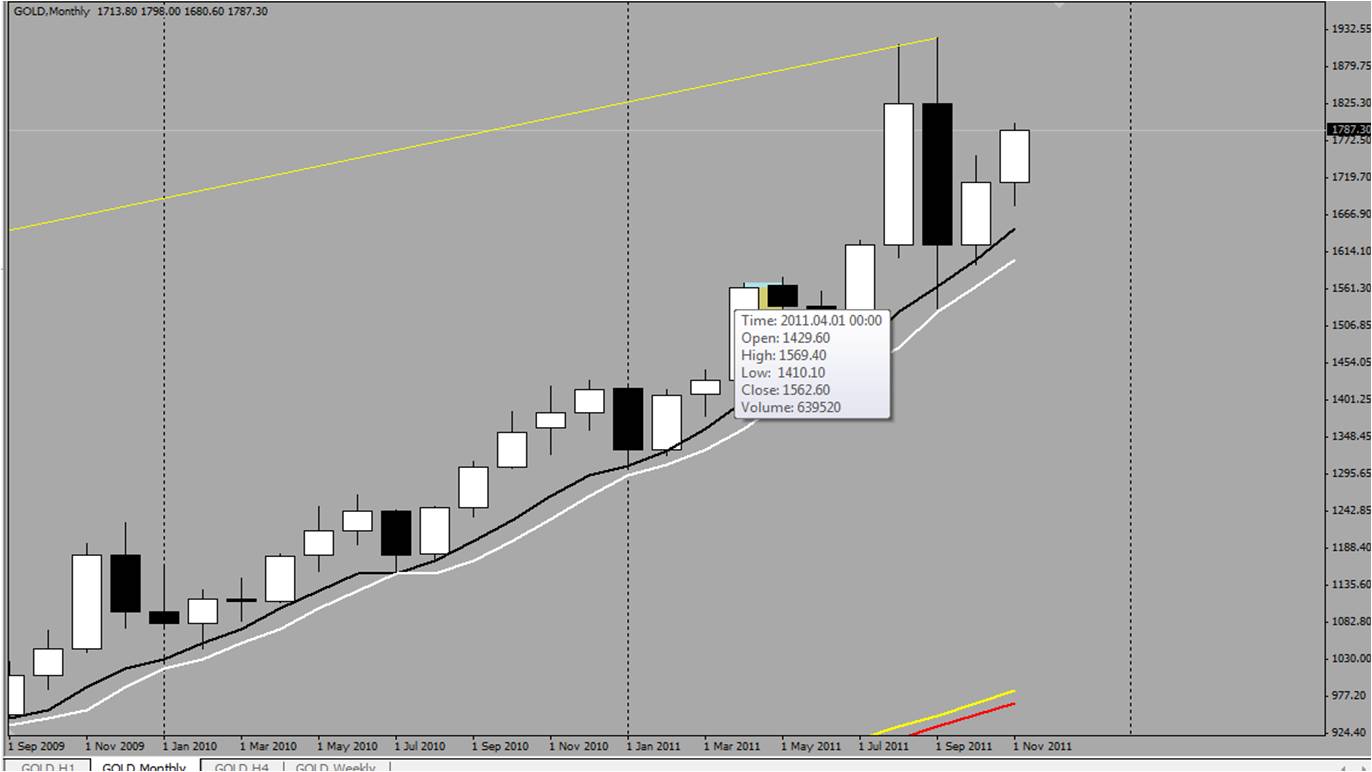
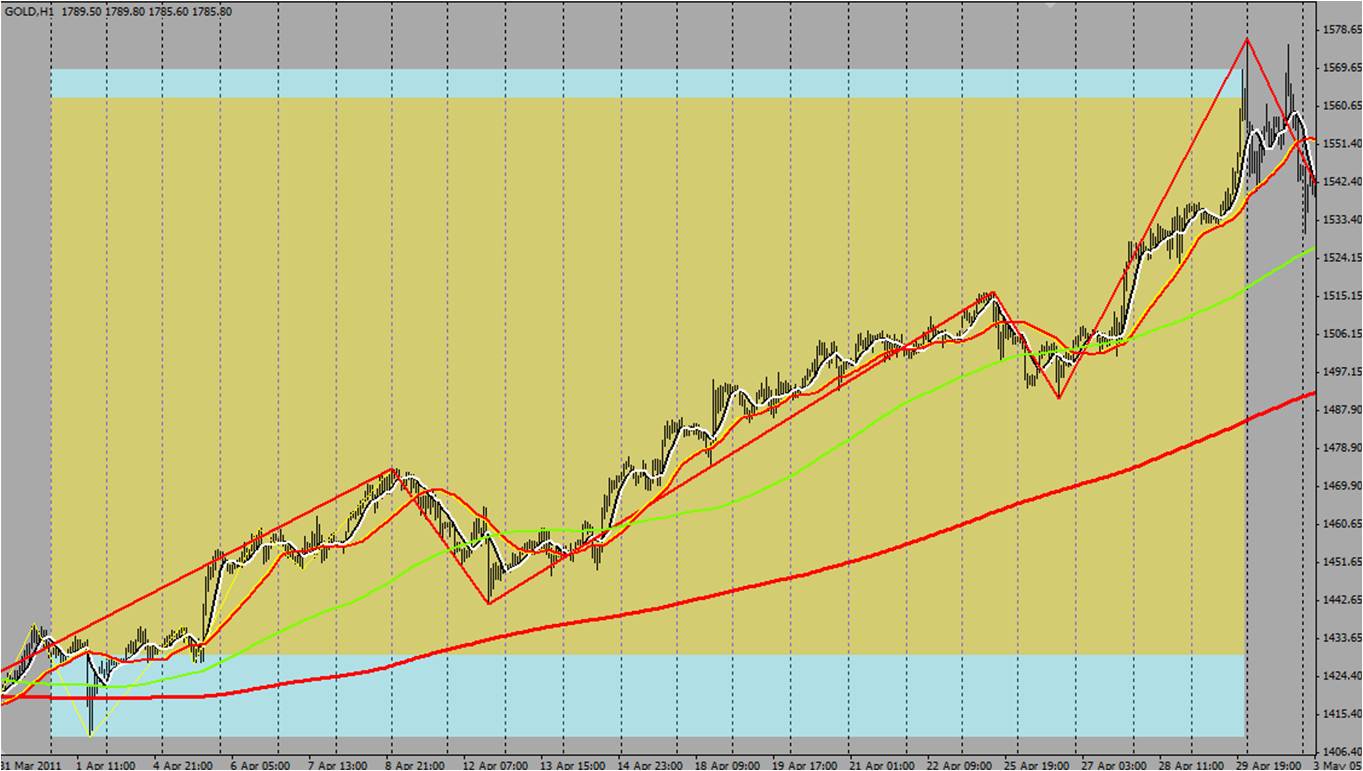
Higher time frame candles are in fact trends. Let us look at the April 2011 candle of Gold.
I have highlighted the opening and closing price in peru color and the high and low range in powder blue color. Whenever the prices are above the moving averages it is a BUY and when it is below them it is a SELL.
This is how the candle looks in MN
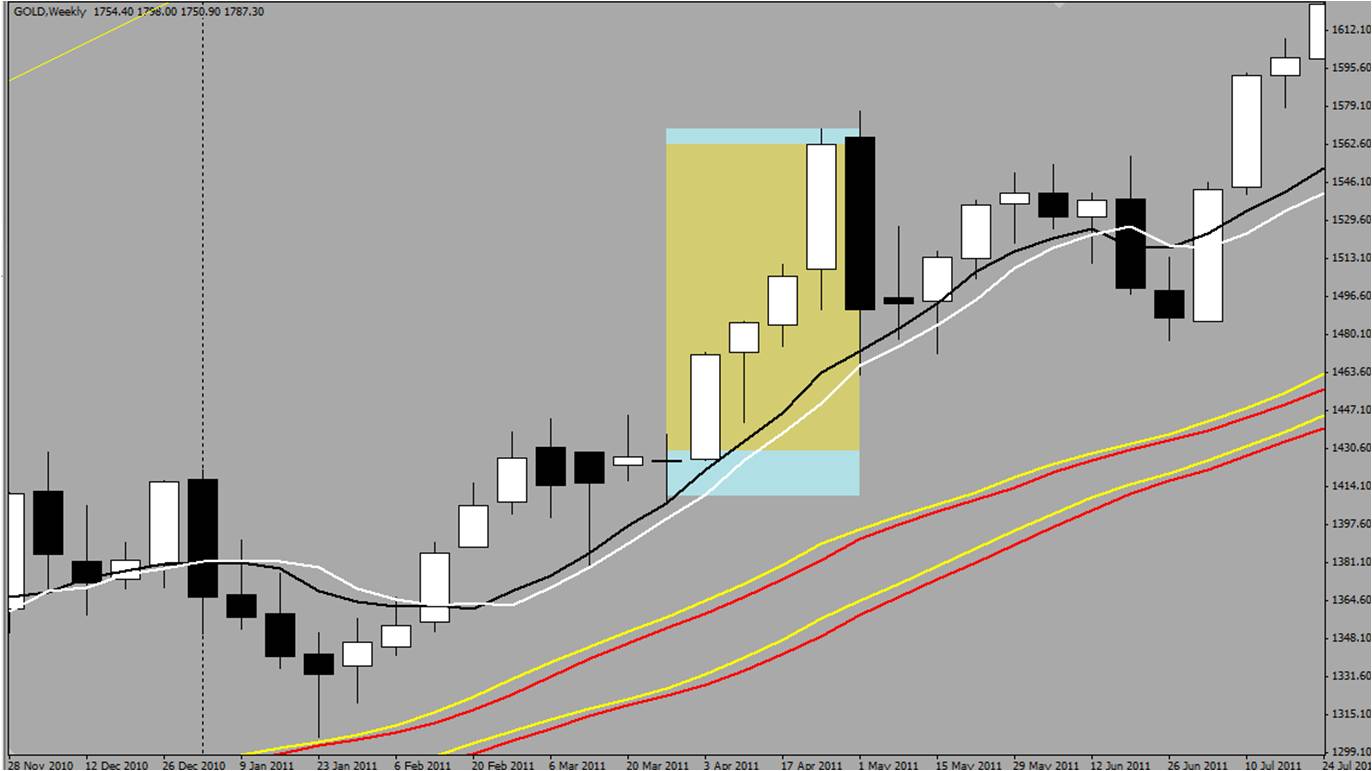
The same chart in W1
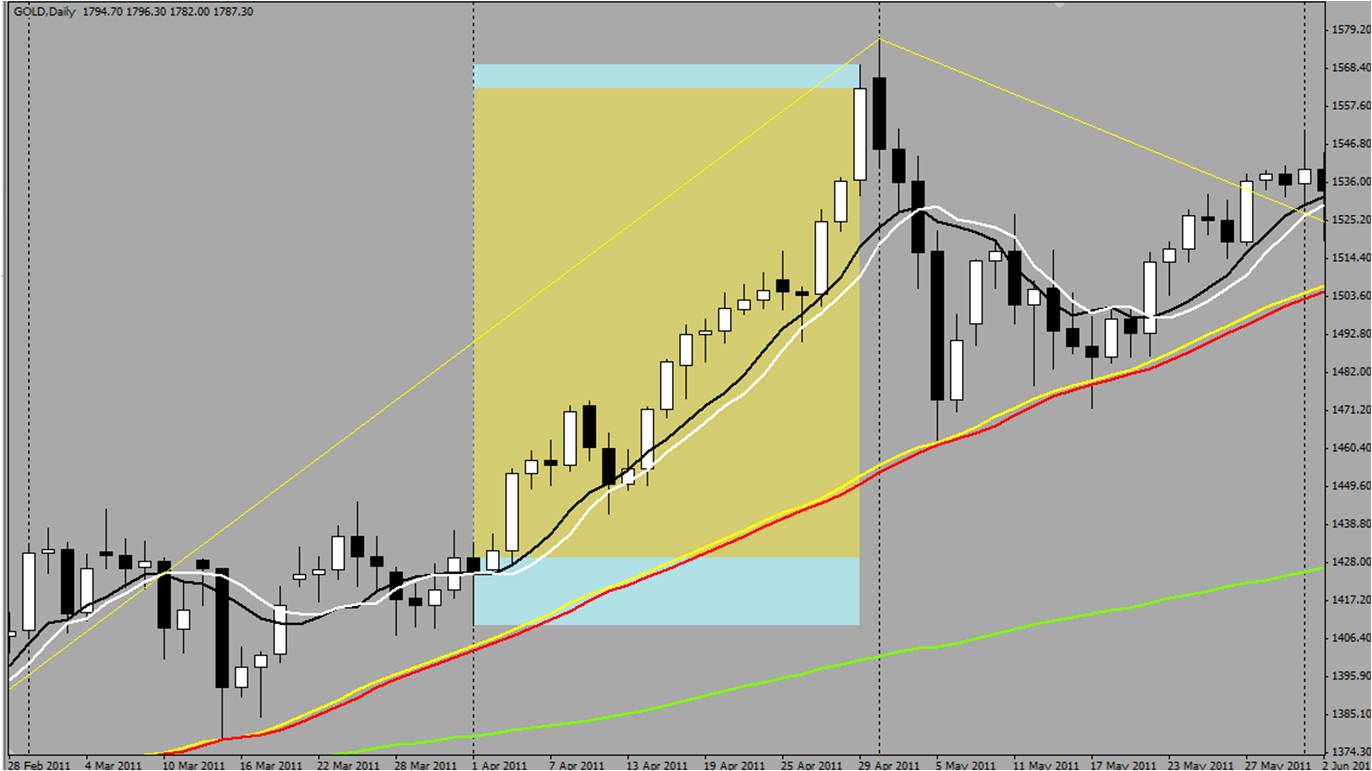
D1 chart shows a signal for BUY from the 3rd candle of April itself.
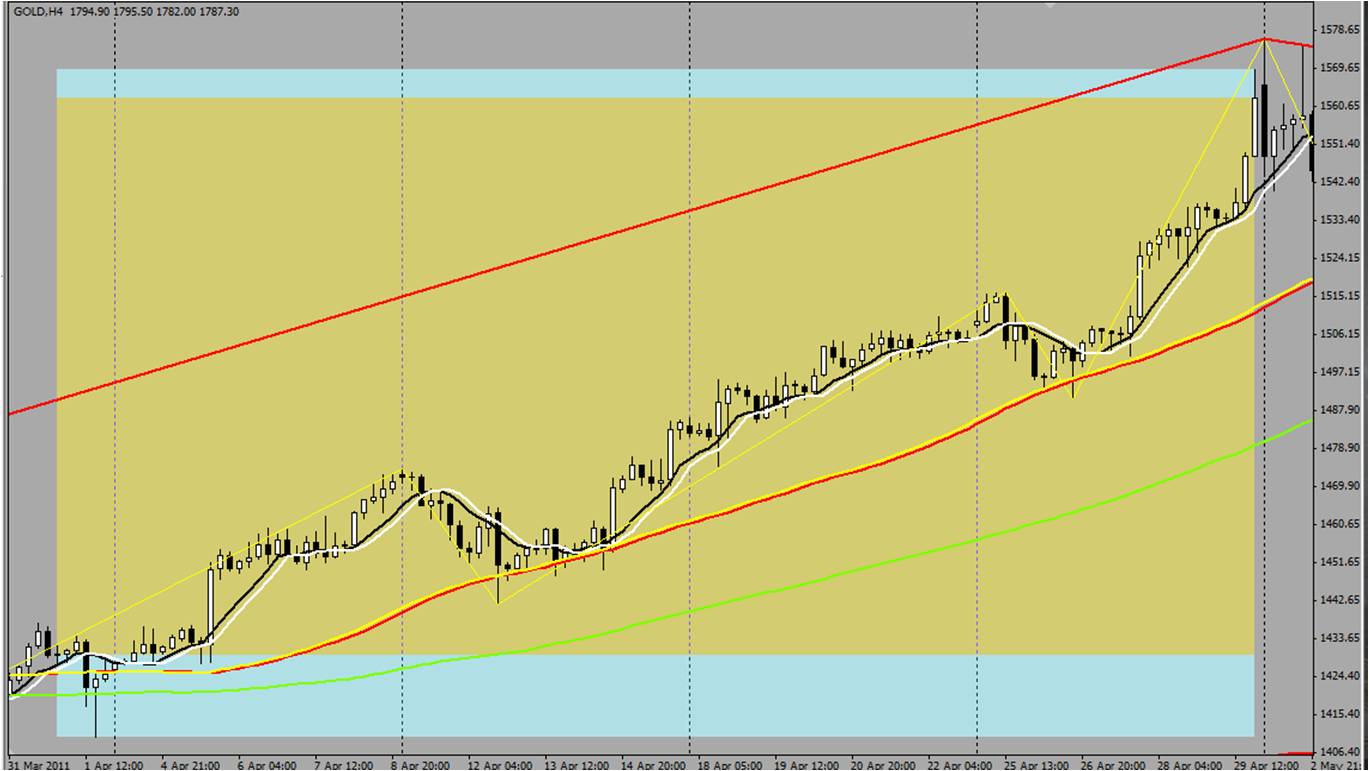
H4 and H1 also confirm the same but a clear BUY signal from the 5th of April.
Timing the trades
Nowhere is this statement truer than in Forex markets. In spite of knowing the direction of prices, timing your entry and exit in a trade can make a huge difference in the trade being a profitable trade or not.
Let us consider the H4 candle of 12:00 on 1st June 2011. (fig 1).
 FIG 1
FIG 1Looking at this BLACK candle we know that the HIGH should have formed first and the price should have moved below the opening candle. We also know that there are 4 H1 candles that make up 1 H4 candle. (fig 2).
 FIG 2
FIG 2Looking at the H1 chart, we see that for close to 3 hours the price has been above the opening price and only in the last 1 hour did it come down to form a BLACK candle. Even at the close of the 3rd H1 candle, the H4 candle would have looked like a WHITE candle as the price was above the Opening price.
Whereas in the case of the H4 candle of 4:00 on 8th June 2011 (fig 3), we can see that
 FIG 3
FIG 3the price falls below the opening price in the 1st H1 candle itself and the next 3 H1 candles retraces up before going down in the next H4 candle. (fig 4)
 FIG 4
FIG 4Even if you had entered a SELL in the 1st candle opening itself, you would have seen your profits shrink for the next 3 hours wondering if you should close the trade.
So it is not only the entry but the timing of the exit also is as important. It also means that you never have to hurry to enter a trade. Even if you missed the 4:00 candle, you can always enter the trade on the 8:00 candle.
The same information when seen with MAs reveal another aspect of price movements. Whenever there is a huge gap between the closing price of the previous candle and the MA, prices always come back to touch the MA before proceeding with the trend or reversing.
Always Remember!
BUY from a LOW and SELL from a HIGH!
Simple Trading System
If the price goes above opening price, it is a bull candle and if the price goes below the opening price, it is a bear candle!
In a bull candle, which is formed first, the LOW or HIGH?
In a bear candle, which is formed first, the HIGH or LOW?
- Free trading apps
- Over 8,000 signals for copying
- Economic news for exploring financial markets
You agree to website policy and terms of use
Submitting my analysis for EURCHF.
Week chart shows that the year's candle could remain a black candle. Expect it to range around this year's opening price and come down. Could go up to level 50.0 next year.
Waiting for a confirmation in D1 and H4 charts for a SELL confirmation. Possibly a wait for a week or two.