Hey guys, Let's test this!
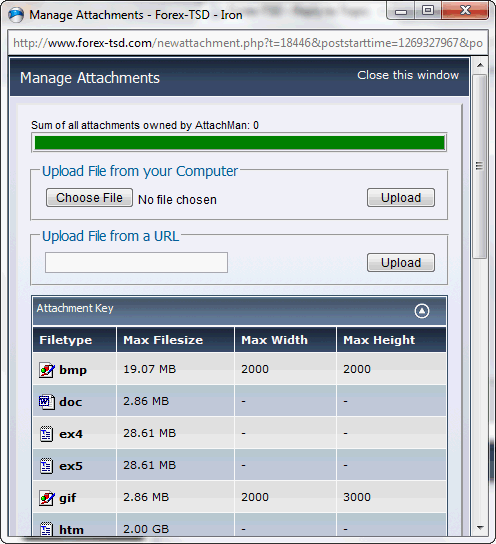
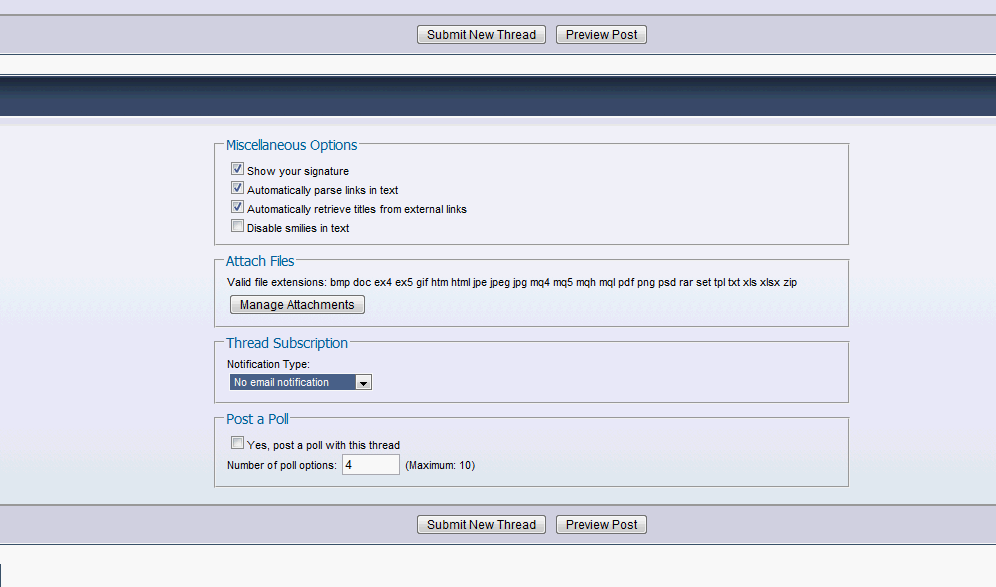
Hey. Pls edit the post and upload the images to forum.
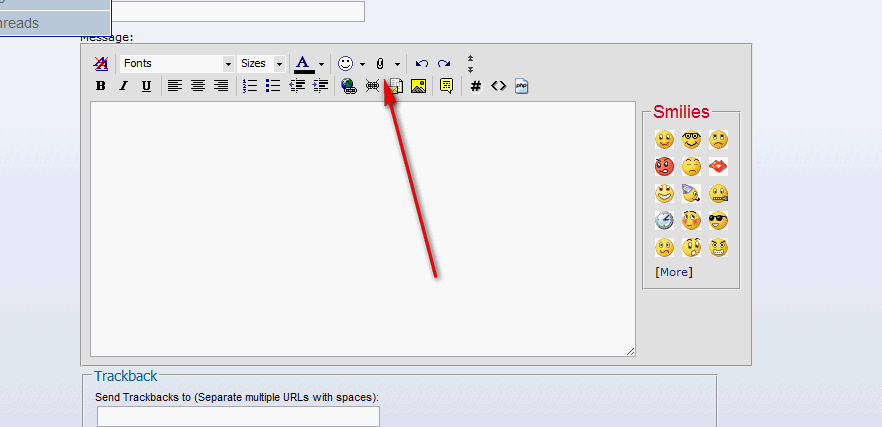
Sure, but how? I only saw an option to upload via URL.
Sure, but how? I only saw an option to upload via URL.
Hi,
Can you see the attach tool?


Hi
For starters your displayed charts are 5 min not 1 min 
Sorry it's late here...
It's irrelevant anyway, just set it up on the 1 min chart, the signals r the same.
Here's a proper picture of the simple set up. The red vertical line denotes a sell.
You will get stopped out here sometimes but when the price finally does move out of the range it really moves.
Following
It looks good on following strong trends, and trading from pivots... thats all
cheers
mike
Hey guys,
I put this system together last night after coming to the conclusion that there must be some way to take advantage of the price's tendency to move in large waves.
I observe these waves on the 1 minute chart all the time. I'll share this system with you guys with the hope that at least some of you will join me in forward testing it.
As far as systems go this one is pretty simple. It mainly only attempts to follow the price action over large moves while limiting losses. It is capable of making 100 pip gains while risking very little. Though actually getting those 100 pips takes experience.
Some newer traders who can't read that currency pair as well might close the trade early, resulting in around 40 pips or something.
Anyway...
my theory here is very simple. We need an indicator that simply mimics the price action but that also provides signals based on said action.
Instead of writing something from scratch I found a pretty perfect analogue.
This is the indicator that you will need for this:
Williams Percent Range.
It's already in your Indicators folder.
Set input to 2000, chart to 1 minute.
You will have this:
You can see some nice price action there.
Now let's add a few levels.
I won't draw this out.
What I'm thinking of is selling at -60 for a sell signal, like this:
With a stop loss at -50. Some may think that -40 would be better but I've found that -50 is usually fine because if it retracts that far its very likely to reverse all the way to -60 anyway.
The above example is for a sell, obviously. The system only sells into negative momentum. This means that you only sell if the price HAS BEEN all the way up to -20. This helps to ensure that we are getting in with a huge wave.
Simply reverse for a buy trade. Buying at -40 with -50 for stop loss.
Now, this doesn't give you much action and you might want to take more trades in a day. If so you can do this:
Then, your Trip Lines would be:
Buying:
-40 from below
-20 from below
Selling:
-60 from above
-80 from above
By using the extra trip line and watching the five majors you will almost always have at least one of them about to pop off.
I know the indicator looks cluttered but you get used to that pretty fast.
PLEASE DISREGARD THE OTHER RANDOM INDICATORS IN MY METATRADER PICS. THEY ARE IRRELEVANT HERE. THE ONLY INDICATOR THIS SYSTEM USES IS WILLIAM'S SET TO 2000.
I just didnt' feel like uploading new screenshots when I realized I'd left those indicators on there.
If I havn't been clear please let me know.
Let's test this!I am going to forward test this and I will let you know my results.
Any ideas for profit targets?
I am going to forward test this and I will let you know my results. Any ideas for profit targets?
I just shorted gbp/usd at 159.25.
Had a 9 pip profit, went back to even, and I am still short.
Any ideas for profit targets?
- Free trading apps
- Over 8,000 signals for copying
- Economic news for exploring financial markets
You agree to website policy and terms of use
Hey guys,
I put this system together last night after coming to the conclusion that there must be some way to take advantage of the price's tendency to move in large waves.
I observe these waves on the 1 minute chart all the time. I'll share this system with you guys with the hope that at least some of you will join me in forward testing it.
As far as systems go this one is pretty simple. It mainly only attempts to follow the price action over large moves while limiting losses. It is capable of making 100 pip gains while risking very little. Though actually getting those 100 pips takes experience.
Some newer traders who can't read that currency pair as well might close the trade early, resulting in around 40 pips or something.
Anyway...
my theory here is very simple. We need an indicator that simply mimics the price action but that also provides signals based on said action.
Instead of writing something from scratch I found a pretty perfect analogue.
This is the indicator that you will need for this:
Williams Percent Range.
It's already in your Indicators folder.
Set input to 2000, chart to 1 minute.
You will have this:
You can see some nice price action there.
Now let's add a few levels.
I won't draw this out.
What I'm thinking of is selling at -60 for a sell signal, like this:
With a stop loss at -50. Some may think that -40 would be better but I've found that -50 is usually fine because if it retracts that far its very likely to reverse all the way to -60 anyway.
The above example is for a sell, obviously. The system only sells into negative momentum. This means that you only sell if the price HAS BEEN all the way up to -20. This helps to ensure that we are getting in with a huge wave.
Simply reverse for a buy trade. Buying at -40 with -50 for stop loss.
Now, this doesn't give you much action and you might want to take more trades in a day. If so you can do this:
Then, your Trip Lines would be:
Buying:
-40 from below
-20 from below
Selling:
-60 from above
-80 from above
By using the extra trip line and watching the five majors you will almost always have at least one of them about to pop off.
I know the indicator looks cluttered but you get used to that pretty fast.
PLEASE DISREGARD THE OTHER RANDOM INDICATORS IN MY METATRADER PICS. THEY ARE IRRELEVANT HERE. THE ONLY INDICATOR THIS SYSTEM USES IS WILLIAM'S SET TO 2000.
I just didnt' feel like uploading new screenshots when I realized I'd left those indicators on there.
If I havn't been clear please let me know.
Let's test this!