Wave_AutoTrendLines - New MT4 indicator
For those who knows Russian.
On this forum two new tactics (trend and contrtrend) of trade come into a question with this indicator
Hi asystem2000,
I dont speak Russian but there seem some interesting discussions in the forum. İs there any indicator avaliable for the arrows in the graph?I think they are derived from pivot bars and they look interesting.
Hi asystem2000,
I dont speak Russian but there seem some interesting discussions in the forum. İs there any indicator avaliable for the arrows in the graph?I think they are derived from pivot bars and they look interesting.
Something similar is observed.
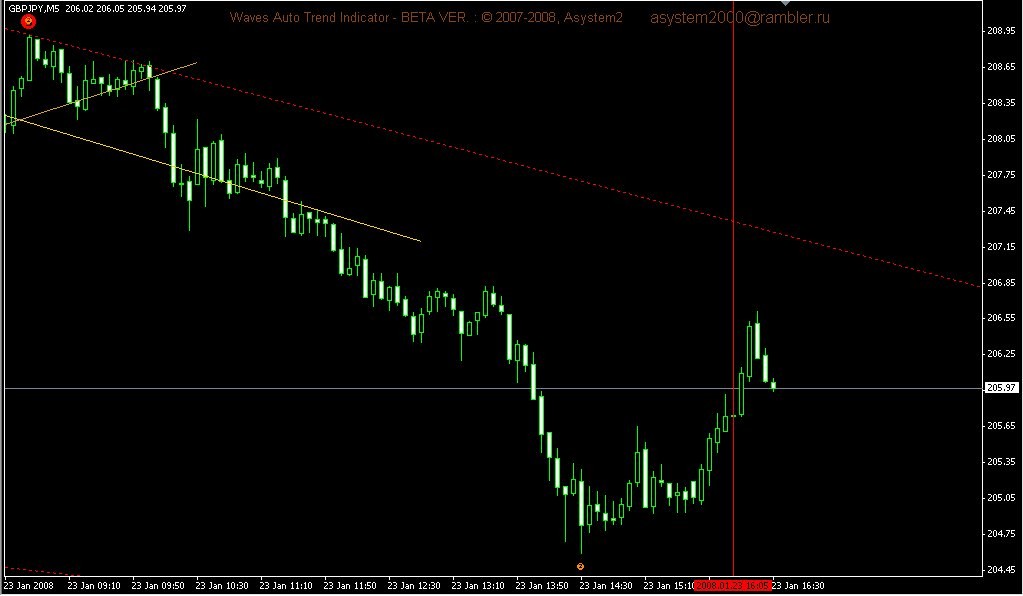
Red Stop lines are the local Fibo correction levels.
Black lines are the local project entry break levels.
But I don't understand some figures
Yes. I think that Wave_AutoTrendLines indicator can be used as on the graph.
Such marking will correspond to semaphores of the low period
After the big ride on GY, Hooah !
Time to forward test :
I plot a vertical line when the orange dot appear :
Seems to be a ZigZag which appear after "X" bars
After the big ride on GY, Hooah !
Time to forward test :
I plot a vertical line when the orange dot appear :
Seems to be a ZigZag which appear after "X" barsI shall strongly not discuss on this theme. I repeat, that ZZ is not used
About your example:
Each indicator demands adjustment for the each currency.
I'm using for GBPJPY:High period = 55, Low Period= 10 TrigSence=0.0005
Here is my example
As to me it's very useful.
You can see development of the High period waves.
Red trend lines emphasize its development and correction.
You can see behaviour of the low period waves inside of the red waves
You can see classical graphic patterns: Channels, triangles, crosses and others
If you will have this infirmation, you can adjust long period trade and short period trade (as swing or scalp)
This indicator not momentary. It draws only the confirmed facts.
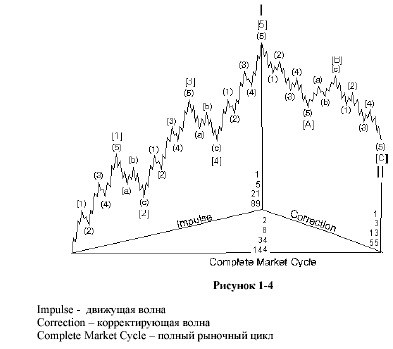
For adjustment of the High and Low period, you can experiment values from this classical picture
All possible improvements for increase of sensitivity of the indicator will be made in the following version
Good Luck
All right !
Thanks for the GY settings !
hello asystem2000,
can you bit explain why logs file under folder expert/logs so big?
thanks for sharing
Dear ladies and gentlemen!
For today, I know about many indicator bugs, it's normal, because it's BETA version. Therefore I did not hurry up spreads it at a forum.
Nowday the manufacturing the new version comes to an end.
These bugs will be eliminated.
Therefore my request.
Do not write more about the technical work party of the indicator till new version
Thanks for understanding
- Free trading apps
- Over 8,000 signals for copying
- Economic news for exploring financial markets
You agree to website policy and terms of use
Hi all!
My new MT4 Indicator for Auto Trend Lines.
Indictor calculate the waves (impulses) and then pivot points.
This indicator don't use any ZigZag algoritm.
It ease for use and, I think, is very usefull.
The description of adjustments in the following comment
To familiarize with other my works it is possible here My works
Good Luck