Effective 3 EMAs
Just like you, I have too many indicators and systems in my library. HAving too many indicators is not a good way to trade, it will have you comin gin too late by the time you finish looking at them to make a decision. I guess that eventualy we start to move away from the techniccal basics which is the issue since we want to find something that will make trading easier for us. What happen to those old classical indicators like MACD, STOCH, chart pattern recognition, Pivot Points, etc. It seems that we are moving away to enhanced versions of these indicators that there are so many variations to choose from. If you ever find the best indicators which works in live trading, let me know. I feel that I am the keeper of all systems and indicators right now.... 
DR-X method
big regards to dr-x who stated in another spread that the best trading system is simple. EMA crossing.
isn't macd, cci, .... all about price action in and out of a moving resistance area? after reading and analysing i found cci one of the best.
cci is ploting (h+c+l)/3 around a certain ema value?
so it is the price action around this ema.
so i chose the 3 commonly used cci values 14/34/50......
6 (turbo cci) is so close from the price that for me it is the price itself.
so the bar itself is plotting the turbo cci.
i don't like ema crossing very spicky i like to trace the first zlr.....
price bouncing on one of the 3 emas.....
every big trade started with a bounce on one of the emas.....
the price pulls back, bounce, and the big move starts.....
cheers...
Try This.. too simple?
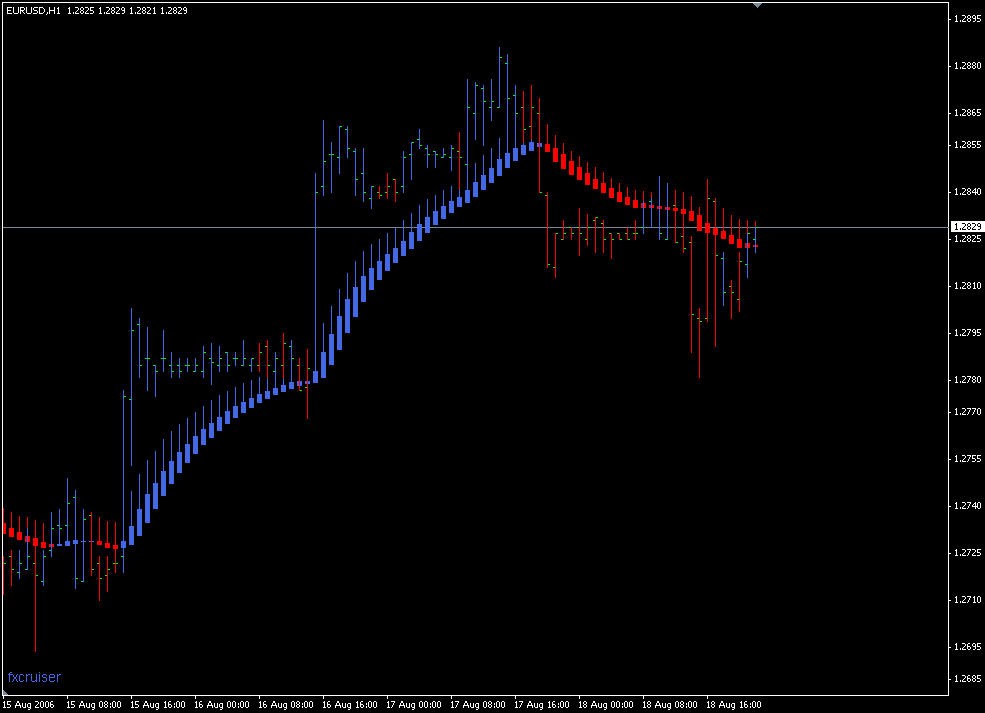
See attached. Buy on blue, sell on red.... very basic... price action, area, and direction... let me know if this is something you want to give a shot at.
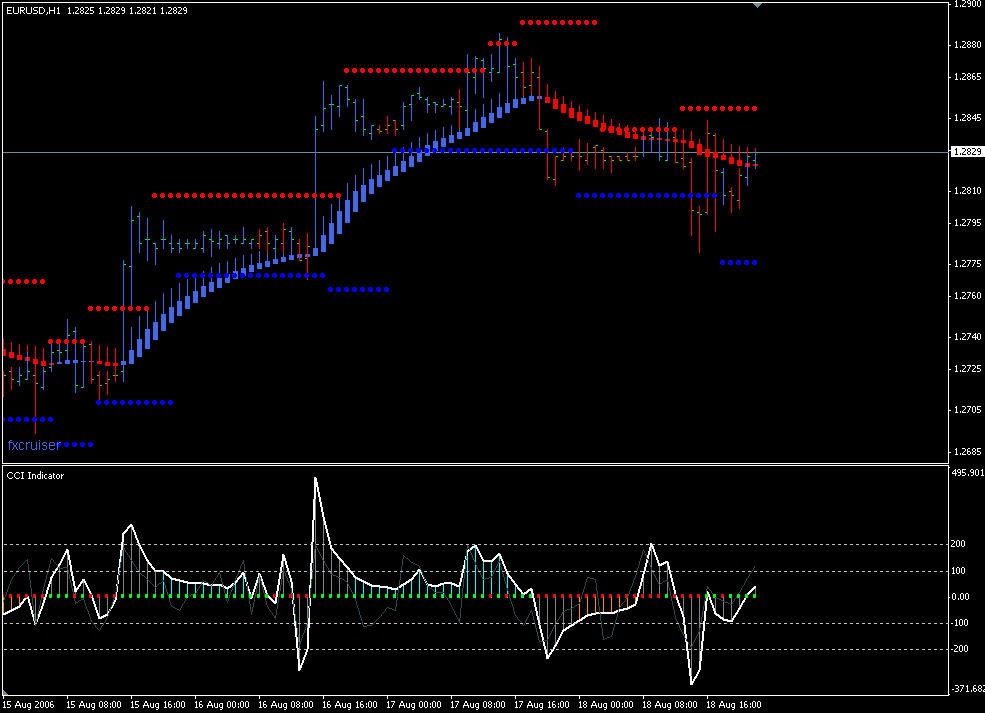
HAMA with CCI
Here is one with CCI you can consider.
Thanks,
fxcruiser
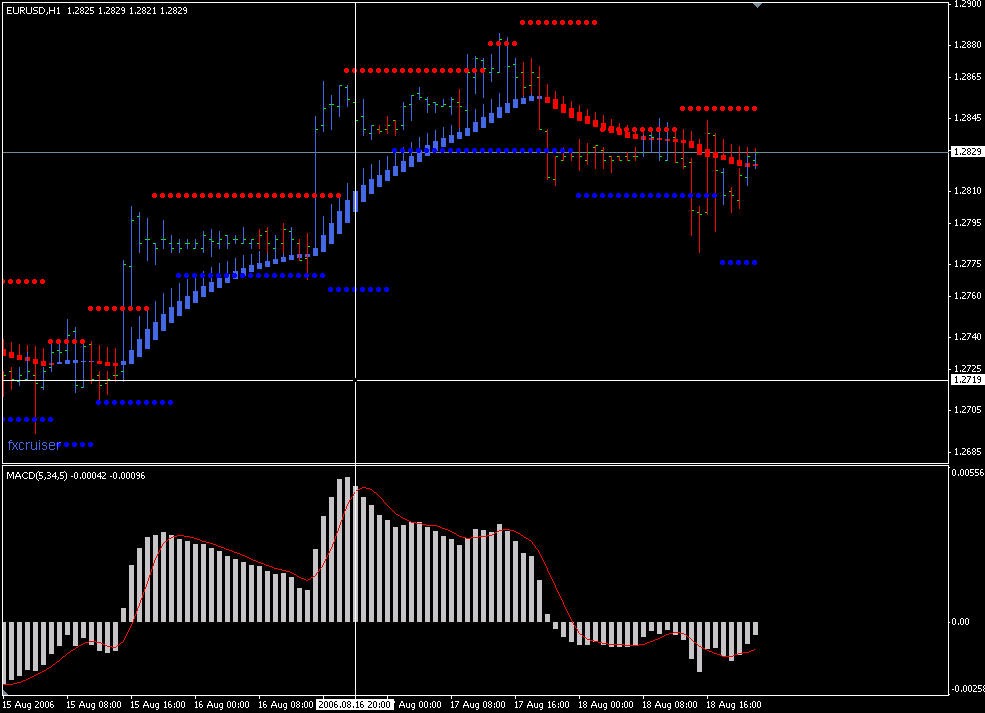
HAMA with MACD
This one with MACD. As simple as it may seem, you still have to pull the trigger and take into consideration your money managerment. There are so many indicators, trading systems, trading strategies, etc. available here. Most of them very good. All of them seems to work one way or another. I found people trying one after another or all of them at the same time, looking for that non-existent holy grail or most profitable one. It boils down to your trading style, profit objective, risk tolerance, money management, etc.. A simple system that will allow you to trade short and long term would suffice. Enter with 2 lots, exit one at some profit point (short term) and let your runner take you on a long term trade, more pips.
Also, timing your trade entry is important and make sure you don't chase the trade. There will always be another favorable trade setup.
Enjoy!
fxsniper
thanks for your posted replies.
my basic analysis was simply that :
cci is plotting the price values compared to an ema ....
why shouldn't i watch the price action around this ema?
this would simplify the trading system down to the chart level.
I like the heiken ashi ma?
could it be transformed into a histogram indicator similar to the rsi or cci filter?
Good post nnjeim
There are no many systems ema based in this forum, with the exception of the CatFx50.
Maybe we can improve yours. 
PD for Fxcruiser
Your indicator is trendmanager? or a heikin ashi modified? i ´ve got trendmanager and looks different.
distribution
thanks linuxser for your reply ..
i needed to show the start of the euro move yesterday.
go long when:
1- macd histogram >0
2- the distribution of the emas is as follows:
ema14 > ema34 > ema50
go short when:
1- macd histogram <0
2- the distribution of the emas is as follows:
ema 14 < ema34 < ema50
the market keep on moving sideways till the 2 confirmations are realized.
cheers,
Best comments I've read in here.
I've seen these "gurus" run so many people up a hill of hope when in the end the truth is price and the momentum involved in the price at extreme levels.
The averages make it less confusing.
The indications of highs and lows that have not been broken offer a map.
The key is to verify momentum at the extemes, if it is weak then you play the range, and if it is contrary then you play the break.
It really is that simple.
Where we are all getting caught is not trusting this basic truth.
And so we spend countless hours hoping for a grail, ignoring this basic and only reality.
WE ARE PAID TO TAKE RISK.
And so we must sell/buy the ranges when there is no market driver, and expect breaks when there are fundamental drivers, but take out gains quickly becuase the predators are trying to manage their money.
- Free trading apps
- Over 8,000 signals for copying
- Economic news for exploring financial markets
You agree to website policy and terms of use
hi all,
i've been monitoring this site for some time. Tons of indicators. For the last months i tried to filter. That was the hardest part. We all start to trade in a simple way by watching price action, then we forget about it. We try to sophisticate our trading style. We start loosing..... YES.....
We study, try and study again we find ourselves back to the start.
Price Action...... Resistance levels (fibo and pivots) and curves (emas) ....
yes that's all. i always admired woodies and dr bob on the cci indicator.
since these indicators (and most other indicators) are comparing the price to some ema value. why i don't plot the emas in play and watch the price around ? this is what i did.....
candlestick chart + 3 emas (14/34/50) + bollinger excellent (excellent in range bounded market + watching for squeeze)
that's all......
i also use macd (macd >0) positive momentum (macd<0) negative momentum.
my entries are around the 34 ema
go long when the price closes above ema 34 with macd pointing for a buy
go short when the price closes below ema 34 with macd pointing for a sell
my exits are normally on resistance points or fibo levels......
i would appreciate if someone could help simply this more.....