1-2-3 pattern - page 10
You are missing trading opportunities:
- Free trading apps
- Over 8,000 signals for copying
- Economic news for exploring financial markets
Registration
Log in
You agree to website policy and terms of use
If you do not have an account, please register
Hi Thomas,
I think it already shows the prices, too - the entry price and the target price are highlighted in dark blue on the price column on the right.
Is that what you meant? If not please give a theoretic example of what you like to see.
nlenzDear Mr. nlenz,
Thanks for your reply. I don't know mt4 code at all. I add %$ on MT4's fibo to display price while I draw fibo manaully. So I asked for last request.
This MTF indicator is very good. is there any manual or guide how to set?
Thanks for your kind help.
Thomas c
Dear Mr. nlenz,
Thanks for your reply. I don't know mt4 code at all. I add %$ on MT4's fibo to display price while I draw fibo manaully. So I asked for last request.
This MTF indicator is very good. is there any manual or guide how to set?
Thanks for your kind help.
Thomas cDear Thomas,
Wow, that's cool, I didn't know you can do that. Thanks.
I tried that, and saw you can add manually those (%$) by right-clicking on the chart that has the indicator active (but not on the indicator itself, just in an empty spot) -> choose Objects List, then from the list select Fibo (not the checkbox, the written line), then you click Edit button and you have the Fibonacci where you can add the (%$) and finally click on O.K., Close etc.
About the manual, I don't have it. however, I can guess some of it:
Fibo_Mode: 0 - no Fibonacci lines (Not good because won't show the target), 1 - Fibonacci Retracement (That's the default and what I use: enter at 100% and exit at target 161.8% (yellow lines), both of which are also shown in blue), 2 - Fibonacci Expansion (If you want this then it shows entry in blue only [no yellow FE], and exit FE 161.8 in yellow and blue.).
If you don't see the exit line then click on the upper or lower part of the white price column on the most right of your chart and drag down or up depending until you see the second blue dotted line. To return to the way it was - do the same in the opposite direction until the prices "pop" into place.
Enable Target - 0 - no entry and target shown, 1 - (default) show entry and target (exit) in blue both with a blue dotted line and a blue price on the price column on the right of the current chart.
Alert: False - no alert, True - yes Alert.
nlenz
Update
Update: It looks like there may be a bug that's not showing the blue entry and target correctly or at all, sometimes. I didn't write the original indicator so I'm not sure how to fix it.
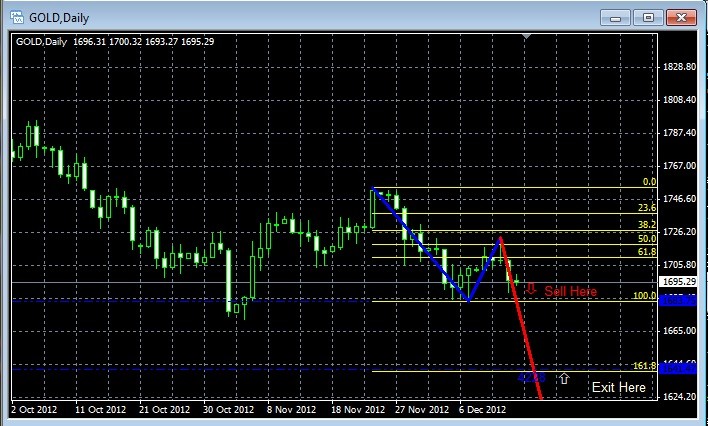
To make sure you do the right thing - it's better to just enter where the 2 solid blue lines meet when the direction is down (in direction of red line)(sell short), which is also the yellow 100% level in Fib_Mode=1, or if the direction is up (in direction of green)(buy long) then enter where the yellow lines meet (also 100% in Fib_mode=1). In both cases exit at the 161.8 line(Fib_mode=1) or FE 161.8 (Fib_mode=2).
nlenz
Examples
A picture is worth a 1,000 words:
Buy long example (when yellow+green solid lines)
Sell short example (when blue+red solid lines).
nlenz
Dear Thomas,
Wow, that's cool, I didn't know you can do that. Thanks.
I tried that, and saw you can add manually those (%$) by right-clicking on the chart that has the indicator active (but not on the indicator itself, just in an empty spot) -> choose Objects List, then from the list select Fibo (not the checkbox, the written line), then you click Edit button and you have the Fibonacci where you can add the (%$) and finally click on O.K., Close etc.
About the manual, I don't have it. however, I can guess some of it:
Fibo_Mode: 0 - no Fibonacci lines (Not good because won't show the target), 1 - Fibonacci Retracement (That's the default and what I use: enter at 100% and exit at target 161.8% (yellow lines), both of which are also shown in blue), 2 - Fibonacci Expansion (If you want this then it shows entry in blue only [no yellow FE], and exit FE 161.8 in yellow and blue.).
If you don't see the exit line then click on the upper or lower part of the white price column on the most right of your chart and drag down or up depending until you see the second blue dotted line. To return to the way it was - do the same in the opposite direction until the prices "pop" into place.
Enable Target - 0 - no entry and target shown, 1 - (default) show entry and target (exit) in blue both with a blue dotted line and a blue price on the price column on the right of the current chart.
Alert: False - no alert, True - yes Alert.
nlenzMr. Nlenz
You are so kind. Thank you very very much.
Mr. Nlenz
You are so kind. Thank you very very much.
Aw, that's O.K, you're very welcome.
A picture is worth a 1,000 words:
Buy long example (when yellow+green solid lines)
Sell short example (when blue+red solid lines).
[ATTAC
H=CONFIG]148171[/ATTACH]
nlenzDrar Mr. nlenz
You are great! Thank you again.
Best regards,
Thomas C
Drar Mr. nlenz
You are great! Thank you again.
Best regards,
Thomas CNo problem, you are welcome.
Empirical Study of the 1-2-3 Trend Indicator:
maierpaape20130415_1-2-3.pdf
Paper | vtad
Empirical Study of the 1-2-3 Trend Indicator: Paper | vtad
Admittedly this was above my head, so I focused on the conclusions. Am I right that the probability of trading this pattern successfully aren't so good? (e.g. reaching target profit?)
If so, I wouldn't be too surprised, since most indicators I've tested weren't helpful.
Also, wonder if trading it the "wrong" way would be profitable (i.e. going short when you should be long and taking profit on the other mirror side).
Thanks.