Dynamic Fibonacci Grid, Fx Money Map - page 16
You are missing trading opportunities:
- Free trading apps
- Over 8,000 signals for copying
- Economic news for exploring financial markets
Registration
Log in
You agree to website policy and terms of use
If you do not have an account, please register
Classic
To me it is a classic case of repackaging something and selling it at a premium for a profit. Except in this case they have gone and revamped something that was free (and perfectly fine in its own right) and are trying to sell it.
What is Repackaging ?
Charging for what ? If you take the free FX Guage indicator and use an indicator called stealth/ which can be purchased/ or found for free/ or use fractals, or use the Three Level Semafore/ or use something else you found free, or purchased. It is not they that are repackaging, but you. Are you selling this idea to yourself or to others.? I personally have found a way to convince myself that what I see is true. Does that make me wrong in wanting to verify and convince me that the trading decision is correct that I make.
This will be the last message I will make on this thread. I have nothing to sell.
and nothing to offer of visual enhancement. I was only trying to show that if you think , you can make something work more to your benefit than the original Idea,
Trading is an illusion, you want to be successful., but adding to the arsenal of tools you use in combination to prove the validity, is confirmation.
I wish all of you luck in the choices you make, I have only offered another way to show FIB levels and confirm them with other tools. Good Luck to all of you.
To be honest, lurking is so much more rewarding than participating.
Replying Mr Lojack
Hi Lojack,
Thanks for your posted pic that get me in to the chart, but yet, i still don't know how to apply this indicator, seems this thread are just posted directly the indi and not much clear explanation given, could you please posted any link here that explain how this indi works? Much thanks.
Ninjatrader 7
Hi, I use Ninjatrader for my trading.
Coding is easier than in MT4.
Today I have coded first version on "$$$ map"
I will test it when market open.
At another forum I found FXGauge with an alert that alerts you when there is a potential trade setup. But it is not a good idea to jump into a trade every time it alerts you.
I usually enter the trade if it alerts me when there is a "Vanilla" set up (described in the above post.)
Hi, I use Ninjatrader for my trading.
Coding is easier than in MT4.
Today I have coded first version on "$$$ map"
I will test it when market open.Great job on your indicator.
I was wondering, shoudn't the boxes all be green if the price is above them, and red if the price is below them?
The red and green signaling of the boxes is important when it comes to decding when to enter or exit a trade.
But I could be wrong. Just an observation.
I have used fx gauge from this sight and was successful 95% of the time. It is simple to read the signals. The only problem I noticed is that the indicator seems to go wacky from time to time and I have to reset it. I have been looking all over for an updated version but NO LUCK. I have tried the 4period ma and others like it but they are not nearly as easy to read as this one. Does anyone know if there is an updated version? I realy like this ind.
Thanks.......My First Post.Usually reading and soaking it all in.
This thread started 3 years ago, and might be ancient and forgotten, and never found by most.
But for those of you who find this info and are interested in using FXgauge to trade with, here is some info about the indicator, and how to recognize a trade setup.
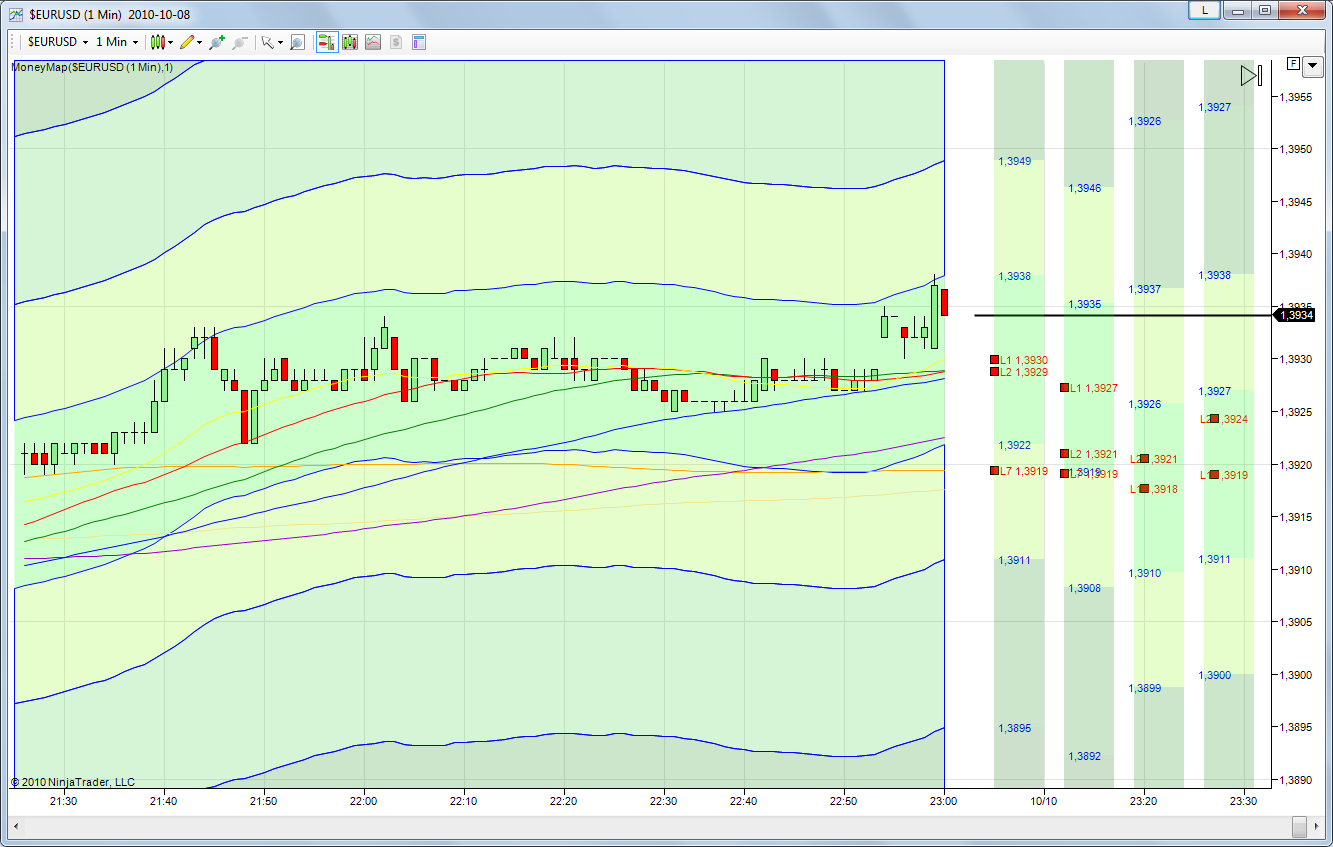
FXGauge is based on the MoneyMap, so it is designed somewhat similar.
Anywhere on the FXGuage indicator (see screenshots below) where you see a thin black line that is at a color change in the blue/white vertical lanes is a Fibonacci support or resistance area. (On the MoneyMap the fibo points show up as prices at a lane color change).
Anywhere on FXGauge where you see a thin black line that is not at a color change in the lane is a moving average. (On the MoneyMap the moving averages show up as prices in lanes where there is a solid color - either all blue, or all white etc.)
FXGuage uses 7 moving averages, and the first 2 moving averages are the most important.
In the candle chart the 2 important moving averages are 21 ma (green line) and 34 ma (brown line).
In the MoneyMap the two important moving averages are labeled L1 and L2.
Those two important moving averages show up on FXGauge as red or green horizontal lines in the lanes. (In the MoneyMap they are red and green boxes).
As with the MoneyMap, FXGuage basically condenses all the moving averages and fibo points from the 1 minute, 5 minute, 15 minute, and 1 hour chart into one place so you can look at it all at once, and decide when it is the best time to enter a trade, and collect some pips.
In the MoneyMap the primary setup signal to enter a trade is called the "Vanilla" setup.
A Vanilla setup (for a long position) is when the box or boxes in the far left lane (1 minute lane) are above all other boxes in all other lanes (and there are mostly clear roads ahead - at least 2 lanes clear, but 3 or 4 clear lanes is better). This is an ideal time to enter a long position.
The opposite is true for a short setup.
For a Vanilla setup to go short the red box or boxes in the far left lane (1 minute lane) are below all other boxes in the other lanes, and there are mostly clear roads ahead.
The entire zone between the the lowest box in the 1 minute box and the highest box in other lanes is the entire trade zone where you can enter the trade, but enter at the area of least resistance.
There might be other precautions such as looking at cross currencies to be sure it is a ok time to place a trade.
Now, applying all this to FXGuage, the rules are the same, except that FXGuage uses red and green horizontal lines instead of red and green boxes, and thin black horizontal lines instead of prices.
Unfortunately, for some reason, FXGuage does not show up correctly in all MT4 broker platforms (UPDATE: Updated version added 10/17/10 - see post #160).
I am sure the MoneyMap by Andy Sherman is irreplaceable for those who can afford it, and I might even buy it at some point in life if I could ever afford it.
But right now FXGuage seems like a promising indicator.
Example trade:
Below is a successful Vanilla trade I made in my live account (I only used 10 cents per pip).
In the image you will see the dashed green line which is where I entered the trade.
The pink line is the price.
I took profit at 8 pips.
If you look at the horizontal green lines in each lane, that is a perfect Vanilla trade set up where the green horizontal line in lane 1 is leading. In MoneyMap those lines would have been green squares instead.
The far left lane (1 minute lane) is always leading in a Vanilla setup.
Look at all the thin black lines in the lanes - those are fibonacci supports and resistances every where the thin line apears at a lane color change.
The other numbers (in solid color areas of the lanes) are the moving averages, as are the red and green horizontal lines.
And above where I triggered the order you will see at least two clear lanes (but it is at the top of the chart so I could not see how clear the road was ahead).
(Ignore the thick red line - it is only a Murray Math pivot that is part of an indicator I have loaded into the chart).
When I first placed the order I was sent into -pips below the green open trade line due to the spread. Once I caught up to the green line it moved quickly to 8 pips, and I closed the trade.
If you are trading standard lots ($10 per pip) that is a quick $80. (I am only trading 10 cents per pip currently).
There are usually several Vanilla setups in a day. Look for the most probable setup.
Even if you were to collect only 20 pips a day (without any loss) at $10 a pip, 5 days a week, that would be $1000 a week, or $4000 a month (if there are no holidays).
VANILLA TRADE GOING LONG
Another example.
This is another live trade.
I gained almost 40 pips in under 10 minutes (trading on 1 hour chart, EURUSD during Asian session).
I saw the Vanilla setup for a long position, so I took the trade.
I placed my stop loss below the last green horizontal line. It was an 80 pip stop loss. So had I got in the trade earlier when the price was a little lower I would have had less risk.
When there is a Vanilla setup you can enter anywhere in the Zone where all the green boxes are between the top box in the 1 minute lane and the bottom most box.
VANILLA TRADE GOING LONG (example 2)
VANILLA TRADE GOING SHORT
The above examples where Vanilla trade setups for going long.
Below is an example of a Vanilla trade setup for going short.
To recognize a Vanilla trade for going short look for a horizontal red in the 1 minute lane (far left lane) to be lower than all the other red horizontal lines.
The horizontal lines will change green as the price passes above them, and red as the price moves below them.
The thin black lines and areas of small and strong resistances.
If there are clear lanes below the last red horizontal line in lane 1 take the trade for anywhere between 5 - 20 pips to be on the safe side.
Someone at another forum did a great job at updating FXGauge so it works in all MT4 platforms.
He called the indicator ComboGrid, and recently (10/17/10) updated it to ComboGrid 2.
The indicator has also been updated to work with the FXGauge moving average indicator (attached below).
After you load the indicator on to a chart you will notice (after price movement) 7 colored arrows show up on the chart.
These colored arrows correspond to the 7 moving averages in the FXGauge MA indicator.
If a arrow is pointing up the moving average for that arrow if going up.
And if a arrow is pointing down, the moving average for that arrow is going down.
The 2 thick horizontal thick red and green lines in the 4 lanes correspond to the green and brown moving averages (Green = 21 Ma, Brown = 34 MA).
If you look at each lane (M1, M5, M15, H1) in the indicator you will notice the moving averages on each chart are pointing directly at the red and green and black lines in the indicator where the moving averages show up.
All the moving averages in the indicator are in a soild color zone in the indicator.
All the other black lines in the indicator that are at a color change in the lane (sich as blue to light blue, blue to white, darker blue to lighter blue etc.) are fibonacci support and resistance areas.
All of this is explained in post #155 above, and helps you determine when it is the best time to enter a trade for scalping some pips.
Attached is the updated indicator as well as FXGauge moving averages, and a template (the template goes in your MT4 Template folder).
You can also add Murray Math Pivots and perhaps Camarilla Pivots to further help you when to decide to enter a trade.
The attached image is from the 1 hour timeframe.
On the image look at the far right lane (H1), and then look at the 7 moving averages.
You will notice that the moving averages point directly at the moving averages in the H1 lane.
Moving averages 21 (green line) and 34 (brown line) are pointing at the thick horizontal red lines in H1.
Go to M1 chart and you will see the moving averages pointing to the moving average lines in the fat left lane (M1 lane)...and so on.
So you can view all the info on 4 charts in the lanes.
Thank you very much. Can't wait to try it out!