Anyone able to decipher this system?
hi
can you please post the link to where it is being sold
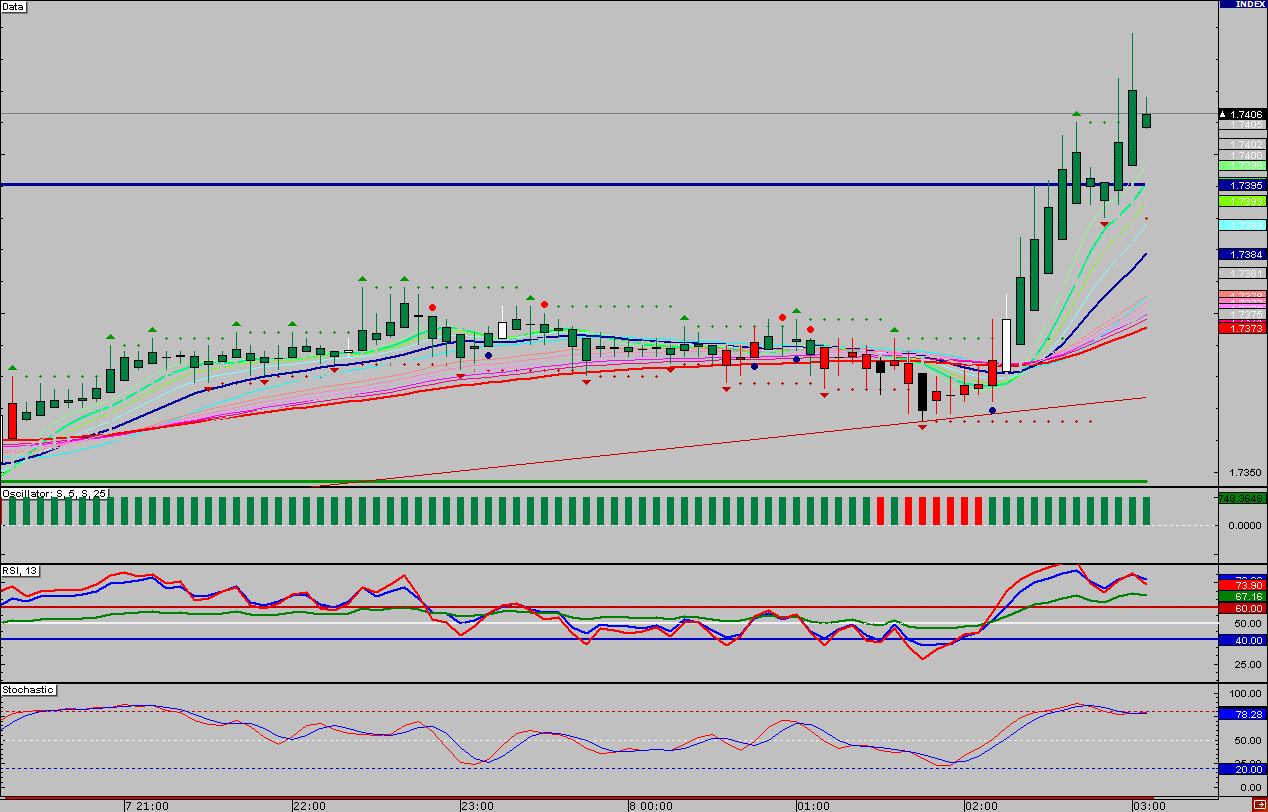
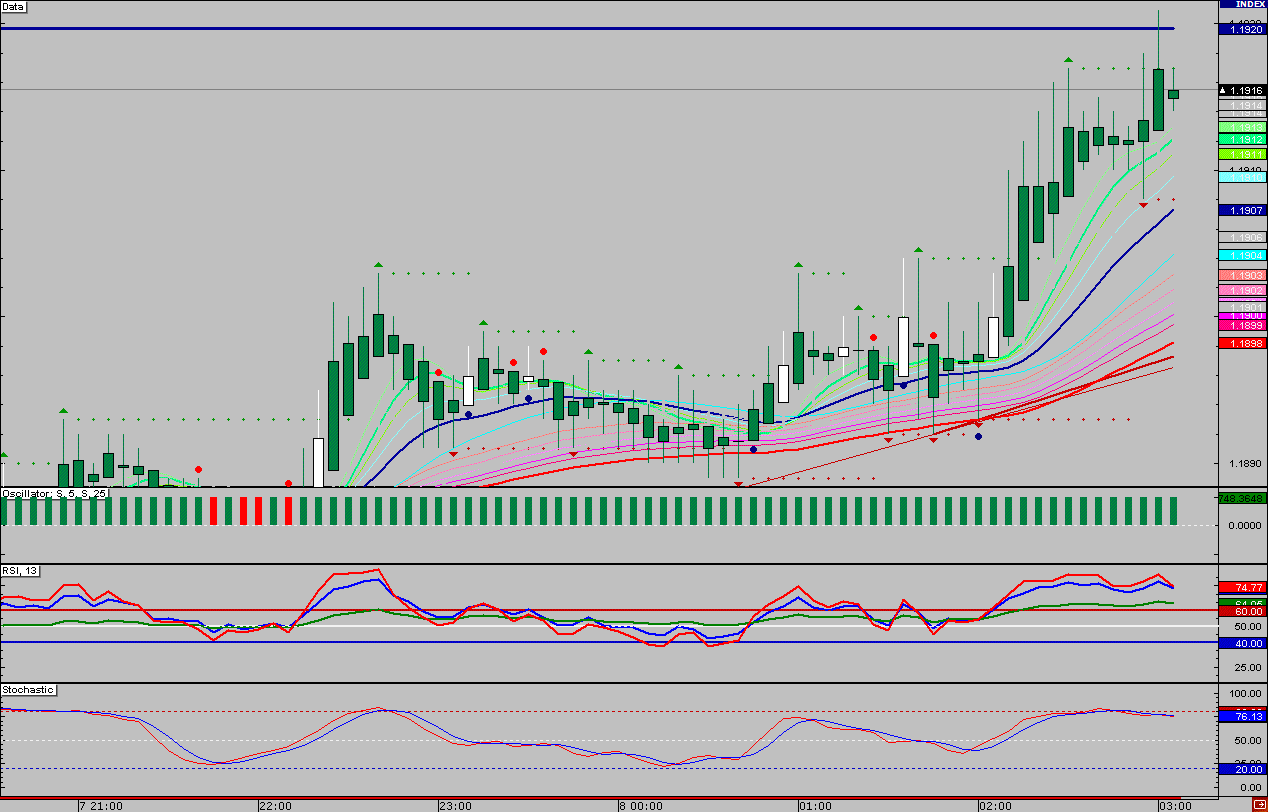
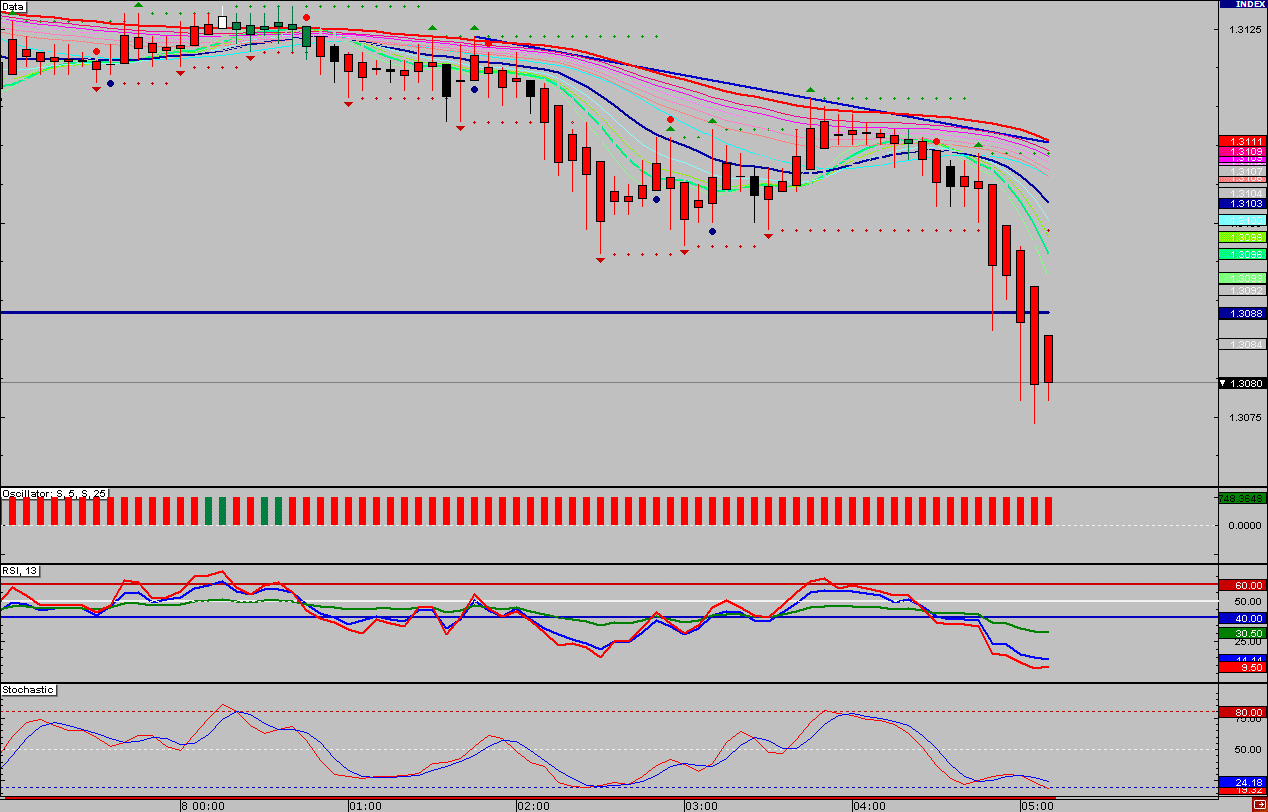
The lines on the chart look like a bunch of moving averages exponential set at intervals of periods getting wider as you go down.
apparently here
http://online-income.net-investors.com/index.php?option=com_ezstore&Itemid=47&func=detail&id=2
can't say i've heard any bad comments from anyone about it..but I don't know anyone who's purchased it yet
the big blue and red dots and smaller dot lines have something to do with entry and exit also
someone is using this system and saying it's Very GOOD..of course they are selling the system..just wondered if anyone can decipher the indicators.
1 graph..
i have seen something similar to this what about guppy moving average?
People make an average of 100 - 300 pips a day using this system. This would be a pearl if we figure it out. I think I can confirm the guppy method as people were talking about it in the chats. Here are more screenshots from this system :
-----------------------------------------------------------------------------------------------------------------------
-----------------------------------------------------------------------------------------------------------------------

-----------------------------------------------------------------------------------------------------------------------
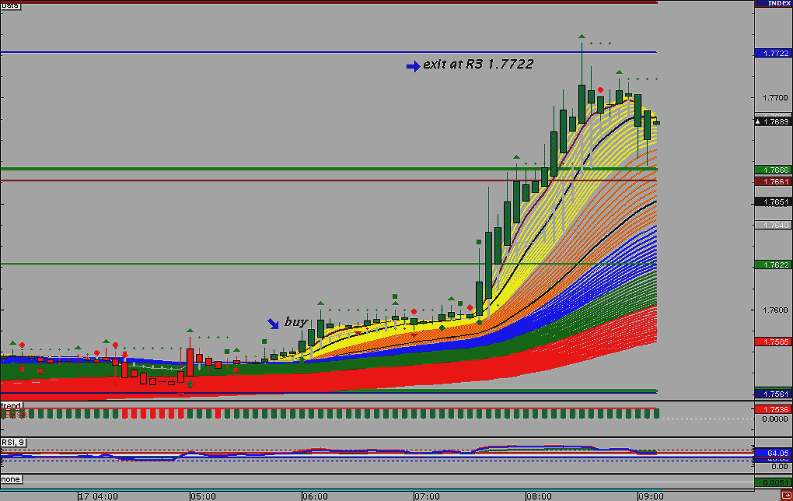
Here is the latest screenshot from April of 17:
Gbpusd move from the pivot point 1.7561 to 1.7722
Entry for the day using the system was 1.7584 exit was 1.7722 total was 138 pips
for a system to make 100-300 pips a day, the currency has to move at least that much...most currencies don't have that kind of range every day.
Ofcourse, but it's a great trend catching system. And if gbp/usd moves probably eur/usd will too. And what more could you need then if you make 200 alone with two pairs even every second day.
Edited for spelling mistake.
This is referred to "Gamma Ray" Trading. But I think this guy uses some other features to asertain at which point the candle sticks are open or close to pin point when to enter.
But even without those added features, adding several EMA's on your chart is goog enough to work from. So I wouldn't pay $200.00 for this when you can do it yourself by plotting those EMA's on your chart.
- Free trading apps
- Over 8,000 signals for copying
- Economic news for exploring financial markets
You agree to website policy and terms of use
someone is using this system and saying it's Very GOOD..of course they are selling the system..just wondered if anyone can decipher the indicators.
1 graph..