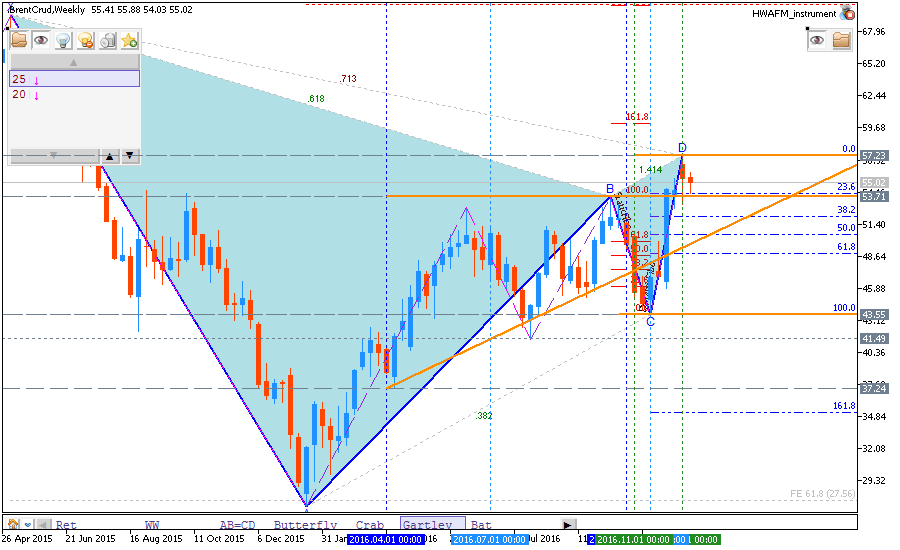
Forecast for Q1'17 - levels for Brent Crude Oil
Forum on trading, automated trading systems and testing trading strategies
Sergey Golubev, 2016.12.24 17:05
Oil Q1 2017 Forecast - The Real Power of OPEC Will Be Revealed in Q1 2017 (based on the article)
Fundamental Analysis
- "For traders who like to simplify the markets to a game of supply vs. demand, the Oil market in Q1 2017 should be their World Cup. Heading into the New Year, the OPEC and non-OPEC members will cut supply to the agreed upon amounts. Given this intent, the International Energy Agency (IEA) says recent OPEC action would place the Oil market into a supply deficit. The deficit would be engineered on a mixture of consistent demand combined with OPEC and other producers following through on their pledge to cut supply starting January 1. The view of consistent demand has been supported by consistent inventory draws reported by the Department of Energy as forecasted inventory builds were repeatedly confronted with actual inventory draws in late 2016."
- "In Vienna, OPEC announced they anticipate ~600,000 fewerbarrels per day of production in H1, 2017. Along with this, the IEA also increased its forecast for global oil demand in 2017 by 100k bpd, stating consumption is likely to rise by 1.4% to 97.6 million barrels a day. In mid-December when non-OPEC producers like Russia, Mexico, and others aligned with OPEC to help balance the over-supply imbalance, Saudi Oil Minister Khalid Al-Falih said at the post-meeting press conference in Vienna that he is willing to cut the Saudi’s production even deeper than already promised. OPEC has agreed to reduce output by 1.2mn bpd from next year with Saudi cutting as much as 486k bpd."
- "Lastly, while many are looking for prices to move aggressively higher, it is worth noting OPEC is not specifically targeting higher price levels, but rather market balance. Therefore, we could see an increase in production if demand is anticipated to pick up or U.S. E&P’s are seen taking too much market share, which would limit the potential upside."
Technical Analysis
- "Crude oil price has been reacting positively to the 200 day simple moving average bouncing off the line twice during the previous quarter. This makes seven successful turns in the past 19 months with one failed pivot. Now that the moving average is trending higher, it will become more difficult for prices to hold above it. Do not be surprised to see a false break below this line in Q1."
- "The key level to watch for Bulls is around $40. Below there and the market is at risk of a greater sell-off. As long as prices are above $40, the door is open for sideways and possibly higher trade."
Forum on trading, automated trading systems and testing trading strategies
Sergey Golubev, 2016.12.30 06:06
Crude Oil Price Forecast: Early 2017 Volatility (based on the article)
- "We are now trading at the top of a channel drawn with the same slope as the support that we had been focusing on throughout the 2016 rebound and into 2017 (rising trendline in black on the chart above) drawn from the first higher low off the rebound from the February low. While we remain Bullish due to fundamental and technical factors, there is a rising wedge pattern developing that should warrant attention."
- "The rising wedge pattern has developed on the recent break into 17-month highs. Per the Daily Sentiment Index as of Wednesday’s close, the Crude market is composed of 75% Bulls, which remains well short of the 85% extreme Bullish sentiment reading that could mean there is a good deal more room to run in the market as 2017 gets underway. However, if the production cuts do not come to pass, it’s possible that the rising wedge could bring about a sharpsell-off that retraces (likely not all) of the recent 28% rally from the mid-November low."
"Should price fail to break the $50/51 support zone, we’ll expect an eventual move to the 2015 high in early 2017. Ichimoku also favors a Bullish continuation move."
Forum on trading, automated trading systems and testing trading strategies
Sergey Golubev, 2017.01.04 05:55
CRUDE OIL Short-Term Technical Analysis: intra-day ranging bullish or the secondary correction (adapted from the article)
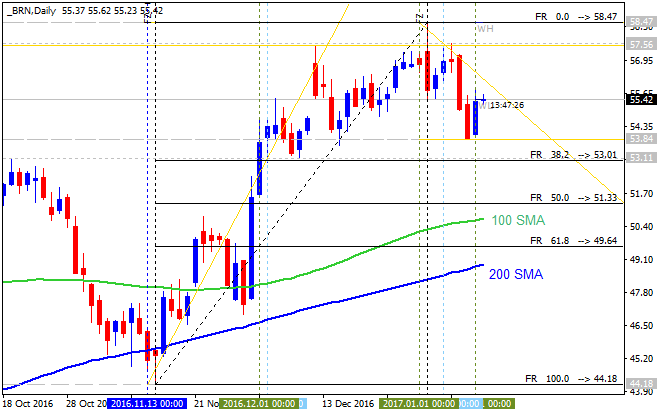
H4 price is located above 200 SMA with near and above 100 period SMA (100 SMA) on the border between the primary bullish and the secondary correction:
- the price was bounced from 58.47 resistance level to below with 55.42 support level to be testiing for the secondary correction to be started.
- "The oil market may have provided the first legitimate head fake in markets for 2017. At the beginning of Tuesday’s trading session, the first official trading day in 2017, as many markets were observing New Year's Day on Monday, Oil began trading to 18-month highs by trading above $55 a barrel. The initial move higher had credibility as OPEC’s deal compliance seemed to be coming to fruition on initial reports of firm’s production after the official start of the production cuts agreed to in Vienna in late November."
- "Shortly after midmorning trade, oil had completely reversed earlier gains and eventually closed nearly 3% lower on the day. The aggressive reversal aligned with the volatility pattern we mentioned in the late December article the discussed in developing rising wedge pattern that can either be in ending diagonal preceding sharp losses or a leading diagonal that would favor aggressive gains. Either way, volatility could be a mainstay in the energy market in January 2017."
- "Should the price continue to hold above this level on a closing basis, we will favor a move toward the top of the channel near $59/60 per barrel.Should a reversal develop in the price of Crude Oil, we would be on the watch for the price to break down through the rising support levels mentioned above at $49/45. Only a break below this zone would take us from Bullish to Neutral. Until then, we will favor eventual upside heading into 2017. Regardless, we will expect further volatility in this key market."
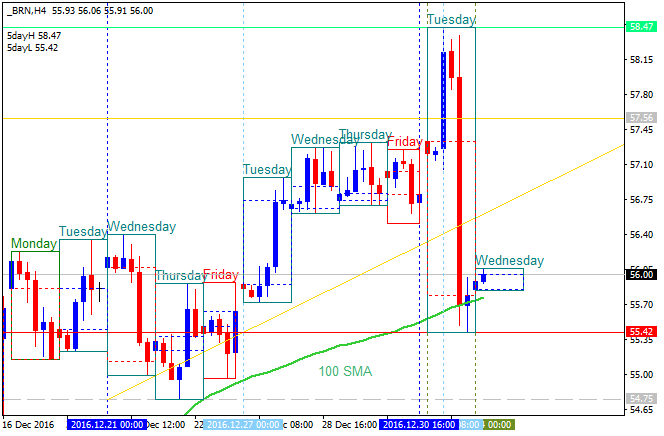
- If H4 price breaks 58.47 resistance level to above on close bar so the bullish trend will be resumed.
- If price breaks 55.42 support to below on close H4 bar so the secondary correction within the primary bullish market condition will be started.
- If not so the price will be ranging within the levels.
| Resistance | Support |
|---|---|
| 58.47 | 55.42 |
| N/A | 54.75 |
Forum on trading, automated trading systems and testing trading strategies
Sergey Golubev, 2017.01.04 12:01
2017 Energy Outlook: Must-Follow Sectors (based on the article)
OPEC:
"Market watchers will need to keep tabs on OPEC and non-OPEC monthly production decreases to see if key oil producers are adhering to their quotas under both the November OPEC production agreement and December OPEC/Non-OPEC production agreement."
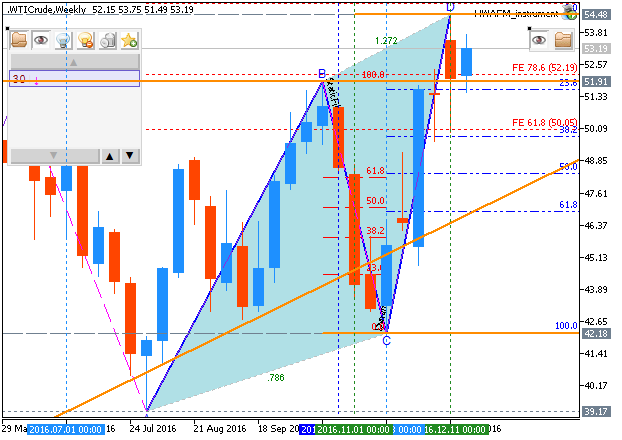
West Texas Intermediate Crude Oil: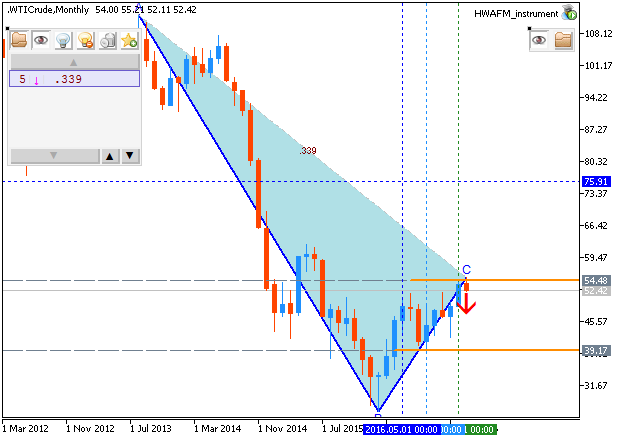
North American Oil Producers:
"2017 is not likely to see a roaring return to the exuberant shale oil production of 2012 and 2013. All eyes are currently on the hottest shale play right now, the Permian Basin in Texas. It is also important to keep tabs on the Bakken region in North Dakota."
Oil Services Firms:
"After two long years of contraction, companies that provide workers and equipment to oil and gas extraction companies will finally start expanding in 2017. This means oil services companies will gradually be restarting idled equipment and rehiring laid-off workers during 2017."
Forum on trading, automated trading systems and testing trading strategies
Sergey Golubev, 2017.01.05 18:26
U.S. Commercial Crude Oil Inventories news event: intra-day ranging bearish, daily ranging bullish
2017-01-05 16:00 GMT | [USD - Crude Oil Inventories]
- past data is 0.6M
- forecast data is -1.8M
- actual data is -7.1M according to the latest press release
[USD - Crude Oil Inventories] = Change in the number of barrels of crude oil held in inventory by commercial firms during the past week.
==========
"U.S. commercial crude oil inventories (excluding those in the Strategic Petroleum Reserve) decreased by 7.1 million barrels from the previous week."
==========
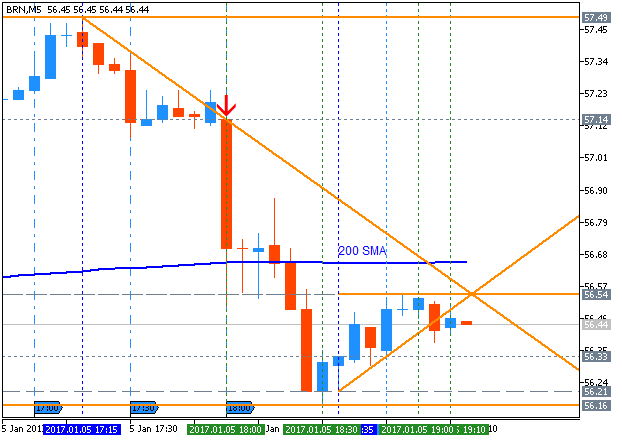
Crude Oil M5: ranging bearish. The price broke 200 period SMA for the breakout wqith the bearish reversal.If the price breaks 56.54 resistance level so the bullish reversal will be started.
If the price breaks 56.16 support so the bearish market condition will be resumed.
If not so the price will be on bearish ranging within the levels.
==========
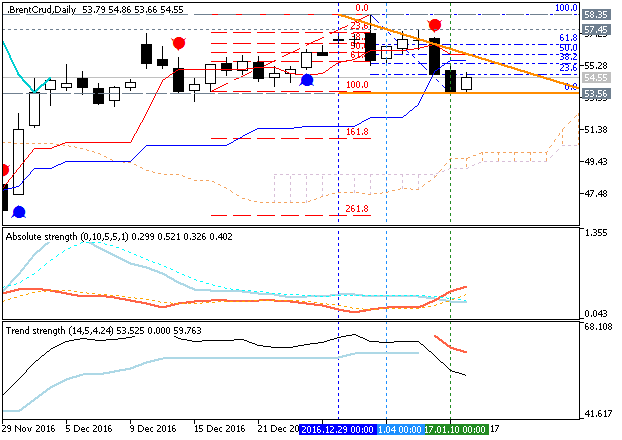
Crude Oil Daily: bullish ranging with 58.35 resistance level to be testing. The price is located above 100 SMA/200 SMA for the bullish are of the chart with 58.35 resistance level to be testing for the bullish trend to be continuing.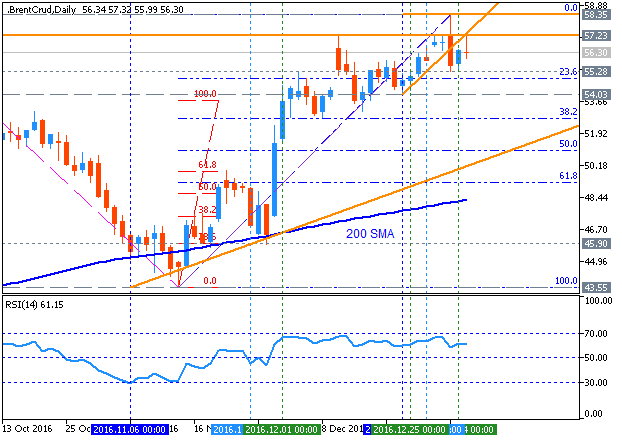
If daily price breaks 58.35 resistance on close daily bar so the primary bullish trend will be continuing.
If the price breaks 54.03 support level to below on close daily bar so the local downtrend as a secondary correction within the primary bullish trend will be started.
If not so the price will be on bullish ranging within the levels.
Forum on trading, automated trading systems and testing trading strategies
Sergey Golubev, 2017.01.07 05:41
Weekly Outlook: 2017, January 08 - January 15 (based on the article)
The US dollar wobbled in the wake of 2017, torn between good and bad news. US Retail sales, consumer sentiment and PPI stand out. These are the highlights for this week.

The US monthly employment report showed a lower than expected job growth in December but wages registered a 2.9% annualized gain. The economy added 156,000 positions while expected to increase 175,000. The unemployment rate edged to 4.7% from 4.6%. However, wage growth was the most significant factor in December’s report as average hourly wages jumped 10 cents to $26, the highest gain since 2009, indicating the US labor market has fully recovered. The final report of 2016 also comes amidst a presidential transition period. Donald Trump has promised aggressive fiscal measures including tax cuts and higher domestic spending to boost economic growth beyond the mild expansion witnessed so far.
- US Crude Oil Inventories: Wednesday, 15:30. Oil prices increased as Saudi Arabia consented to OPEC’s plea to reduce output after prices fell on Us data.
- US Unemployment Claims: Thursday, 13:30. Economists expected a higher reading of 262,000.
- US Retail sales: Friday, 13:30.
- US PPI: Friday, 13:30.
- US UoM Consumer Sentiment: Friday, 15:00. Economists expected a milder rise to 94.3.
Forum on trading, automated trading systems and testing trading strategies
Sergey Golubev, 2017.01.11 16:54
U.S. Commercial Crude Oil Inventories news event: intra-day ranging near and above 200 SMA, daily correction to be started with 53.86 to be broken to below
2017-01-11 15:30 GMT | [USD - Crude Oil Inventories]
- past data is -7.1M
- forecast data is 0.9M
- actual data is 4.1M according to the latest press release
[USD - Crude Oil Inventories] = Change in the number of barrels of crude oil held in inventory by commercial firms during the past week.
==========
"U.S. commercial crude oil inventories (excluding those in the Strategic Petroleum Reserve) increased by 4.1 million barrels from the previous week."
==========
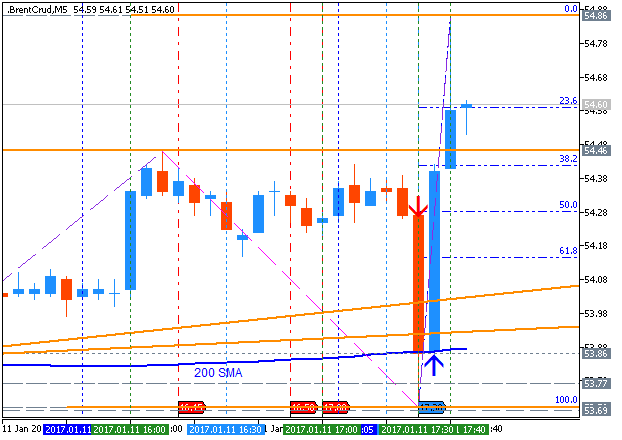
Crude Oil M5: ranging. The price was on breakdown by trying to cross 200 period SMA to above for the intra-day bearish reversal but it was bounce from 200 SMA value at 53.86 to above for the ranging condition to be started.If the price breaks 54.86 resistance level to above so the bullish trend will be resumed.
If the price breaks 53.86 support so the bearish reversal will be started.
If not so the price will be on bearish ranging within the levels.
==========
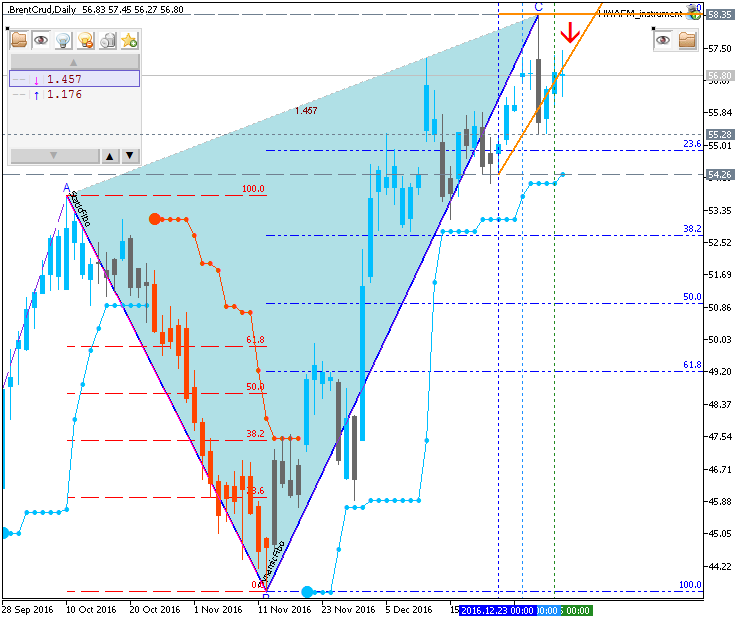
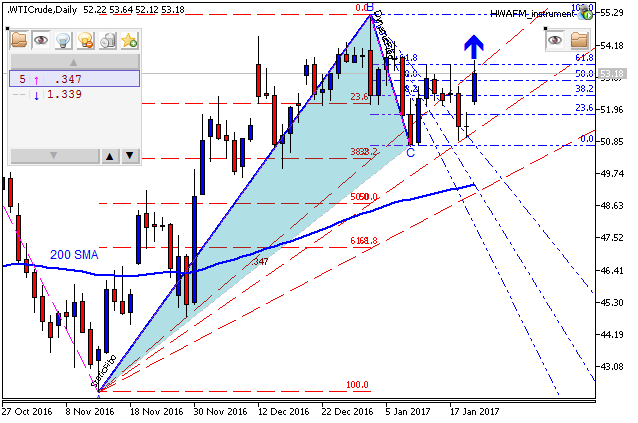
Crude Oil Daily: daily correction to be started with 53.86 to be broken to below.
The price is located above Ichimoku cloud in the bullish area of the chart with the secondary correction to be started by 53.86 support level to be testing to below for the correction to be continuing. Descending triangle pattern was formed by the price to be broken to below for the possible good breakdown, Trend Strength indicator and Absolute Strength indicator are evaluating the future possible trend as the secondary correction.
If daily price breaks 58.35 resistance on close daily bar so the primary bullish trend will be resumed.
If the price breaks 53.86 support
level to below on close daily bar so the local downtrend as a secondary
correction within the primary bullish trend will be continuing.
If not so the price will be on bullish ranging within the levels.
Forum on trading, automated trading systems and testing trading strategies
Sergey Golubev, 2017.01.12 09:15
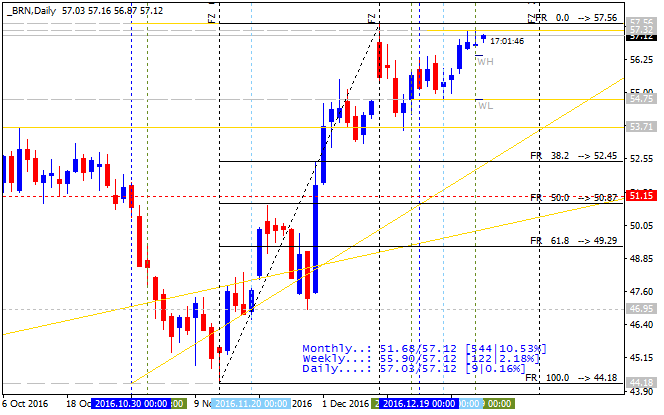
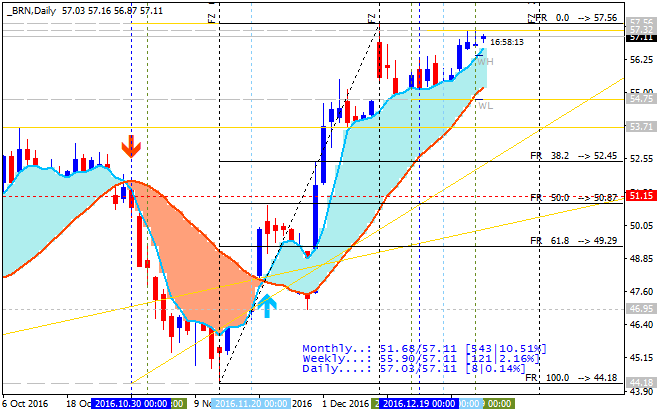
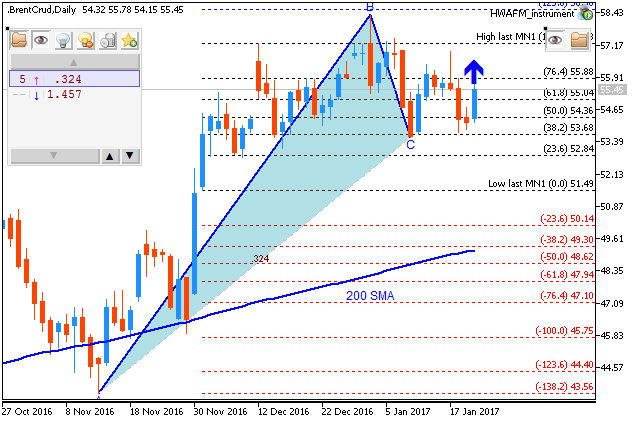
Brent Crude Oil Daily: oil prices surged more than 3% today, lifting Brent crude futures back above $55 a barrel (based on the article)
Daily price is located above 100-day SMA/200-day SMA reversal levels in the bullish area of the chart. The price was bounced from 53.84 support to above for the bullish trend to be continuing and with 57.56 nearest daily target. Descending triangle pattern was formed by the price for the good possible breakdown with the secondary correction, but today's daily bar was opened above psychological level at 50.00 so the continuing of the bullish trend is very likely in this situation.
- "Oil prices surged more than 3% today, lifting Brent crude futures back above $55 a barrel despite data that U.S. stockpiles of crude oil and gasoline swelled last week and U.S. oil production rose."
- "Rather, investors appeared focused on signs that Russia and Saudi Arabia planned to hold to promised production cuts."
- "U.S. crude futures rose $1.77 or 3.5%, to $52.59 a barrel on the New York Mercantile Exchange. Brent, the global benchmark, rose $1.89, or 3.5%, to $55.53 a barrel on ICE Futures Europe."
Forum on trading, automated trading systems and testing trading strategies
Sergey Golubev, 2017.01.21 10:26
Weekly Outlook: 2017, January 22 - January 29 (based on the article)
The US dollar was mixed as Donald Trump entered the White House. Apart from Trump’s first week as President, we have some interesting publications: US and UK GDP, durable goods orders from the US and more These are the highlights of this week.
- Mario Draghi speaks: Sunday, 23:00. ECB President Mario Draghi will speak in Torino.
- German Ifo Business Climate: Wednesday, 9:00. Business climate is expected to rise to 111.3 this time.
- US Crude Oil Inventories: Wednesday, 15:30.
- UK GDP data: Thursday, 9:30. The fourth quarter growth rate is expected to reach 0.5%.
- US Unemployment Claims: Thursday, 13:30. The number of new claims is expected to reach 247,000 this week.
- US GDP data: Friday, 13:30. US economy is expected to expand by 2.1% in the fourth quarter of 2016.
- US Durable Goods Orders: Friday, 13:30.Durable goods orders for December are expected to rise 2.7%, while core orders are expected to gain 0.5%.
- Free trading apps
- Over 8,000 signals for copying
- Economic news for exploring financial markets
You agree to website policy and terms of use
Brent Crude Oil January-March 2017 Forecast: bullish ranging within 53/57 levels waiting for direction
Weekly (W1) price is located above Ichimoku cloud in the bullish area of the chart. The price is on ranging within the following support/resistance levels:
Chinkou Span line is located above the price indicating the ranging condition to be continuing in the near future for example.
Trend:
W1 - bullish ranging