Best method to identify trend in forex
Hi guys, I just start a trading discussion about what the best method to identify trend. We know there are three type of trend:
1. Up Trend 2. Down Trend 3. Sideway.
How we identify Trend?
Thanks in Advanced.
The easy way is use , pattern , sr, zz, and couple of news .
Hi guys, I just start a trading discussion about what the best method to identify trend. We know there are three type of trend:
1. Up Trend 2. Down Trend 3. Sideway.
How we identify Trend?
Thanks in Advanced.
Hi guys, I just start a trading discussion about what the best method to identify trend. We know there are three type of trend:
1. Up Trend 2. Down Trend 3. Sideway.
How we identify Trend?
Thanks in Advanced.
If you want to start a discussion, maybe it would be better to give your method or idea.
My best strategy to trade the trend is Ichimoku.That's a good way to determine the direction of the market.
I'm working with and it gives good opportunities.
Indentifying the trend depends on the analyzed timeframe,
for the D1 timeframe the 200 EMA can be used:
- if the 200 EMA slope is up and the price action is on the upper side of the EMA => uptrend
- if the 200 EMA slope is down and the price action is on the lower side of the EMA => downtrend
I mention the daily chart because it shows the important trend,
on lower timeframes you could take as a trend what is only a correction of the trend on the daily.
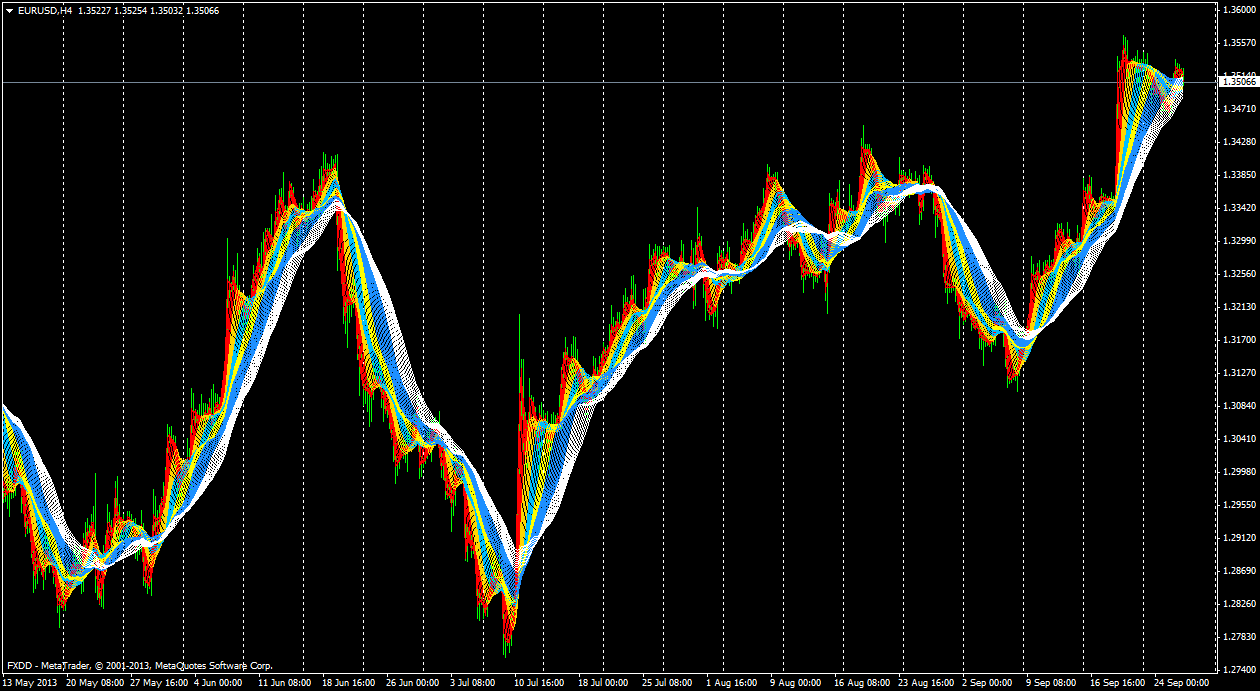
Here is the sparing partner if looking for MA when it tranding the price will push out from the ribbon , the ribbon color reprecent the s & r and the price it self has it own s & r .
When price get loomed in side the ribbon get out soon or dont get in to the muddy water . test it at 4 h see if can be identify , not that hard to look how it work and where it goes .
Each time frame has it own nuace and caracter be be learn , as far as it goes , thats never been any beter indicator more then price it self .
Candlestickis theonly way that can be easy read pattren , tf loweer better the sl will be muh smaller unless the account has better breeding , in with a reason out with a reason ...
scalper need lots of stamina , day trader need alots of thinking , possition trader even worse of stamina draining , unless ( dont mind miss or hit ) got some farm to bet .
There is the thread about it with some indicators and so on - Market Condition Evaluation :
1. Trend following
1.1. Primary trend
- Uptrend (bullish)
- Downtrend (bearish)
1.2. Secondary trend.
- Correction
- Bear Market Rally
- Flat (non-trading)
- Ranging
2. Overbough/oversold ('top-and-bottom')
3. Breakout
- Free trading apps
- Over 8,000 signals for copying
- Economic news for exploring financial markets
You agree to website policy and terms of use
Hi guys, I just start a trading discussion about what the best method to identify trend. We know there are three type of trend:
1. Up Trend 2. Down Trend 3. Sideway.
How we identify Trend?
Thanks in Advanced.