Help with Multi Timeframe Analysis
Its best to trade when both EMA and MACD have the same direction. If you find momentum is growing in MACD and EMA is also up in daily chart, wait for such setup in hourly charts and then trade in direction of the major trend.
MACD suggests the strength of the trend where EMA suggests the direction of the trend. If they suggest opposite direction, check the trend lines to identify the major trend.
Hi Laurel,
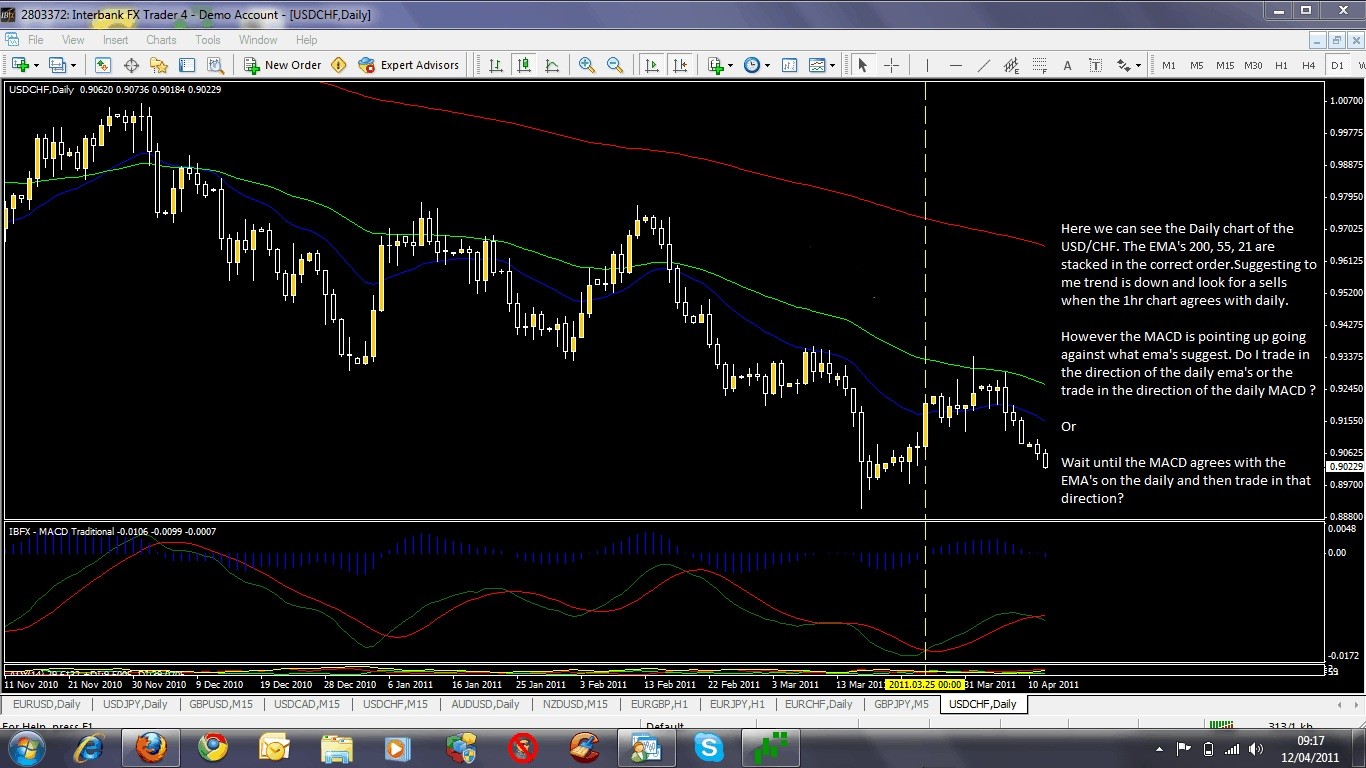
Heres a picture of the USD/CHF daily chart. As you can see from the ema's are all stacked in the correct order suggesting a downtrend, however from the yellow line the MACD is poining in the the opposite direction to the ema's. Should I ignore this and still look for shorts or do I trade in the direction of the MACD.
Or
Wait until the MACD and the ema's on the daily all agree in the same direction
Many thanks for your help
hitting the wall..........
here is an example in 3 time frames of hitting the fib and ema walls at the same time .
s

your example is a down trend
lower highs and lower lows
macd will cross on the price move back toward the moving averages.
the price move away from the moving averages is what you want to catch also.
the transition zone......... when trend is changing....
is where most do not see the change over to higher highs and higher lows et al.
learn to trade as price moves away from a moving average line in the direction of the main trend.
this is called sling shotting.
cheers,
s
- Free trading apps
- Over 8,000 signals for copying
- Economic news for exploring financial markets
You agree to website policy and terms of use
Hello fellow traders.
I wondered whether someone could unlock my dilema about MTF analysis?
I use the following indicators.
200 ema
21 ema
55 ema
MACD set to default settings.
Timeframes:
Daily
1 hour
15 min
1. Look for trend on daily chart. Downtrend is when 21 ema is below 55 ema and both below 200 ema. And uptrend is when 21 ema above 55 ema and both above 200 ema.
2. The ema's on the 1 hour should agree with what the daily chart is doing.
3. Entry would be off the 15 min chart in direction of the overall trend.
This is where I get confused......
For example on the daily chart the ema's are stacked in the correct order for an uptrend, I would be looking for possible "buys" providing the ema's on the 1 hour chart are stacked in the correct order for an uptrend as the daily suggests.
My Question is, what should I do in the above example if the MACD is pointing down on the daily chart but the ema's are pointing up? On the 1 hour chart should I be looking for trades in the direction of daily MACD or the ema's?
Or
Should I wait until the daily MACD points back up to be the same direction as the daily ema's before I look for trades once the 1 hour chart agrees with the daily?
Thanks for any help you can give me.