overlay ema from different pairs
I assume you want to see correlations ecc.
Scaling the ma itself is possible, but for my correlation analysis i use something different.
I use a the price distance from the moving average as index, also the values from the MACD of both seems more significant to me then the moving averages itself.
Scaling is always a bit tricky, since two symbols might have a total different moving range at first you need to filter those out. Maybe (MA(EURCAD)/ATR(EURCAD))*ATR(EURUSD) adjusts these speed differences. Another problem is that you need to scale the price differences. There might be the need of selecting a startdate, where you assume that both MA's should be the same.
I have attached my MA-correlation indi, maybe it gives you an idea of how to use MA's of different symbols.
this is probably exactly what I am looking for... but I'm not perfectly sure exactly what I am looking at.
I put this on a chart using EURUSD and ERUCAD.
Do I assume, when the green and red lines of the indicator diverge, I sell the upper and buy the lower? Since they will converge, and that is where I would take the collective profit.
The 50 period looks exactly like the price. Why are you using a 5 period? What exactly do you do with this indicator? How do you use it to trade?
What I was doing, (and your indicator may be much better), was comparing the price distance of pair 1 from its 100 ma, to the price difference from pair 2 and it's 100 ma. when the divergence gets to a certain point, I buy this low one and buy the low one. I figure they will always come back to their ma... I just wanted to know how their ma's move respective to each other, so I don't get hung out with 2 orders that never get close enough to each other to produce a collective profit.
I am very new at Forex, and newer at programing, (completely self taught) but I am having a blast doing it.. .and I really appreciate this forum and everyone that is so willing to help me.
Hi,
the 5 period is only a standard setting, i traded with this setting on a h1 chart. The biggest problem here is that this indicator doesn't show the whole story, i combined this with an indicator which shows the slope of both ma's to make sure they really correlate. The signal was, as you said, buy the lower and sell the higher when the difference reaches a 'maximum'.
The idea was to create something like the Fractional Product Inefficiency, my hope was that if i can trade bigger differences because unfortunatly the FPI requires very tight spread and at best case execution of multiple orders simultaneos. -> http://www.forexfactory.com/showthread.php?t=10517
I have traded this only for a very short time. I should let run an EA for a while to see how it works in the long run.
If you set the period to 100 it will be the same as you said, it compared the price distance from the ma.
add: the above link is wrong i cannot find the right at the moment
Ive heard of arbitrage, and I bought an ea for a program that supposedly took advantage of brokers having different prices listed... that ea cleaned out 2 accounts in short order... worked so fast I couldn't stop it fast enough... so I stay away from that... the Arbitrage idea sounds great, but I'm not smart enough to put together something that actually works.
But, when 2 sets of pairs move together most of the time, I think I can program something to look for the divergences. I am just looking for the right indicator to measure it by... I'm thinking your ma indicator above just may be the ticket. I will have to play with that for a bit.
Why do you trade the pairs you do? I noticed they are different than what I am looking at. I am so far doing all my testing on EURUSD and EURCAD.
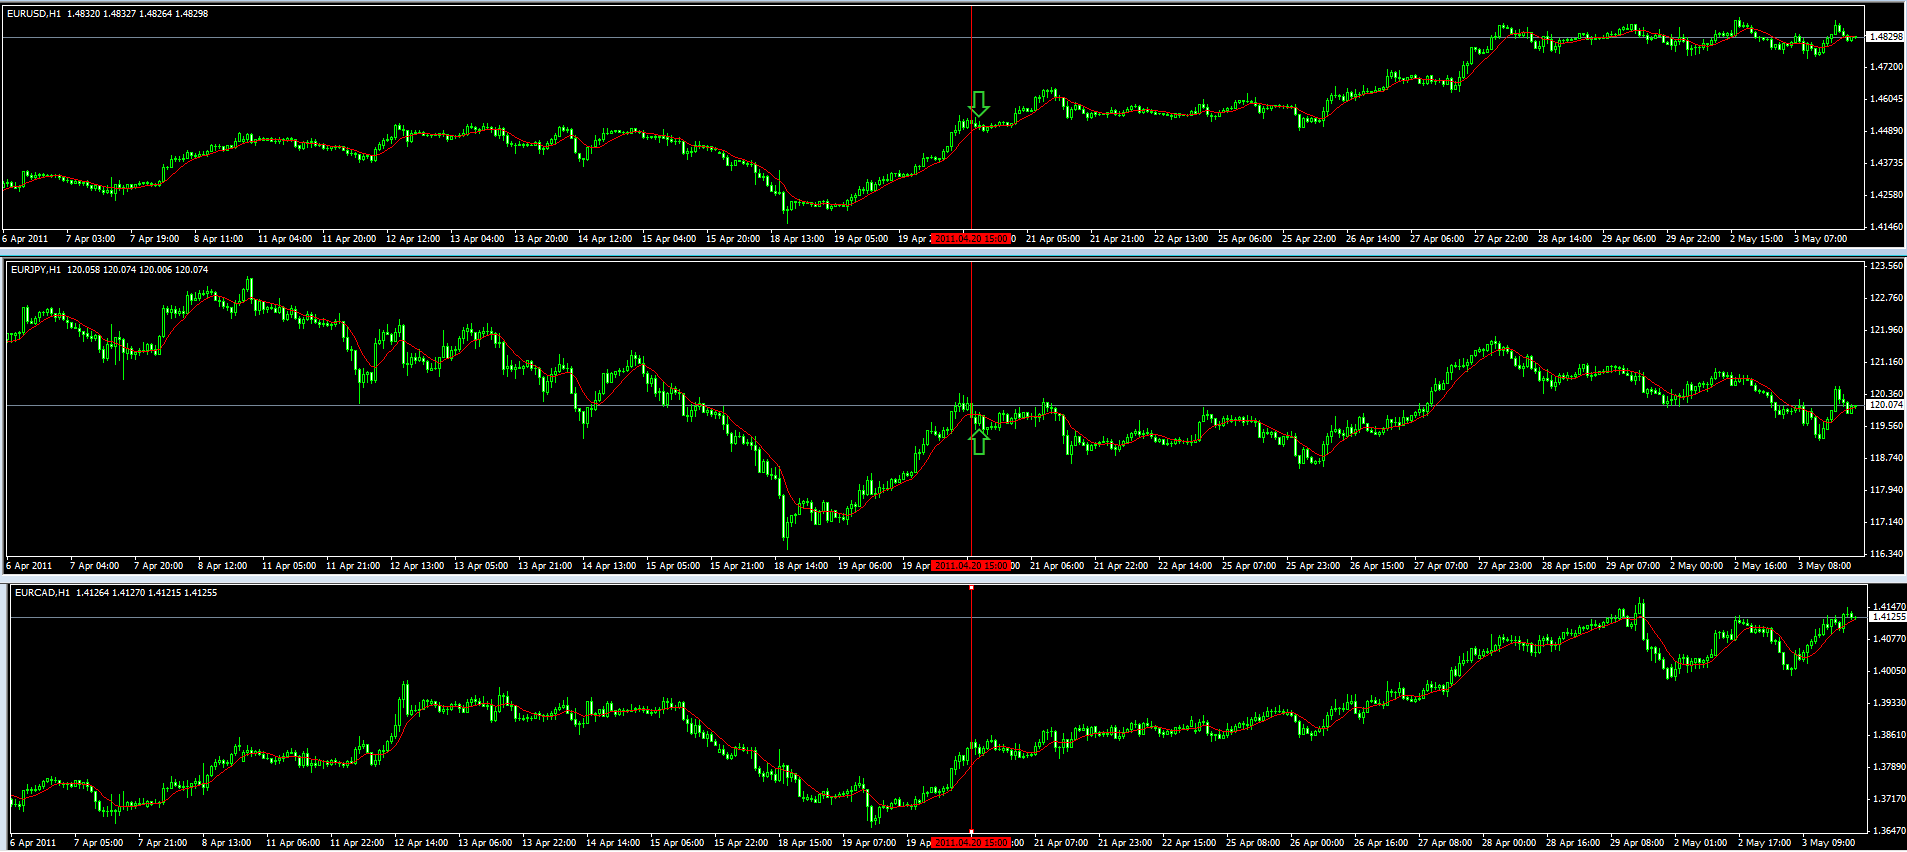
EURUSD and EURJPY seems to moving very similar for me. The goal was to trade small differences on two pairs which normally moves the same.
look at the candle after the red line. Eurjpy closes below the MA and eurusd above it's ma. At the open of the next candle the plan was to go long with eurjpy and short with eurusd, Of course the position of the eurjpy must be smaller since it moves faster. But that was the idea.
How do you account for the price per? there is such a huge difference.... 119+ to 1.48+
I was looking at those too.... but I was looking at if they were both above or below their 100 ma, you should still be able to calculate the divergence, but I can't wrap my brain around it with such a difference in price.
I guess that is why I am stuck on EURUSD and EURCAD... I am starting to look at AUDUSD, because they have the same number of decimals, and are MUCH closer in price than the JPY.
I am comparing only 2 charts, you seem to be comparing 3... why is that?
Thanks for your dialog.
Ah, i did attache the EURCAD to see why you are using this one. For calculating the difference i use the distance in points. I have checked the indicator i have attached previously. You have to change the two lines with these two:
      b1[i]=(iClose(s1,Period(),i)-iMA(s1,Period(),period,0,MODE_SMA,PRICE_CLOSE,i))/MarketInfo(s1,MODE_POINT);
      b2[i]=(iClose(s2,Period(),i)-iMA(s2,Period(),period,0,MODE_SMA,PRICE_CLOSE,i))/MarketInfo(s2,MODE_POINT);
Now distance is point based and the absolute values do not matter. Another possibility would be to use a percentage based value. But for my quick tests this was enough.
OK... not to be dense... and I appreciate your dialog...
so, I changed the code... this is what I get with EURUSD and EURCAD. see the attached file. (I don't know how to insert into the text like you did)
Look at 3 May 23:05... actually just shortly after that. The red takes a much bigger jump up than green.
Look at 3 MY 23:35 red takes a much bigger drop than green.
Are these sell/buy opportunities?
Using my current model, and changing to this indicator, I would sell red and at the same time buy green at the 23:05... actually about 23:10. Conversely, I would buy red and sell green at 23:35.
I know they are both above the zero line in the first instance, and below in the next.
I know they both go down for a while on the first instance, and both go up on the second... but it is the convergence where I want to make money... kind of a hedging strategy.
I haven't played with this enough to know just exactly how much spread would be profitable...
Any thoughts?
- Free trading apps
- Over 8,000 signals for copying
- Economic news for exploring financial markets
You agree to website policy and terms of use
is it possible to overlay the moving average from 2 sets of pairs into one chart?
example, I would like to overlay the 200 ema for EURUSD and EURCAD (and others) so I can
see how their history related.