Press review - page 182
You are missing trading opportunities:
- Free trading apps
- Over 8,000 signals for copying
- Economic news for exploring financial markets
Registration
Log in
You agree to website policy and terms of use
If you do not have an account, please register
2014-06-17 12:30 GMT (or 14:30 MQ MT5 time) | [USD - CPI]
if actual > forecast = good for currency (for USD in our case)
[USD - CPI] = Change in the price of goods and services purchased by consumers. Consumer prices account for a majority of overall inflation. Inflation is important to currency valuation because rising prices lead the central bank to raise interest rates out of respect for their inflation containment mandate.
==========
U.S. Consumer Prices Rise More Than Expected In May
Consumer prices rose by more than expected in the month of May, according to a report released by the Labor Department on Tuesday, with the increase reflecting broad-based price growth.
The Labor Department said its consumer price index rose by 0.4 percent in May after climbing by 0.3 percent in April. Economists had expected the index to edge up by about 0.2 percent.
Core consumer prices, which exclude food and energy prices, increased by 0.3 percent in May after rising by 0.2 percent in the previous month. Core prices had also been expected to tick up by 0.2 percent.
2014-06-18 00:00 GMT (or 02:00 MQ MT5 time) | [AUD - CB Leading Index]
if actual > forecast = good for currency (for AUD in our case)
[AUD - CB Leading Index] = Change in the level of a composite index based on 7 economic indicators. This index is designed to predict the direction of the economy, but it tends to have a muted impact because most of the indicators used in the calculation are released previously
==========
Australia Leading Index Dips 0.1% In May - Conference Board
A leading economic index for Australia eased 0.1 percent in April, the latest survey from the Conference Board revealed on Wednesday.
The headline figure follows the upwardly revised 0.2 percent increase in March (originally flat) and the 0.5 percent gain in February.
Among the individual components of the survey, building approvals and rural good exports were down, while the sales to inventories ratio, yield spread, money supply, gross operating surplus and share prices all were higher.
The Conference Board LEI for Australia has been on an upward trend since the middle of 2009, although its six-month growth rate has moderated in recent months.
The six-month growth rate of the leading economic index was 2.5 percent (about a 5.0 percent annual rate) from October 2013 to April 2014, higher than its growth of 1.1 percent (about a 2.3 percent annual rate) for the previous six months. The strengths among the leading indicators still outweigh the weaknesses, the board said, with six out of seven components advancing over the past six months.
The coincident index added 0.2 percent in April following the revised 0.3 percent gain in March and the 0.4 percent increase in February.
All four of its components continued to advance over the last six months. With April's gain, the coincident economic index grew by 1.6 percent (about a 3.3 percent annual rate) in the six-month period through April 2014 - significantly higher than the 0.2 percent (about a 0.5 percent annual rate) in the previous six months.
Meanwhile, real GDP increased at a 4.5 percent annual rate in the first quarter of 2014, an improvement from 3.2 percent (annual rate) in the fourth quarter of 2013.
Taken together, the current behavior of the composite indexes suggests that economic expansion will continue in the near term.
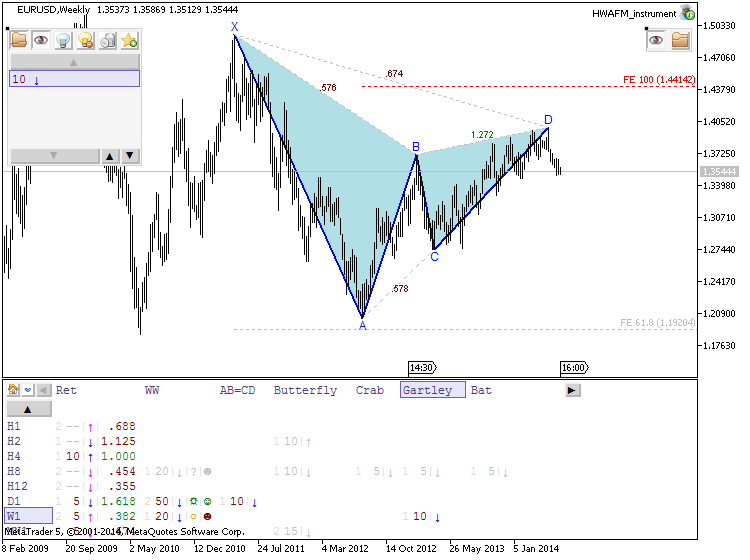
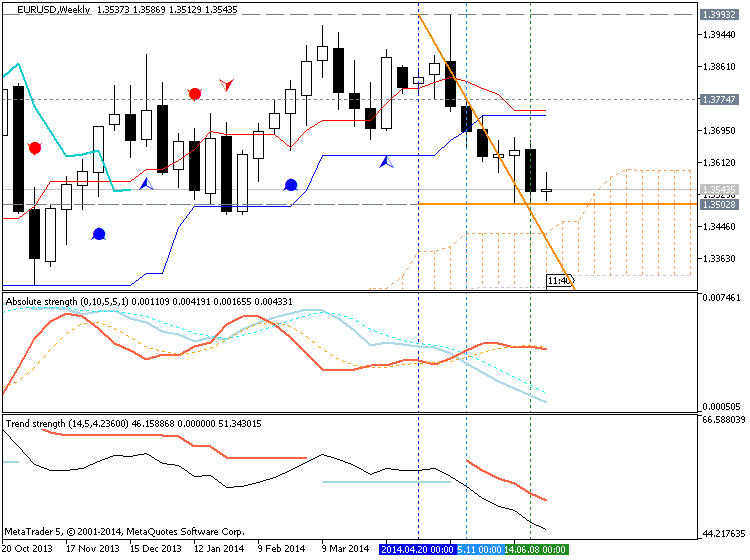
EUR/USD Technical Analysis – Looking for Drivers Above 1.35 (adapted from dailyfx article)
The Euro is treading water as prices digest recent losses against the US Dollar that brought the pair to a four-month low. Near-term support is seen in the 1.3476-1.3502 zone, an area bracketed by lows from June 5 and February 3. Initial resistance is in the 1.3574-85 area, marked by the May 29 low and the 14.6% Fibonacci expansion. A break above that on a daily closing basis opens the door for a challenge of the 23.6% level at 1.3618.
USD/CAD Forecast June 18, 2014, Technical Analysis
The USD/CAD pair rose during the course of the session on Tuesday, but found enough in the way of resistance above to pull back down and form a shooting star. The shooting star signifies that the market will probably continue to fall from here, but there is a significant amount of support below at the 1.08 handle. It is not until we clear that area to the downside that we can start selling, aiming for the 1.06 handle. On the other hand, if we break the top of the range from the Monday session, we would be confident enough to start buying again and aim for the 1.0950 level.
Forex Trading Guide: New Zealand GDP
Aside from the major central bank happenings this week, another top-tier event in the form of the New Zealand GDP release is scheduled to take place. Here’s my forex trading guide for this economic event.
What is the report all about?As you’ve learned in the School og Pipsology lesson on Economic Reports, the GDP (gross domestic product) release is one of the must-watch market events. Think of it as the report card for the economy, indicating whether the country performed strongly or poorly across various sectors and summing up these grades into one neat figure.
For New Zealand, this particular release could determine if the RBNZ will keep up its pace of monetary policy tightening. Recall that the central bank already hiked rates three times this year, and market watchers are very interested to find out if more tightening moves are in the cards.
What is expected for this event?
How could NZD react?For the first quarter of 2014, New Zealand is expected to have grown by 1.2% – a faster pace of expansion compared to the previous quarter’s 0.9% GDP reading. This could be crucial in setting the tone for interest rate expectations, as consistent economic growth could be enough to assure traders that the RBNZ will stay hawkish.
A weaker than expected reading might lead to a Kiwi selloff, similar to what happened in March when New Zealand released its Q4 2013 GDP figure.
NZDUSD M5 : 33 pips price movement by NZD - GDP news event:
Prior to the actual release, price moved mostly sideways then made a strong downside break upon seeing weaker than expected data. It didn’t help that the previous period’s reading was downgraded from an initially reported 1.4% growth figure to just 1.2%. NZD/USD consolidated for the next few days though, keeping its head above the .8500 major psychological support as traders were still hopeful that the RBNZ would keep hiking interest rates.
Another weaker than expected reading for the first quarter of 2014 might lead to a quick Kiwi selloff, with major support levels still likely to hold as the RBNZ has emphasized that it is not done tightening monetary policy. A stronger than expected figure, on the other hand, could lead to a strong rally and encourage more traders to jump in the long Kiwi bandwagon.
Trading the News: Federal Open Market Committee Meeting and Federal Funds Rate (based on dailyfx article)
Despite expectations for another $10B reduction in the Federal Open Market Committee’s (FOMC) asset-purchase program, the central bank’s updated forecasts (growth, inflation & interest rate) may have a greater impact in driving the U.S. dollar as market participants weigh the outlook for monetary policy.
What’s Expected:
Why Is This Event Important:
Indeed, there’s limited scope of seeing a material shift in the Fed’s policy outlook as Chair Janet Yellen remains reluctant to normalize monetary policy, and the interest rate decision may spur a bearish dollar reaction (bullish EUR/USD) should we get more of the same from the central bank.
Sticky inflation paired with the ongoing improvement in the labor market may encourage the FOMC to soft its dovish tone for monetary policy, and the fresh developments coming out of the central bank may generate a bullish outlook for the dollar should we see a greater dissent within the committee.
However, the slowdown in the housing market along with the dismal 1Q GDP reading may push the FOMC to lower its fundamental projections for the U.S. economy, and the updated forecasts may heighten the bearish sentiment surrounding the greenback should the calculations drag on interest rate expectations.
How To Trade This Event Risk
Bullish USD Trade: FOMC Cuts Another $10B & Shows Greater Willingness to Normalize
- Need red, five-minute candle following the release to consider a short EUR/USD trade
- If market reaction favors a long dollar trade, short EUR/USD with two separate position
- Place stop at the near-by swing high/reasonable distance from entry; look for at least 1:1 risk-to-reward
- Move stop to entry on remaining position once initial target is hit, set reasonable limit
Bearish USD Trade: Fed Continues to Highlight Dovish Tone for Monetary Policy- Need green, five-minute candle to favor a long EUR/USD trade
- Implement same setup as the bullish dollar trade, just in opposite direction
Potential Price Targets For The Rate DecisionEUR/USD Daily
- Sideways Price Action in Focus as EUR/USD Holds Monthly Range
- Interim Resistance: 1.3650 (78.6% expansion) to 1.3670 (61.8% retracement)
- Interim Support: 1.3490 (50.0% retracement to 1.3500 Pivot
Impact that the FOMC Interest Rate Decision has had on EUR/USD during the last release1 Hour post event
(End of Day post event)
2013-09-18 18:00 GMT (or 20:00 MQ MT5 time| [USD - Federal Funds Rate] :
As expected, the Federal Reserve cut its asset purchase program by $10B in April leaving the total monthly purchase total to $45B per month, but pledged to keep rates on stay on hold for a considerable period of time even after its quantitative-easing (QE) program comes to an end. The relatively dovish tone for monetary policy dragged on the greenback, with the EUR/USD spiking to a high of 1.3875, but the market reaction was short-loved as the pair ended the day at 1.3864.
ECB says forex benchmark rates compiled on too narrow basis

The European Central Bank said in a briefing paper on Wednesday that benchmark foreign exchange rates are not necessarily reliable as they are often fixed using just one set of data.The European Union is in the process of approving a law to regulate market benchmarks after banks were fined for rigging the London Interbank Offered Rate or Libor, an interest-rate benchmark. Global regulators are looking into similar allegations involving banks in the currency markets.
The ECB's view carries weight as the central bank is due to become the euro zone's main banking regulator from November.
In the briefing paper dated June 18, the bank cited market participants as saying that the risk of manipulation of FX benchmark rates comes from improper trading behaviour rather than from weaknesses in how the rates are compiled.
The ECB appeared to focus more on the latter point, however.
"While, in principle, arbitrage across platforms should ensure the conformity of the pricing available on each of them, the fact that the FX benchmarks are often computed with a single primary data source does not fully ensure that benchmark calculations best represent the market during the fixing point of time or window," the ECB paper seen by Reuters said.
"Moreover, in case of illiquid currencies, FX benchmarks are computed from quotes rather than actual transactions," the paper add.
The ECB also said the FX market was getting more fragmented across a number of trading platforms and banks.
There is no precise data on trading but according to market participants and anecdotal evidence, the most widely used FX benchmark is the WM/Reuters 4pm London fixing, it said.
The WM/Reuters fix relates to several exchange rates, including the euro, sterling, Swiss franc and yen set daily in London. These are compiled using data from Thomson Reuters
and other providers, and are calculated by WM Company, a unit of State Street Corp, and are used as reference rates for trillions of dollars worth of investments, trade and corporate deals around the world.
WM Company administers the WM/Reuters Service. Thomson Reuters is a primary source of rates to WM, to which WM applies its methodology and calculates the benchmark.
Thomson Reuters is one of the various distributors of the rate. Thomson Reuters is the parent company of Reuters News, which is not involved in the fixing process.
Other FX benchmarks include the ECB's own reference rates which are sometimes used by asset managers, the paper said.
"Volumes at the ECB reference rates have reportedly increased over the recent months as the ECB reference rates are perceived as independent and reliable," the paper said.
It said market participants say that the risk of manipulation of FX benchmark rates comes from improper trading behaviour rather than from weaknesses in how the rates are compiled.
"To mitigate the risk, some banks have been revising their internal procedures for executing FX transactions at benchmark rates and considering ways to strengthen the application of Codes of Conduct," the paper said.
The Calm Before the Storm
In less than 24 hours, the FOMC meets to release many potentially significant market moving announcements. Merlin takes a look at the releases and offers words of advice on how to trade them. He also takes a look at the Dollar, Euro, Pound and other currencies which will be impacted by the announcements.
Stock Market's High P/E Suggests Lower Returns Ahead
With the stock market setting new highs, investors face unusually tough choices. An examination of historical valuations points to low forward returns for the U.S. stock market. Normally, bonds would provide a safe harbor, but interest rates are still near historic lows. They will not provide the same portfolio protection as in years past and, worse, bond prices will decline when interest rates rise.
It is tricky to structure a portfolio in the face of these risks but there are moves you can make right now.
Looking at history, the stock market’s returns depend a lot on where equity valuations are when you start the clock. Ned Davis Research has done the math, comparing the actual levels of the S&P 500 Index each month with a “normal” valuation of the index based on fundamental factors like P/E, dividends, earnings, and cash flows. They identified points when the market was over- or undervalued by at least 20% and they crunched the numbers on performance after each of these points.
The performance difference is dramatic. On average, one year after a low valuation, the market rose by 19.4%. One year after a high valuation, it dropped by 3.6%. When the market has been fairly valued, it increased 8.0%. Also note the returns one, two, three and five years later.
Data through 5-31-2014 shows the market to be 33.240% overvalued. This says risk is high in holding stocks right now yet it is important to note that the market could extend even further driven by QE, foreign capital inflows or the return of the retail investor. I am simply pointing out prospects for future gains are much lower at current P/E multiples than they are at more normal levels. Understanding where you are at any point in time can help you decide to either position your portfolio more aggressively, or position it more conservatively. If risk is high, hedge what you have. If risk is low, get aggressive and buy. In this regard, valuation measures may not be a good timing tool but they are a good risk measuring tool.
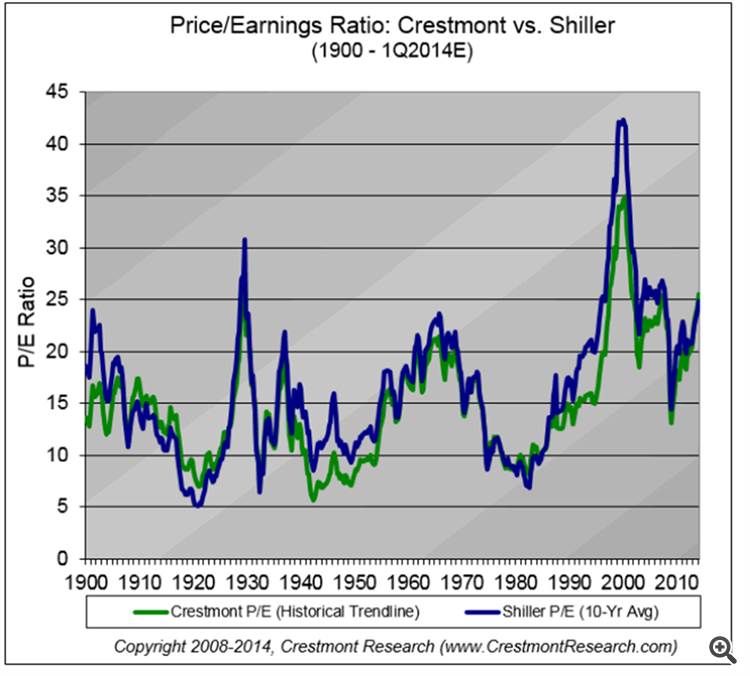
Crestmont Research puts the current P/E ratio of the S&P 500 at 26, consistent with results of a methodology popularized by Yale professor Robert Shiller. As a reference point, 26 is high compared to what Crestmont calculates to be a long-term “normalized” P/E ratio of about 15 based on 10-year trailing earnings, and adjusted by removing the abnormally high ratios of the late 1990s and early 2000s, which they believe inflate the long-term averages. According to Crestmont, “except for bubble periods, the P/E tends to peak near 25.” This measure says risk is high.
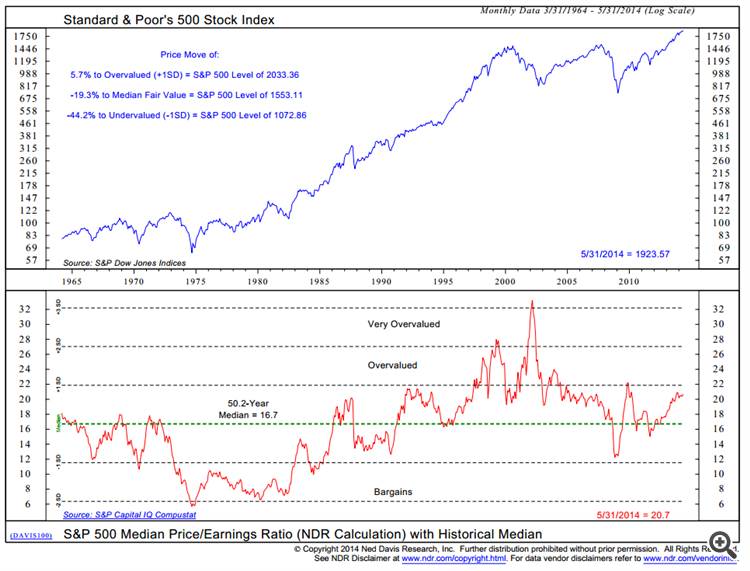
Using a different methodology, Ned Davis Research (NDR) pegs the median P/E ratio over the long term at 16.7. At a current P/E ratio of 20.7, a fair valuation for the S&P 500 is 1553. The S&P 500 is at 1940, suggesting the market is more than 20% overvalued. The following chart suggests the S&P 500 will be overvalued at 2033.36 (a+1 standard-deviation move above fair value).
Some investors say the market is fairly priced today pointing to P/E based on Wall Street analysts’ forward earnings estimates – unfortunately, analysts have a nasty habit of being overly optimistic so caution is advised. Profit margins are highly mean reverting; thus, some form of smoothing actual earnings makes sense. Find your favorite P/E evaluation process, compare it to its historical data and stick with it. History shows that when P/E valuations are high risk is high and forward return expectations are low. The reverse is true when P/E valuation measures are low.
How can an investor adapt to this environment, especially when the bond market presents risks as well? Just as an odds maker would look at the data and position risk accordingly, I favor P/E as a tool to measure the level of current market risk. When risk is low, position more aggressively long equities. When risk is high, use tools that can help you hedge your equity exposure and increase portfolio weightings to tactical strategies.
I highlight four strategies for the current high risk environment:
- Options strategies for “tail risk hedging”
- Lower-risk equity ETFs
- Alternative investments
- Tactical asset allocation
The first three are tools that an investor can pick up on their own, but require research and care to use safely. One tool could be an options hedging strategy, such as a collar around the current elevated level of the market. With a collar, you can still hold the market (e.g. SPY), while simultaneously buying protective puts and selling out-of-the-money call options against this holding. The puts provide downside protection, and the calls provide income which can help pay for the puts. The calls also limit the upside, however.Another strategy would be to allocate toward funds and ETFs that have lower market risk, and away from products that have higher market risk. For example, earlier this year, First Trust launched a Low Beta Income ETF (FTLB), which employs a collar options positions as described above.
The Guggenheim Defensive Equity ETF (DEF) tries to replicate an index that emphasizes sectors that outperform in down markets. The Vanguard Utilities ETF (VPU) is another example of a more defensive play. In contrast, ETFs like iShares Russell 2000 (IWM), PowerShares (QQQ) or iShares Nasdaq Biotechnology (IBB) expose investors to greater volatility and might suffer disproportionately in a downturn or provide superior returns when bought when the market is more attractively priced.
A third approach is to allocate more to alternative investments, which are generally designed to deliver returns that are not solely dependent on an up-trending equity or fixed income markets. These include alternative asset classes like commodities, long-short equity, real estate and managed futures. ARQ Managed Futures Strategy Fund (AQMIX) has done a good job at producing a return stream with little correlation to the stock market.
A fourth approach, tactical asset allocation, provides investors a way to access diversification and downside protection by hiring an outside manager with latitude to pick among asset classes and reallocate in response to market conditions. Tactical investment strategies are trading strategies that analyze price momentum or fundamental data and seek to position to assets classes that are showing the strongest relative strength. They may position more defensively to bonds, raise cash or position more aggressively in equity ETFs. You can blend into your portfolio as much or as little tactical exposure as you are comfortable with. The idea is to add important diversification to soften the rough edges of market moves.
Blackrock has a program called iShares Connect and provides insights and resources for selecting an ETF Investment Strategist. Envestnet has created a benchmark for you to compare the relative performance of various tactical investment strategies. The idea is to allocate to several different strategies that deepens your portfolio diversification.
In today’s higher-risk environment, the goal now is not only to invest for growth, but to feel more secure – and less emotional and better positioned to take advantage of the opportunities that the next crisis will create. This calls for an awareness of underlying risk and the inclusion of strategies to mitigate the risk.
Valuation measures like P/E ratios may not be perfect timing tools, but they are great gauges of relative risk. Today, risk is high.
How to Scale-In and Scale-Out of Trades (based on dailyfx article)
- Many successful strategies scale in and scale out of positions.
- We should only add-to or partially close winning positions.
- We should place these scaling orders at key levels, not hard set “X” amount of pips.
We spend a lot of time as traders figuring out the best time to get in to and get out of trades, but I'd argue that how we get into trades is just as important. Today we look at scaling in and scaling out of positions, and how it can benefit your current trading strategy.Why Do Traders Scale-In and Scale-Out?
There are many reasons why profitable traders turn to scaling into a position over time. More advanced reasons include to reduce the amount of slippage received when opening a large trade or to hide a large position that you don't want others to know about. But, the most important reason why traders scale into a trade is to enhance their gains on a trade that has already begun to show promise.
It is very obvious that larger trade sizes will result in larger profits when the trade moves in our favor. That makes complete sense. But when we have the ability to start off our trade with a smaller trade size and only add to a trade when its winning, we are able to start off our trade by risking a little and end our trade with the chance to make a lot. So not only to do we enhance our profit potential, we can also reduce our risk by starting with a smaller trade. Only adding to the trade after its profitable.
Scaling out of the trade is a similar idea to scaling in, but in reverse. Rather than letting a trade hit a profit target and close out the entire position, we instead partially close the trade, and let the rest have the opportunity to move further into profitable territory. This secures a profit but also leaves the door open for further gains. It is also common to move your stop loss to break even or beyond when an initial profit target is hit. That way the remaining position you have open is almost "risk-free."
What Type of Trades Can This Method Be Used?
So now that we understand the benefits of scaling in and scaling out of trades, in what situations should we consider it? Well, for starters, we should only look to add to positions that are in profitable territory. We don't want to throw good money after bad if the trade is already proving us wrong. It's best to cut losers short, lest we add fuel to the fire.
We also only want to scale out of positions only when they are profitable as well. There is no reason (other than hope) to partially close out a trade once its proven us wrong. So rather than setting a single profit target for the entire trade, we can set 2 or 3. It's also possible to leave a part of our trade open without a limit at all, and letting an indicator or a trailing stop decide when it should be closed.
Where Do We Add-To or Partially Close Trades?
Using this method is actually much easier than many traders try to make it. The way I look at scaling in is the same way I would look at opening up a single trade, but locating several times where opening up a trade is warranted. Stay away from setting "blind" entries 50, 100, or 200 pips away from our original entry. We want to have just as much reason to add to a trade as we did when we initially opened it.
Take the simple CCI strategy below where we decided to take a buy trade when CCI crossed above -100. This is a classic trade that found itself in a pretty tight range for the next 20-25 bars. There were times when price ran up in our favor; but never a definitive price move that would catch the attention of AUD/USD bulls, until the range was broken and price closed above resistance. This breakout would justify buying the Aussie in its own right. But since we already had a trade, we can simply add to our existing trade.
After we added to our position, we witnessed another "top" creating another resistance level. When the AUD/USD broke this 2nd resistance level, that was another time where we could add to this trade. So it isn't anything too difficult. We just look for opportunities where buy trades look good, and allow those entries to add to our existing trade.
As for scaling out, we want to use the same method as we would normally use to exit trades, but pick multiple levels that fit that criteria. So for the chart below, we can see that we bought on an initial break of a previous high. We then targeted a profit just below the next potential resistance level and then targeted an exit just below the resistance level after that. So rather than taking a quick profit on our entire trade at the first resistance level, we were able to let part of the trade run and obtain greater profits.
Scaling for Success
So we understand that our strategies' trading logic is important, but so is how we enter and exit our trades. Scaling in and scaling out can enhance our gains but also at times reduce our risk. Using the methods above can improve your strategy, but remember to perform your own due diligence before placing any trades on your own account.