Trading the News: Canada Consumer Price Index(based on dailyfx article)
Canada Consumer Price Reading of 2.0% Will Mark Highest Price Since April 2012.
Core Rate of Inflation to Increase for Third Time in 2014.
A sharp rebound in Canada’s Consumer Price Index (CPI) may generate a
larger pullback in the USD/CAD as the pair struggles to push back above
former support around 1.0930-40.
What’s Expected:
Why Is This Event Important:
Despite the dovish tone for monetary policy, heightening price pressures
may limit the Bank of Canada’s (BoC) scope to further embark on its
easing cycle, and the bearish momentum in the USD/CAD may get carried
into June should the data print prop up interest rate expectations.
The ongoing recovery in private sector activity paired with the
resilience in the housing market may spur a meaningful rebound in the
CPI, and a stronger-than-expected inflation print may heighten the
appeal of the Canadian dollar as it dampens expectations for a rate cut.
However, firms may continue to offer discounted price amid the
persistent weakness in the labor market along with the slowdown in
private sector, and a dismal release may instill a more bullish outlook
for the USD/CAD as it appears to be carving a higher-low in May.
How To Trade This Event Risk
Bullish CAD Trade: Headline Inflation Climbs 2.0% or Greater
Need red, five-minute candle after the CPI report to consider short USD/CAD entry
If the market reaction favors a bullish Canadian dollar trade, establish short with two position
Set stop at the near-by swing high/reasonable distance from cost; use at least 1:1 risk-to-reward
Move stop to entry on remaining position once initial target is hit, set reasonable limit
Bearish CAD Trade: Canada Price Growth Falls Short of Market Forecast
Need green, five-minute candle following the release to look at a long USD/CAD trade
Carry out the same setup as the bullish loonie trade, just in reverse
Potential Price Targets For The Release
USD/CAD Daily
Need Break of Bearish RSI Momentum to Favor Topside Targets
Interim Resistance: 1.1000 (1.618% expansion) to 1.1020 (23.6% retracement)
Interim Support: 1.0850 (61.8% retracement) to 1.0870 (100% expansion)
Impact that the Canada CPI report has had on CAD during the last month
Period
Data Released
Survey
Actual
Pips Change
(1 Hour post event )
Pips Change
(End of Day post event)
MAR
2014
04/17/2014 12:30 GMT
1.4%
1.5%
-12
flat
March 2014 Canada Net Change in Employment
USDCAD : 13 pips price movement by CAD - CPI news event
The Canadian Dollar strengthened against the greenback following better
than expect CPI for March. The print came in at a tenth of a percent
higher, but CAD strength was quickly retraced by the end of the day.
Although on a technical basis we may have set a USDCAD low, it may take
weak CAD data and inflation coming in on the downside to prompt
fundamental CAD selling.
Should You Exit Your FX Trade On Strength Or Weakness?(based on dailyfx article)
Why Traders Neglect the Exit
Two Exit Approaches
Specific Tools for Both Exit Strategies
“You can’t control what the market does, but you can control your
reaction to the market. I examine what I do all the time. That’s what
trading is all about.”
-Steve Cohen, Hedge Fund Manager
In my experience, the more years a trader has under their belt, the more
attention they pay to the exit on their trade. It’s not that the entry
isn’t important, it’s just that there’s a direct profit impact based on
your exit. This article will breakdown two methodologies for exiting
your forex trades so that you can choose the one that aligns best with
your personality & goals.
Why Traders Neglect the Exit
As a trader, it’s easy to focus on entering the trade. After all, you’ve
got to be in it to when it and the only way to be in it is to find an
entry. And when it comes to entering into a trade, your mind is likely
to race to different outcomes about whether or not this trade will be a
home-run that “can’t fail” or whether you’re not 100% sure on the trade
and therefore, should either hold-off or enter with a smaller trade
size. For what it’s worth, regardless of your analysis, the second
attitude used as an example is the healthier approach
However, it’s probably best to take the pressure of yourself regarding
the entry. Why? Because, you likely will get at best a decent entry
unless you’re counter-trend trading. It’s an irony or paradox of trading
that most new traders fret about the entries but where they decide to
exit is the most crucial point.
Two Exit Approaches
This part is simple. As far as I’m concerned, there are only two ways
that you can decide to exit a trade (well, three if not having a plan is
a way to exit). The first method benefits short term traders and that
is exiting on strength in the direction of your entry. Therefore, if
you’re buying, you can look for clear resistance points or other methods
to exit when others are jumping in. The drawback to this methodology is
that you could be exiting as the move is just getting started.
The second method is to the benefit of swing style or longer term
traders. The preferred exit methodology for longer-term traders is to
exit on weakness or a correction in the trend that you’re entering.
Exiting on weakness has two distinct drawbacks and that is you either
get taken out on a wick low before the trend resumes and / or, you find
yourselves leaving a large portion of your paper profits on the table.
Specific Tools for Both Exit Strategies
We just discussed that you can either decide to exit your trades on
strength or weakness. To exit on strength, here are a few methodologies
you can use that I’ve found favorable over the years:
My preferred methodology is Pivot targets. In a normal uptrend, I’ll
look to exit at the weekly R1 level and in a strong uptrend, my
preferred exit is the R2 (reversed for downtrends with S1 & S2). The
other two methods have been used successfully by many traders.
Emotionally, I believe it’s harder for new traders to exit on weakness.
The reason is that it’s easy to beat yourself up for letting so much of
your paper profits go away. In order to be comfortable exiting on
strength, it’s best to not look at the chart after you exit for a few
hours because you don’t want to beat yourself for taking money out of
the market. That’s what we’re doing here in the first place!
Platinum and Palladium Hit 2014 Highs, Crude Oil Looks To US GDP(based on dailyfx article)
Crude oil looks to US GDP and Durable Goods Orders for guidance
Platinum and palladium receive boost from supply concerns
Gold and silver’s tennis match between support and resistance continues
Platinum and palladium
have edged out fresh 2014 highs as geopolitical risks raise concerns
over supply disruptions for the precious metals. Meanwhile a busy US
economic docket next week could offer some support to gold and silverand put pressure on crude oil if data misses expectations.
US Data Heads Event Risk Next Week
A relatively light economic docket in the session ahead may fail to stir volatility in the commodities space. With US New Homes Sales
figures as the headline event out of the US, the medium-tier economic
data is unlikely to catalyze a major shift in sentiment. While
commodities exchanges will be closed on Monday for the Memorial Day
holiday, the remainder of the week is loaded with noteworthy event risk
which includes revised US first quarter GDP figures, Consumer Confidence data, and Durable Goods Orders.
The secondary estimate for US GDP is tipped to
reveal an annualized decline of 0.6 per cent, which would be the weakest
pace of economic growth since Q1 2011. Similarly Durable Goods Orders
may do little to inspire confidence in the health of the US economy,
with economists expecting a drop of 0.7 per cent for the leading
indicator. Disappointing readings from both measures would likely weigh
on the growth-sensitive commodities including crude oil, based on
speculation of reduced demand. Downside surprises would also put
pressure on the US Dollar, which in turn could offer some support to gold prices.
Supply Disruption Fears Boost Platinum Prices
While gold and silver have been uninspired of-late, platinum and palladium have continued their ascent in recent trading. Palladium rose for its 5th
straight session on Thursday with prices hitting the highest level
since August 2011. The precious metal has risen by roughly $118.00 this
year, putting the year-to-date percentage gain at close to 16.5 percent.
As noted in recent commodities reports;
one of the likely drivers behind the boost to the precious metals is
the ongoing fear over potential supply disruptions from two of the
commodities largest producers; Russia and South Africa. The 18-week long
mining workers strike in South Africa’s platinum belt has continued to
crimp production of the metal. Newswires reported on Thursday that
another miner in the region had been killed for trying to return work,
which comes as the latest in a series of casualties associated with the
strike.
Meanwhile ongoing tensions in Eastern Europe
have added an additional source of concern over palladium supply. This
comes as the West mulls further sanctions against Russia, which accounts
for roughly 40% of the commodity’s production. However, if we see a
de-escalation in the region, fears over supply disruptions may prove
unfounded which could in turn lead to an unwinding of long positioning
in the precious metals. This leaves platinum particularly vulnerable
given net positioning amongst speculative traders is at the highest
level since February 2013.
The dollar and the pound enjoyed a positive week and the euro continued
to grind lower. European Parliamentary Elections, US Durable Goods
Orders, Consumer Confidence, GDP figures form the US and Canada as well
as US employment data are the main market movers this week.
The FOMC meeting release failed to bring surprises. The main focus was
on normalizing monetary policy after the Fed finishes its asset
purchase tapering. The Fed expects growth will continue to accelerate
in 2014 despite the unexpected softness in the first quarter attributed
to bad weather conditions. The euro was pressured lower once again,
through a combination of unimpressive data and more talk from the ECB
regarding an imminent rate hike. In the UK, mostly positive data kept
the pound bid, and cable still has a shot on 1.70. The Aussie showed
weakness despite a positive surprise from China. Where will currencies
go in the last week of this turbulent month?
European Parliamentary Elections: The
European Parliament elections takes place every five years. This time
751 MEPs will be elected and the voters will have more of a say in the
appointment of the next Commission president. According to recent
surveys, only 37 percent of Europeans believe their voice counts in
Brussels. Policymakers in Brussels are trying to democratize the
election process, and for the first time, the election results will be
linked to the selection of the European Commission president. The major
risk is that Euro-skeptic parties from the right will gain ground, thus
undermining the decision making processes in the union.
US Durable Goods Orders:
Tuesday, 12:30. Orders for long lasting U.S. manufactured goods
increased more than expected in March, jumping 2.6%, higher than the
2.1% rise estimated, while Core orders edged up 2.0%, beating forecasts
of a 0.6% increase. Capital spending plans increased significantly
indicating a pickup in growth in the second quarter. This report
correlates with other manufacturing data indicating expansion. Durable
goods orders are expected to decline by 0.5%, while core orders are
expected to rise 0.2% this time.
US CB Consumer Confidence:
Tuesday, 14:00. US consumer confidence came below market consensus in
April reaching 82.3 from 83.9 in the previous month. Analysts expected
a slightly stronger reading of 82.9. Consumers assessed current
business and employment conditions less favorably than in March,
however the short-term outlook remained strong. Consumer confidence is
expected to rise to 83.2.
Haruhiko Kuroda speaks: Wednesday,
0:00. BOE Governor Haruhiko Kuroda will speak in Tokyo. Kuroda stated
last month that consumer inflation may exceed the central bank’s
projection in the fiscal year that ended in March. BOE Governor is
confident that Japan’s economy is progressing in line with the banks
forecasts. Kuroda may explain the BOJ’s decision of maintaining
monetary policy. Market volatility is expected.
US GDP (second release):
Thursday, 12:30. The preliminary estimate of GDP growth for the first
quarter of 2014 showed a weak growth rate of 0.1% dragged down by lower
demand and unusually harsh weather conditions. Nevertheless, consumer
spending increased 3.0% in the first three quarters. With weather
conditions back to normal, housing and corporate investment should
rebound sharply. GDP growth estimate for the first quarter is expected
to show a 0.6% contraction and this could weigh on the dollar.
US Unemployment Claims: Thursday,
12:30. The number of Americans filing initial claims for unemployment
benefits edged up by 28,000 last week to 329,000, but still remaining
at low levels suggesting a steady pace of hiring. The four-week average
declined 1,000 to 322,500 indicating an increase in job openings. The
pickup in hiring may help boost economic growth for the rest of 2014.
Jobless claims are expected to reach 321,000 this time.
US Pending Home Sales: Thursday,
14:00. Contracts to buy existing U.S. homes edged up in March by 3.4%
following a 0.8% contraction in the prior month. The reading was well
above expectations for a 1.0% rise. This was the first good sign in
nine months that the housing market is recuperating. The strong reading
suggest that the housing market will continue to support growth in the
US economy. Pending home sales are expected to rise further by 1.1%.
Canadian GDP:
Friday, 12:30. The Canadian economy expanded by 0.2% in February after
a 0.5% growth in January. The reading came in line with market
forecast, indicating a modest recovery from the 0.4% contraction in
December. However estimate for the first quarter growth stand at 1.7%-to
1.9%. February’s growth is credited to the mining and oil and gas
industries. The agriculture and forestry sector contracted 1.5%.
Manufacturing rose 0.6% after increasing 1.6% in January, and goods
production climbed 0.5%. GDP for March is expected to reach 0.1%.
Weekly Price & Time: USD/JPY Rebounds From Bottom of Multi-Month Range
USD/JPY Drops Below 101.00 As BOJ Refrains From Further Stimulus
The USD/JPY pared the decline following the Bank of Japan (BoJ)
interest rate decision, with the pair working its way back towards
former support (101.80-102.00), but the economic developments due out
next week may instill a more bearish outlook for the dollar-yen should
the data prints spark a greater deviation in the policy outlook.
The BoJ Minutes may continue to heighten the appeal of the Japanese
Yen as the central bank turns increasingly upbeat on the economy, and
we may see a growing number of central bank officials scale back their
dovish tone for monetary policy as Governor Haruhiko Kuroda remains
confident in achieving the 2% target for inflation. With that said, it
seems as though the sales-tax hike may have a limited impact on the
economic recovery while raising the outlook for inflation as Japan’s
Consumer Price Index (CPI) is expected to increase an annualized 3.3%
in April, and a marked uptick in the headline reading for price growth
may continue to generate lower highs & lower lows in the USD/JPY as
it dampens bets of seeing the BoJ further expand its asset-purchase
program.
At the same time, the advance U.S. 1Q GDP report may also put
increased downside pressure on the dollar-yen as the world’s largest
economy is expected to contract 0.5% during the first three-months of
2014, and a marked downward revision in the growth rate may drag on
interest rate expectations as Fed Chair Janet Yellen remains in no rush
to normalize monetary policy.
Given the string of lower highs & lower lows, the downward
trending channel may continue to take shape going into the end of May,
and the USD/JPY may make a more meaningful run at the 100.50 region
should the fundamental developments spur an increased deviation in the
policy outlook.
EUR/JPY Rebound to Target Former Support- Gold Capped by 50-Day SMA
Gold prices are virtually unchanged on the week with prices off by a
mere 0.1% to trade at $1291 ahead of the New York close on Friday.
Prices have continued trade within a tight range despite ongoing
strength in the US dollar and broader equity markets. Nevertheless,
gold remains at a critical juncture and the technical picture continues
to suggest that a break of a multi-week consolidation pattern is
imminent as we head into the close of May trade.
In light of the recent strong demand for US Treasuries, it’s
disconcerting that although gold has largely moved in tandem Treasuries
since the start of the year, it has been unable to participate in the
bond rally since April. This condition suggests that the gold market
remains vulnerable in the near-term and with the long bond coming off
key near-term resistance at the 61.8% retracement from the decline off
the 2012 record highs, further weakness in Treasuries could put added
downside pressure on gold prices.
Looking ahead, the preliminary 1Q GDP print highlights the biggest
event risk for the week ahead with consensus estimates calling for a
downward revision to reflect an annual contraction of 0.5% q/q. With
that said, a dismal growth read may dampen the appeal of the US Dollar
and spur increased demand for gold as interest expectations get pushed
out. Watch for developments in the bond market and the greenback for
guidance with the recent price action in gold warning of a decisive
move heading into the monthly close.
From a technical standpoint, our outlook remains unchanged from last
week. “Gold has continued to trade into the apex of a multi-week
consolidation pattern off the April highs and a break-out ahead
of the May close is in focus. A break below 1260/70 is needed to put
the broader bearish trend back into play targeting $1216/24 and the
2013 lows at $1178. Interim resistance and our near-term bearish
invalidation level stands at $1307/10 with a move surpassing $1327/34
shifting our broader focus back to the long-side of gold. Bottom line:
look for a decisive break of this pattern next week with a move
surpassing the May opening range to offer further clarity on our
medium-term directional bias. The broader outlook remains weighted to
the downside sub $1334.
Fundamental Forecast for Australian Dollar: Bearish
Australian Dollar Drops Most in Four Months on Dovish RBA Minutes
Firm US Data to Cement Fed QE Cutback Outlook, Punish the Aussie
The Australian Dollar fell by the most in four months against its US counterpart last week after a dovish tone in minutes from May’s RBA meeting
weighed dented interest rate hike bets. A lull in homegrown event risk
in the week ahead puts the onus on external catalysts, with the
spotlight on investors’ evolving Federal Reserve policy outlook.
A central theme driving markets since the beginning of the year had
been the disparity between soft US economic data and the Fed’s
commitment to continue “tapering” its QE stimulus program. That
encouraged markets to speculate that lackluster economic performance
will push the central bank to scale down or abandon reducing the size of
its asset purchases. For its part, the Fed has steadily reduced its
cash injections by $10 billion/month since the cutback process was
initiated in December. Fed Chair Janet Yellen and her colleagues on the
policy-setting FOMC committee argued that the downturn in the first
quarter was transitory and didn’t warrant a change of course. The
markets were duly skeptical of this position absent hard evidence to
support it.
This may now be changing. The tone of US economic news-flow appears to
have marked an important turn in early April, with data from Citigroup
showing that outcomes have been consistently improving relative to
expectations since. That hits that analysts are underestimating the
resilience of US recovery, opening the door for upside surprises. The
week ahead will see a diverse range of US economic indicators cross
the wires. Durable Goods Orders, Consumer Confidence, Pending Home
Sales, Personal Income and Spending as well as revised first-quarter
GDP figures are all on tap. On the commentary front, a speech from
incoming Cleveland Fed President Loretta Mester is a standout. Mester
will take the place of Sandra Pianalto on the FOMC starting June 1 and
markets will keen to evaluate where she stands.
Unencumbered speculation about the end of QE and the beginning of
interest rate hikes thereafter sparked liquidation across the spectrum
of risky assets last year, when then-Chairman Ben Bernanke first hinted
at stimulus reduction. Increasingly upbeat US economic data against a
backdrop of pro-taper Fed rhetoric threatens to re-ignite this dynamic.
As one of the higher yielders in the G10 FX space, the Australian
Dollar is highly sensitive to broad-based risk aversion, meaning
another mass exodus from sentiment-geared assets stands to hurt the
currency.
The silver markets tried to rally during the course of the week, but as
you can see basically ended up unchanged. The market is sitting just
above the $19 handle, and we do think that it is somewhat of a “floor”
in this market. However, it doesn’t look like it’s ready to continue
going higher from here, so until we get a weekly close above the $20
level, we really are doing anything at this point in time. A move below
the recent lows could have us selling, aiming for the $15 level.
The light sweet crude markets rose during the course of the week,
closing and at the very highs as we closed on Friday above the $104
level. That being the case, we feel that this market should certainly
continue going higher, and as a result $105 level will be the next
resistance area that we will have to struggle with. A move above there
sends the market going much higher, and as a result we do ultimately
believe that the $110 level will be tested.
The market could very well pullback in the near-term though, and we
simply look at that as value. The market most certainly has a taut of
support below current levels, and as a result we feel that pullbacks
will bring in more and more buyers, not to mention short covering as it
will give some relief to those traders that are on the other side of
this move.
The Brent market as you can see went back and forth during the course of
the week, proving the $109 level to be supportive enough to pop the
market higher. We when as high as $111 at one point in time, and
recognize that we are somewhat range bound. However, we feel that the
market will ultimately breakout above the $111 level, and head towards
the $115 level. Oil markets in general are very bullish right now, and
with everything that’s going on in the Crimea, it’s hard to believe that
there is suddenly going to be a headline that’s going to push oil
prices back down.
Any pullback at this point time should bring in value seekers, and we
are counting on that to happen. There is a ton of support all the way
down to the hundred $5 level, and quite frankly probably even lower than
that. The market is most certainly bullish, and as a result we will
continue to buy on dips, with absolutely no interest in selling what
looks to be a very strong uptrend at this point.
The natural gas markets tried to rally during the course of the week,
but found the $4.60 level to be far too resistive to continue going
higher. With that, the market formed a shooting star, which of course is
very negative. The $4.20 level below offers a significant amount of
support, and as a result feel that this market should offer buying
opportunities below and as a result we aren’t comfortable shorting into
we get well below the $4.20 level, which at that point time could open
the door way to the $3.60 level given enough time.
Allow the use of cookies to log in to the MQL5.com website.
Please enable the necessary setting in your browser, otherwise you will not be able to log in.
You are signed in. Two-factor authentication has been disabled. Set it up again and scan a new QR code, or continue with two-factor authentication disabled.
Trading the News: Canada Consumer Price Index (based on dailyfx article)
A sharp rebound in Canada’s Consumer Price Index (CPI) may generate a larger pullback in the USD/CAD as the pair struggles to push back above former support around 1.0930-40.
What’s Expected:
Why Is This Event Important:
Despite the dovish tone for monetary policy, heightening price pressures may limit the Bank of Canada’s (BoC) scope to further embark on its easing cycle, and the bearish momentum in the USD/CAD may get carried into June should the data print prop up interest rate expectations.
The ongoing recovery in private sector activity paired with the resilience in the housing market may spur a meaningful rebound in the CPI, and a stronger-than-expected inflation print may heighten the appeal of the Canadian dollar as it dampens expectations for a rate cut.
However, firms may continue to offer discounted price amid the persistent weakness in the labor market along with the slowdown in private sector, and a dismal release may instill a more bullish outlook for the USD/CAD as it appears to be carving a higher-low in May.
How To Trade This Event Risk
Bullish CAD Trade: Headline Inflation Climbs 2.0% or Greater
- Need red, five-minute candle after the CPI report to consider short USD/CAD entry
- If the market reaction favors a bullish Canadian dollar trade, establish short with two position
- Set stop at the near-by swing high/reasonable distance from cost; use at least 1:1 risk-to-reward
- Move stop to entry on remaining position once initial target is hit, set reasonable limit
Bearish CAD Trade: Canada Price Growth Falls Short of Market Forecast- Need green, five-minute candle following the release to look at a long USD/CAD trade
- Carry out the same setup as the bullish loonie trade, just in reverse
Potential Price Targets For The ReleaseUSD/CAD Daily
- Need Break of Bearish RSI Momentum to Favor Topside Targets
- Interim Resistance: 1.1000 (1.618% expansion) to 1.1020 (23.6% retracement)
- Interim Support: 1.0850 (61.8% retracement) to 1.0870 (100% expansion)
Impact that the Canada CPI report has had on CAD during the last month(1 Hour post event )
(End of Day post event)
2014
March 2014 Canada Net Change in Employment
USDCAD : 13 pips price movement by CAD - CPI news event
The Canadian Dollar strengthened against the greenback following better than expect CPI for March. The print came in at a tenth of a percent higher, but CAD strength was quickly retraced by the end of the day. Although on a technical basis we may have set a USDCAD low, it may take weak CAD data and inflation coming in on the downside to prompt fundamental CAD selling.
MetaTrader Trading Platform Screenshots
USDCAD, M5, 2014.05.23
MetaQuotes Software Corp., MetaTrader 5, Demo
USDCAD M5 : 24 pips price movement by CAD - CPI news event
Should You Exit Your FX Trade On Strength Or Weakness? (based on dailyfx article)
“You can’t control what the market does, but you can control your reaction to the market. I examine what I do all the time. That’s what trading is all about.”
-Steve Cohen, Hedge Fund Manager
In my experience, the more years a trader has under their belt, the more attention they pay to the exit on their trade. It’s not that the entry isn’t important, it’s just that there’s a direct profit impact based on your exit. This article will breakdown two methodologies for exiting your forex trades so that you can choose the one that aligns best with your personality & goals.
Why Traders Neglect the Exit
As a trader, it’s easy to focus on entering the trade. After all, you’ve got to be in it to when it and the only way to be in it is to find an entry. And when it comes to entering into a trade, your mind is likely to race to different outcomes about whether or not this trade will be a home-run that “can’t fail” or whether you’re not 100% sure on the trade and therefore, should either hold-off or enter with a smaller trade size. For what it’s worth, regardless of your analysis, the second attitude used as an example is the healthier approach
However, it’s probably best to take the pressure of yourself regarding the entry. Why? Because, you likely will get at best a decent entry unless you’re counter-trend trading. It’s an irony or paradox of trading that most new traders fret about the entries but where they decide to exit is the most crucial point.
Two Exit Approaches
This part is simple. As far as I’m concerned, there are only two ways that you can decide to exit a trade (well, three if not having a plan is a way to exit). The first method benefits short term traders and that is exiting on strength in the direction of your entry. Therefore, if you’re buying, you can look for clear resistance points or other methods to exit when others are jumping in. The drawback to this methodology is that you could be exiting as the move is just getting started.
The second method is to the benefit of swing style or longer term traders. The preferred exit methodology for longer-term traders is to exit on weakness or a correction in the trend that you’re entering. Exiting on weakness has two distinct drawbacks and that is you either get taken out on a wick low before the trend resumes and / or, you find yourselves leaving a large portion of your paper profits on the table.
Specific Tools for Both Exit Strategies
We just discussed that you can either decide to exit your trades on strength or weakness. To exit on strength, here are a few methodologies you can use that I’ve found favorable over the years:
My preferred methodology is Pivot targets. In a normal uptrend, I’ll look to exit at the weekly R1 level and in a strong uptrend, my preferred exit is the R2 (reversed for downtrends with S1 & S2). The other two methods have been used successfully by many traders.
Emotionally, I believe it’s harder for new traders to exit on weakness. The reason is that it’s easy to beat yourself up for letting so much of your paper profits go away. In order to be comfortable exiting on strength, it’s best to not look at the chart after you exit for a few hours because you don’t want to beat yourself for taking money out of the market. That’s what we’re doing here in the first place!
Platinum and Palladium Hit 2014 Highs, Crude Oil Looks To US GDP (based on dailyfx article)
Platinum and palladium have edged out fresh 2014 highs as geopolitical risks raise concerns over supply disruptions for the precious metals. Meanwhile a busy US economic docket next week could offer some support to gold and silverand put pressure on crude oil if data misses expectations.
US Data Heads Event Risk Next Week
A relatively light economic docket in the session ahead may fail to stir volatility in the commodities space. With US New Homes Sales figures as the headline event out of the US, the medium-tier economic data is unlikely to catalyze a major shift in sentiment. While commodities exchanges will be closed on Monday for the Memorial Day holiday, the remainder of the week is loaded with noteworthy event risk which includes revised US first quarter GDP figures, Consumer Confidence data, and Durable Goods Orders.
The secondary estimate for US GDP is tipped to reveal an annualized decline of 0.6 per cent, which would be the weakest pace of economic growth since Q1 2011. Similarly Durable Goods Orders may do little to inspire confidence in the health of the US economy, with economists expecting a drop of 0.7 per cent for the leading indicator. Disappointing readings from both measures would likely weigh on the growth-sensitive commodities including crude oil, based on speculation of reduced demand. Downside surprises would also put pressure on the US Dollar, which in turn could offer some support to gold prices.
Supply Disruption Fears Boost Platinum Prices
While gold and silver have been uninspired of-late, platinum and palladium have continued their ascent in recent trading. Palladium rose for its 5th straight session on Thursday with prices hitting the highest level since August 2011. The precious metal has risen by roughly $118.00 this year, putting the year-to-date percentage gain at close to 16.5 percent.
As noted in recent commodities reports; one of the likely drivers behind the boost to the precious metals is the ongoing fear over potential supply disruptions from two of the commodities largest producers; Russia and South Africa. The 18-week long mining workers strike in South Africa’s platinum belt has continued to crimp production of the metal. Newswires reported on Thursday that another miner in the region had been killed for trying to return work, which comes as the latest in a series of casualties associated with the strike.
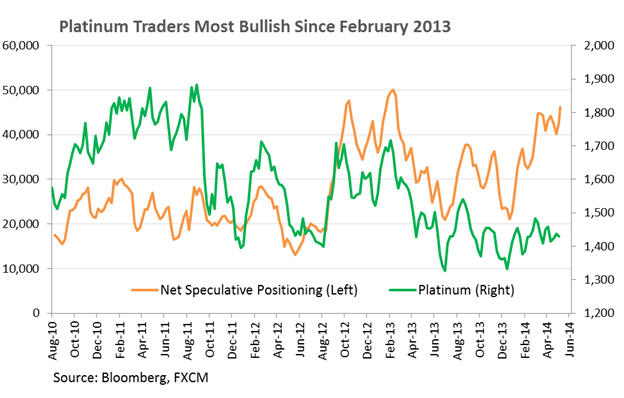
Meanwhile ongoing tensions in Eastern Europe have added an additional source of concern over palladium supply. This comes as the West mulls further sanctions against Russia, which accounts for roughly 40% of the commodity’s production. However, if we see a de-escalation in the region, fears over supply disruptions may prove unfounded which could in turn lead to an unwinding of long positioning in the precious metals. This leaves platinum particularly vulnerable given net positioning amongst speculative traders is at the highest level since February 2013.
The dollar and the pound enjoyed a positive week and the euro continued to grind lower. European Parliamentary Elections, US Durable Goods Orders, Consumer Confidence, GDP figures form the US and Canada as well as US employment data are the main market movers this week.
The FOMC meeting release failed to bring surprises. The main focus was on normalizing monetary policy after the Fed finishes its asset purchase tapering. The Fed expects growth will continue to accelerate in 2014 despite the unexpected softness in the first quarter attributed to bad weather conditions. The euro was pressured lower once again, through a combination of unimpressive data and more talk from the ECB regarding an imminent rate hike. In the UK, mostly positive data kept the pound bid, and cable still has a shot on 1.70. The Aussie showed weakness despite a positive surprise from China. Where will currencies go in the last week of this turbulent month?
USDJPY Fundamentals (based on dailyfx article)
Fundamental Forecast for Japanese Yen: BullishThe USD/JPY pared the decline following the Bank of Japan (BoJ) interest rate decision, with the pair working its way back towards former support (101.80-102.00), but the economic developments due out next week may instill a more bearish outlook for the dollar-yen should the data prints spark a greater deviation in the policy outlook.
The BoJ Minutes may continue to heighten the appeal of the Japanese Yen as the central bank turns increasingly upbeat on the economy, and we may see a growing number of central bank officials scale back their dovish tone for monetary policy as Governor Haruhiko Kuroda remains confident in achieving the 2% target for inflation. With that said, it seems as though the sales-tax hike may have a limited impact on the economic recovery while raising the outlook for inflation as Japan’s Consumer Price Index (CPI) is expected to increase an annualized 3.3% in April, and a marked uptick in the headline reading for price growth may continue to generate lower highs & lower lows in the USD/JPY as it dampens bets of seeing the BoJ further expand its asset-purchase program.
At the same time, the advance U.S. 1Q GDP report may also put increased downside pressure on the dollar-yen as the world’s largest economy is expected to contract 0.5% during the first three-months of 2014, and a marked downward revision in the growth rate may drag on interest rate expectations as Fed Chair Janet Yellen remains in no rush to normalize monetary policy.
Given the string of lower highs & lower lows, the downward trending channel may continue to take shape going into the end of May, and the USD/JPY may make a more meaningful run at the 100.50 region should the fundamental developments spur an increased deviation in the policy outlook.
GOLD (XAUUSD) Fundamentals (based on dailyfx article)
Fundamental Forecast for Gold: NeutralGold prices are virtually unchanged on the week with prices off by a mere 0.1% to trade at $1291 ahead of the New York close on Friday. Prices have continued trade within a tight range despite ongoing strength in the US dollar and broader equity markets. Nevertheless, gold remains at a critical juncture and the technical picture continues to suggest that a break of a multi-week consolidation pattern is imminent as we head into the close of May trade.
In light of the recent strong demand for US Treasuries, it’s disconcerting that although gold has largely moved in tandem Treasuries since the start of the year, it has been unable to participate in the bond rally since April. This condition suggests that the gold market remains vulnerable in the near-term and with the long bond coming off key near-term resistance at the 61.8% retracement from the decline off the 2012 record highs, further weakness in Treasuries could put added downside pressure on gold prices.
Looking ahead, the preliminary 1Q GDP print highlights the biggest event risk for the week ahead with consensus estimates calling for a downward revision to reflect an annual contraction of 0.5% q/q. With that said, a dismal growth read may dampen the appeal of the US Dollar and spur increased demand for gold as interest expectations get pushed out. Watch for developments in the bond market and the greenback for guidance with the recent price action in gold warning of a decisive move heading into the monthly close.
From a technical standpoint, our outlook remains unchanged from last week. “Gold has continued to trade into the apex of a multi-week consolidation pattern off the April highs and a break-out ahead of the May close is in focus. A break below 1260/70 is needed to put the broader bearish trend back into play targeting $1216/24 and the 2013 lows at $1178. Interim resistance and our near-term bearish invalidation level stands at $1307/10 with a move surpassing $1327/34 shifting our broader focus back to the long-side of gold. Bottom line: look for a decisive break of this pattern next week with a move surpassing the May opening range to offer further clarity on our medium-term directional bias. The broader outlook remains weighted to the downside sub $1334.
AUDUSD Fundamentals (based on dailyfx article)
Fundamental Forecast for Australian Dollar: BearishThe Australian Dollar fell by the most in four months against its US counterpart last week after a dovish tone in minutes from May’s RBA meeting weighed dented interest rate hike bets. A lull in homegrown event risk in the week ahead puts the onus on external catalysts, with the spotlight on investors’ evolving Federal Reserve policy outlook.
A central theme driving markets since the beginning of the year had been the disparity between soft US economic data and the Fed’s commitment to continue “tapering” its QE stimulus program. That encouraged markets to speculate that lackluster economic performance will push the central bank to scale down or abandon reducing the size of its asset purchases. For its part, the Fed has steadily reduced its cash injections by $10 billion/month since the cutback process was initiated in December. Fed Chair Janet Yellen and her colleagues on the policy-setting FOMC committee argued that the downturn in the first quarter was transitory and didn’t warrant a change of course. The markets were duly skeptical of this position absent hard evidence to support it.
This may now be changing. The tone of US economic news-flow appears to have marked an important turn in early April, with data from Citigroup showing that outcomes have been consistently improving relative to expectations since. That hits that analysts are underestimating the resilience of US recovery, opening the door for upside surprises. The week ahead will see a diverse range of US economic indicators cross the wires. Durable Goods Orders, Consumer Confidence, Pending Home Sales, Personal Income and Spending as well as revised first-quarter GDP figures are all on tap. On the commentary front, a speech from incoming Cleveland Fed President Loretta Mester is a standout. Mester will take the place of Sandra Pianalto on the FOMC starting June 1 and markets will keen to evaluate where she stands.
Unencumbered speculation about the end of QE and the beginning of interest rate hikes thereafter sparked liquidation across the spectrum of risky assets last year, when then-Chairman Ben Bernanke first hinted at stimulus reduction. Increasingly upbeat US economic data against a backdrop of pro-taper Fed rhetoric threatens to re-ignite this dynamic. As one of the higher yielders in the G10 FX space, the Australian Dollar is highly sensitive to broad-based risk aversion, meaning another mass exodus from sentiment-geared assets stands to hurt the currency.
The silver markets tried to rally during the course of the week, but as you can see basically ended up unchanged. The market is sitting just above the $19 handle, and we do think that it is somewhat of a “floor” in this market. However, it doesn’t look like it’s ready to continue going higher from here, so until we get a weekly close above the $20 level, we really are doing anything at this point in time. A move below the recent lows could have us selling, aiming for the $15 level.
The light sweet crude markets rose during the course of the week, closing and at the very highs as we closed on Friday above the $104 level. That being the case, we feel that this market should certainly continue going higher, and as a result $105 level will be the next resistance area that we will have to struggle with. A move above there sends the market going much higher, and as a result we do ultimately believe that the $110 level will be tested.
The market could very well pullback in the near-term though, and we simply look at that as value. The market most certainly has a taut of support below current levels, and as a result we feel that pullbacks will bring in more and more buyers, not to mention short covering as it will give some relief to those traders that are on the other side of this move.
The Brent market as you can see went back and forth during the course of the week, proving the $109 level to be supportive enough to pop the market higher. We when as high as $111 at one point in time, and recognize that we are somewhat range bound. However, we feel that the market will ultimately breakout above the $111 level, and head towards the $115 level. Oil markets in general are very bullish right now, and with everything that’s going on in the Crimea, it’s hard to believe that there is suddenly going to be a headline that’s going to push oil prices back down.
Any pullback at this point time should bring in value seekers, and we are counting on that to happen. There is a ton of support all the way down to the hundred $5 level, and quite frankly probably even lower than that. The market is most certainly bullish, and as a result we will continue to buy on dips, with absolutely no interest in selling what looks to be a very strong uptrend at this point.
The natural gas markets tried to rally during the course of the week, but found the $4.60 level to be far too resistive to continue going higher. With that, the market formed a shooting star, which of course is very negative. The $4.20 level below offers a significant amount of support, and as a result feel that this market should offer buying opportunities below and as a result we aren’t comfortable shorting into we get well below the $4.20 level, which at that point time could open the door way to the $3.60 level given enough time.