Discussion of article "The algorithm of ticks’ generation within the strategy tester of the MetaTrader 5 terminal"
I read it. Very interesting article.
I agree.
The only disappointing thing is that you can't put your tick history into the tester :(

- 2010.05.21
- MetaQuotes Software Corp.
- www.mql5.com
The need for such an article is long overdue, I recommend everyone to read it,
I do not agree only with the author's conclusion"The chart clearly shows that the quality of tick modelling in the MetaTrader 5 client terminal tester allows for adequate testing of experts on historical data.
In my opinion, if modelling is based on reference points, it is essentially an approximation (that is, calculation of missing intermediate information using a given model), so with such a quality of approximation, we can't talk about adequate testing, discrepancies are quite serious, and discrepancies that could affect the decision-making in nodal points.

- 2010.05.21
- MetaQuotes Software Corp.
- www.mql5.com
I do not agree only with the author's conclusion"The chart clearly shows that the quality of tick modelling in the MetaTrader 5 client terminal tester allows for adequate testing of experts on historical data".
Just in case I repeat that the error can be only within a minute bar.
Pay attention to the attached chart - it has a minuscule vertical scale in pips, and the maximum divergence from the real tick flow sometimes breaks through 1-2 pips, which are absolutely insignificant within a minute bar. It is much more important that the modelling qualitatively passes all bar control points, uses the impulse development model with pullbacks and fits into the tick volume.
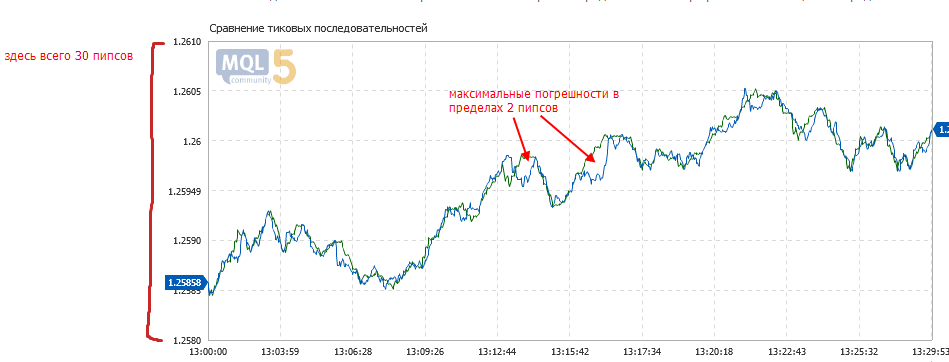
Price modelling in MetaTrader 5 is very close to ideal.
I recommend you to compare real tick histories and modelled ones to understand the quality of modelling. It is enough to collect ticks with a script, build a chart in Excel and compare them.
I have been waiting for this article for a long time THANK YOU !!!.
We work with data flow, and naturally we would like to have an adequate flow in the tester. You have given up tick history, very wrongly I think. Please answer the following questions.
1. How do you model the instantaneous density (intensity) of the flow?
It is one of the most important characteristics. It is like the MOG for a random variable http://ru.wikipedia.org/wiki/Теория_массового_обслуживания.
You have it equal to a constant, there is no such thing on the real, or am I wrong ?
2. How often during modelling there are moments of shuffling by time High and Low of the minute bar ?
3. The terminal is valuable exactly multicurrency testing, it is not clear from the article how the ticks of different currency pairs are arranged in time ?
Please think about this fact. The physical basis for the success of night ATS was the adequate representation of history (bars at night 1-2-3 pips is clear from the article). By presenting the history in the form of minutes. You deprive us of the opportunity to find patterns during the day, when the market is liquid and I assure you it is not about pips.
"The black swan is what's important. Here is my example https://www.mql5.com/ru/forum/115584/page11#150512 rarely black swan comes, but it comes - a minute candle of 2.5 figures. You can't put all the news in ATS, it's not realistic, but analysing these moments at tick level is very important, vital. In my opinion, 95% of traders leave the market, because they consider it unimportant. One such candle in a year is just enough to make a person go back to the market.
H.Y.The most important question for me is whether you plan to give tick history at least in the future? It is important for me, I am not so young to throw away my time, I would not want to waste it for learning a new platform and programming language.
Thank you in advance for the answer. Thanks.
1. density is uniform across the bar
2. the article describes the passage mechanism (there are no other options)
3. similarly evenly and independently of other currencies
We do not plan to providetick history - it is technical suicide.
There are a lot of people looking for the true profit in pips, convincing others that it's not about pips....
In the example with a gap of several figures, regardless of the density of the flow, few people will be able to get into the market, and even if they can, the slippage will be monstrous (roughly speaking, it will not work). A tester will be able to get into the market if it works in a normal mode.
We perfectly understand these problems and will soon add some special aggressive testing modes that will simulate both market cataclysms (for example, on gaps) and the quality of order execution (requotes, slippage, etc.):
I suggest waiting for additional trading modes, and then discussing the situation with renewed vigour.

- 2010.05.21
- MetaQuotes Software Corp.
- www.mql5.com
1. How do you model the instantaneous flux density (intensity) ?
You have it equal to a constant, there is no such thing in real life, or am I wrong?
"Durations are often modelled using Poisson processes."
Irene Aldridge "High-Frequency Trading: A Practical Guide to Algorithmic Strategies and Trading Systems"(http://books.google.ru/books?id=8iCiOip5scIC&pg=PA121&lpg=PA121&dq=quote+arrival+frequency+distribution&source=bl&ots=L8SQvN1XVP&sig=uuoAHB7tv3ExC0W_xY_dKqnaU9U&hl=ru&ei=d7H2S7rOK4GROMf4-M8I&sa=X&oi=book_result&ct=result&resnum=5&ved=0CDcQ6AEwBA#v=onepage&q=quote%20arrival%20frequency%20distribution&f=false)
Explain independently how. Using an example. There are 3 currency pairs EURUSD, USDJPY, USDCHF, and 3 corresponding bars in each bar 5 ticks. If it is not difficult, let the one who created this algorithm (programmer) draw how the ticks will be arranged by time, in this bar.
Will it be constant, let's say Open EURUSD first tick, then Open USDJPY, USDCHF, then High ... or is there RND() which mixes them by time ?
There are so many people looking for the truth of pips profits, convincing the rest of us that it's not about pips....
In the example with a gap of several figures, no matter how dense the flow is, few people will be able to get into the market and even if they can, the slippage will be monstrous (roughly speaking, it won't work). A tester can get in, if it works in a normal mode.
About getting in, I absolutely agree (100% my supplier has no connection with the terminal, ticks are going, but there is no connection ;-)). But there is a chance to recognise the onset of a gap 1-2 minutes before it starts. I specially did a research, I spent a lot of time on it, believe me, there is a chance. You can check it yourself. Find a piece of history before the gap (preferably Level 2), visualise it like this(I know you can do it). You will visually see what starts to happen, not always, but quite often, it's enough, and if out of 10 gaps you manage to avoid 3-4, it's already great.
By the way, this picture made me think about the possibility of recognising a gap. When it is coming or has happened, it is already late, a little earlier at least for ONE minute... Don't get me right, it is not for pips, I would like to get out of the market in time to cut losses. All the "greats" say about it, cut losses....
- www.mql5.com
We do not plan to provide tick history - it is technical suicide.
You have repeatedly said that there will be no tick history, but it would be possible to provide import of user's tick history.
I think this will calm down especially hot-headed people, a compromise is always better than nothing.
About technical suicide. I don't know what you mean by that, but there are trading platforms that provide ticks. They have somehow solved this problem, and they have solved it long ago. And there is a tick history, downloaded it, loaded it into a tester and do whatever you want. No modelling and, consequently, no bad questions about adequacy....
I don't know how else to convince you, at least make a poll whether traders need it. Only construct the questions correctly. After all, many have not seen and do not understand what it gives. If they use only MT4.
I hope that many will see these questions and support me.
- Would you like to see a chart where there is no flat ?
- Would you like to see a chart where there are no gaps?
- Do YOU consider V.A. Shirev's works absolutely useless and not worthy of attention? He did not analyse bars !!!
And for all this, you need ticks to build correctly and correctly kagi, renko and etc.
You can do a lot of things, this is just the most famous...
This I think will appease some particularly hotheads, compromise is always better than nothing.
No, not hot, but cold, the one that understands that MT does not give me the opportunity to look at the market from a slightly different angle, deprives me of the opportunity to make a qualitative analysis of the TS. Give me ticks, I will cut bars from them as I want. And there will be no loss of information and the eternal question of FLAT or TREND and GAP can become smooth.
Am I the only one who sees and understands this???? (((
- Free trading apps
- Over 8,000 signals for copying
- Economic news for exploring financial markets
You agree to website policy and terms of use
New article The algorithm of ticks’ generation within the strategy tester of the MetaTrader 5 terminal is published:
MetaTrader 5 allows us to simulate automatic trading, within an embedded strategy tester, by using Expert Advisors and the MQL5 language. This type of simulation is called testing of Expert Advisors, and can be implemented using multithreaded optimization, as well as simultaneously on a number of instruments. In order to provide a thorough testing, a generation of ticks based on the available minute history, needs to be performed. This article provides a detailed description of the algorithm, by which the ticks are generated for the historical testing in the MetaTrader 5 client terminal.
Author: MetaQuotes Software Corp.