
Divergence 超赞遮瑕笔 - MetaTrader 5脚本

- 显示:
- 1030
- 等级:
- 已发布:
-
 需要基于此代码的EA交易或指标吗?请在自由职业者服务中订购
进入自由职业者服务
需要基于此代码的EA交易或指标吗?请在自由职业者服务中订购
进入自由职业者服务
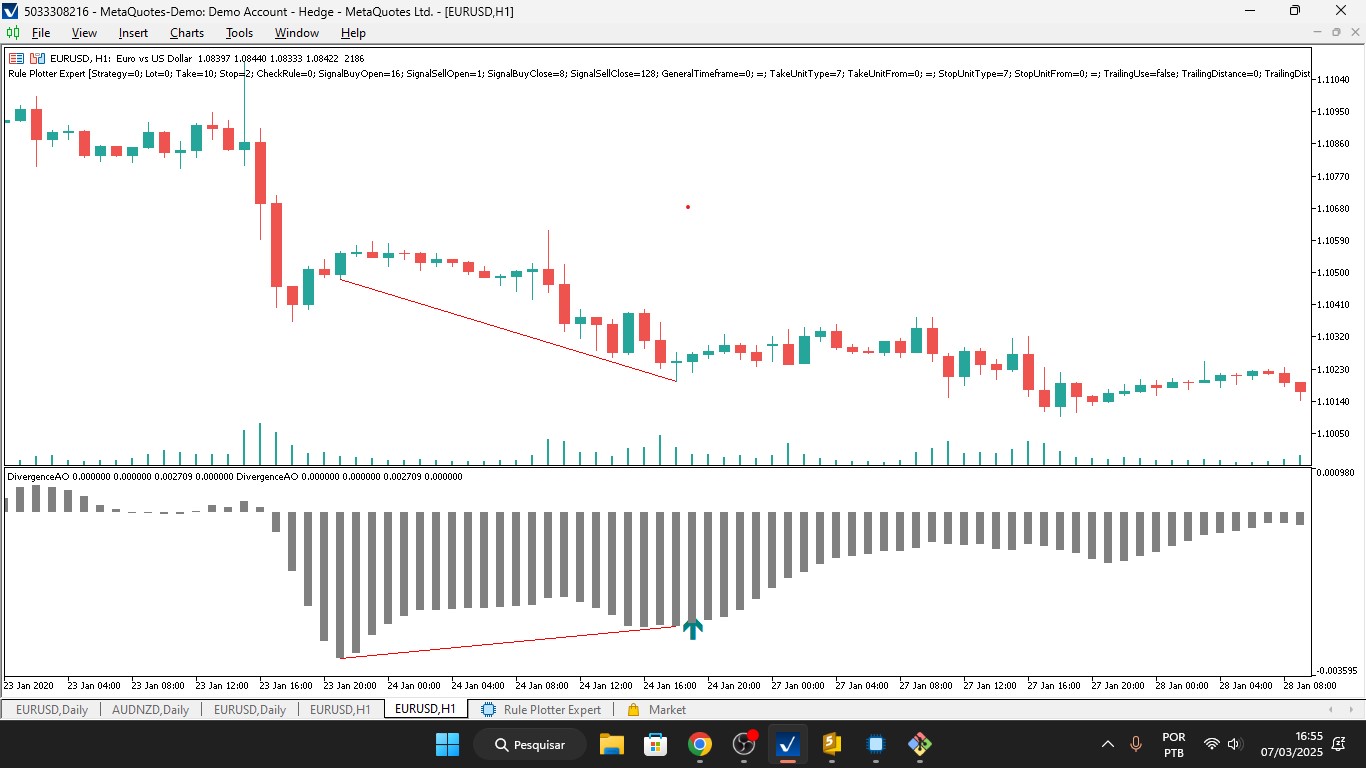
该 MQL5 代码是一个自定义指标,用于检测和显示价格走势与震荡指标 (AO) 之间的背离。当价格走势和震荡指标走势不一致时,就会出现背离,这通常预示着市场可能出现反转或延续。该指标绘制买入/卖出信号、AO 柱状图和趋势线,以突出显示这些背离。

指标的主要特点:
-
背离检测:
- 检测看涨背离(价格出现更低的低点,而 AO 出现更高的低点)。
- 检测看跌背离(价格创出更高的高点,而 AO 创出更低的高点)。
-
可视化:
- 买入/卖出箭头:在图表上绘制箭头,根据背离显示潜在的买入或卖出信号。
- 柱状图:以柱状图显示威严震荡指标 (AO) 值。
- 趋势线: 在图表上绘制趋势线,以突出显示价格与 AO 之间的背离。
-
自定义缓冲区:
- 使用四个缓冲区存储数据:
- 买入缓冲区(BuyBuffer)和卖出缓冲区(SellBuffer)用于存储买入/卖出信号。
- 用于 AO 值的 HistogramBuffer。
- PointsCounterBuffer 用于跟踪对齐点以确认背离。
- 使用四个缓冲区存储数据:
-
动态趋势线绘制:
- 使用 CChartObjectTrend 在图表上动态绘制价格和 AO 的趋势线。
-
交叉检查:
- 包括一个函数(CheckCrossing),用于验证价格或 AO 是否与趋势线交叉,这有助于确认或失效背离。
-
插值
- 使用线性插值(CalculateIntermediateValue)计算两点之间的中间值,用于检查交叉。
工作原理
-
初始化:
- OnInit()函数设置指标缓冲区、分配属性(如颜色、样式)并初始化威严振荡器(AO)句柄。
-
主要计算:
- OnCalculate() 函数处理价格和 AO 数据以检测背离:
- 识别价格和 AO 的底部(更低的低点)和顶部(更高的高点)。
- 通过比较价格和 AO 趋势来检查背离。
- 确认背离时,绘制买入/卖出信号和趋势线。
- OnCalculate() 函数处理价格和 AO 数据以检测背离:
-
背离确认:
- 使用 IsBullishTrend 和 IsBearishTrend 等条件确认背离。
- 确保价格与 AO 趋势线之间没有交叉,以验证背离。
-
动态更新:
- 该指标会根据每个新的条形图动态更新,根据需要重新计算背离并重新绘制趋势线。
关键功能
-
IsBottom() 和 IsTop() :
- 检测数组(价格或 AO)中的局部最小值(底部)和最大值(顶部)。
-
CheckCrossing() :
- 检查价格或 AO 是否与趋势线交叉,这可能会使背离失效。
-
CalculateIntermediateValue(计算中间值) :
- 使用线性插值计算趋势线分析的中间值。
-
AddUniqueCoordinates() : 添加唯一坐标 :
- 确保将唯一坐标添加到数组中,以便绘制趋势线。
-
TotalAligned() :对齐总点数 :
- 计算对齐点的数量,以确认背离强度。
使用方法:
- 该指标对依赖背离策略来识别市场潜在反转或连续性的交易者非常有用。
- 它提供视觉线索(箭头、趋势线和柱状图),帮助交易者做出明智决策。
示例情景:
- 如果价格正在创出更低的 低点(看跌),但 AO 正在创出更高的低点(看涨),则会检测到看涨 背离。该指标将绘制买入箭头 和趋势线,以突出显示背离。
- 相反,如果价格创出更高的 高点(看涨),但 AO 创出更低的高点(看跌),则会检测到看跌背离。该指标将绘制卖出箭头 和趋势线。
技术细节:
- 平台:MetaTrader 5 (MT5)。
- 语言:MQL5。
- 依赖关系: 使用 Awesome Oscillator ( iAO ) 进行计算。
- 自定义对象:使用 CChartObjectTrend 绘制趋势线,使用 CArrayInt 管理坐标数组。
该指标是一款功能强大的工具,可帮助交易者实现背离检测和可视化的自动化,从而节省时间并提高交易策略的准确性。
由MetaQuotes Ltd译自葡萄牙语
原代码: https://www.mql5.com/pt/code/56820
 RSI Expert Advisor - Automated Trading Tool Based on RSI
RSI 专家顾问(EA)是为 MetaTrader 5 (MT5) 平台开发的自动交易工具。该 EA 利用相对强弱指数 (RSI) 来识别买入和卖出信号,并结合风险管理、部分平仓和交易时间限制来优化交易性能。
BreakRevertPro EA Adaptive Trading Edge for Breakout Mean Reversion
BreakRevertPro EA 将突破和均值回归策略与自适应止损/止赢和多时间框架 ATR 跟踪止损相结合,可在波动市场中灵活交易。
ADX Indicator (MQL5)
ADX(平均方向指数)平滑指标通过应用双指数平滑滤波器来增强标准 ADX,以减少噪音并提供更清晰的趋势信号。它绘制了三条线:平滑 +DI(蓝色)、-DI(红色)和 ADX 主线(绿色)。这一改进版本可帮助交易者识别趋势强度和潜在方向变化,减少错误信号。该指标擅长确认既定趋势,并在实际价格反转之前发出动能减弱的警告,因此对趋势跟踪策略和确定最佳进出场点都很有价值。
 GZIP - 解码
从 *.gz 文件中解压 GZIP 压缩包,或从使用这种格式压缩的网站回复中解压 GZIP 压缩包。