|
11+ Jahre
Erfahrung
|
49
Produkte
|
242
Demoversionen
|
|
0
Jobs
|
0
Signale
|
0
Abonnenten
|
"Talent is cheaper than table salt. What separates the talented individual from the successful one is a lot of hard work." - Stephen King. Those few words reflect myself very well. I am probably not the most talented developer in the world but I truly believe in hard work, professional attitude and personal responsibility.
I've never said "it cannot be done". Instead, I try to find the way how to reach the goal. Now you are probably telling yourself that it sounds like old cliche but it's really worth it. If you are afraid of new calls you will not have a chance to learn anything new. Do not forget that "every artist was first an amatuer" - Ralph Waldo Emerson.
Everybody has a dream. My dream is simple - make the world a better place. Even in a small amount but do it! I would like to develop a project which improve people's lives. Because there is nothing better than feeling when your client is successful and satisfied. That five minutes long icy sensation on your back after few days or months spent on a project. That is the real payoff!
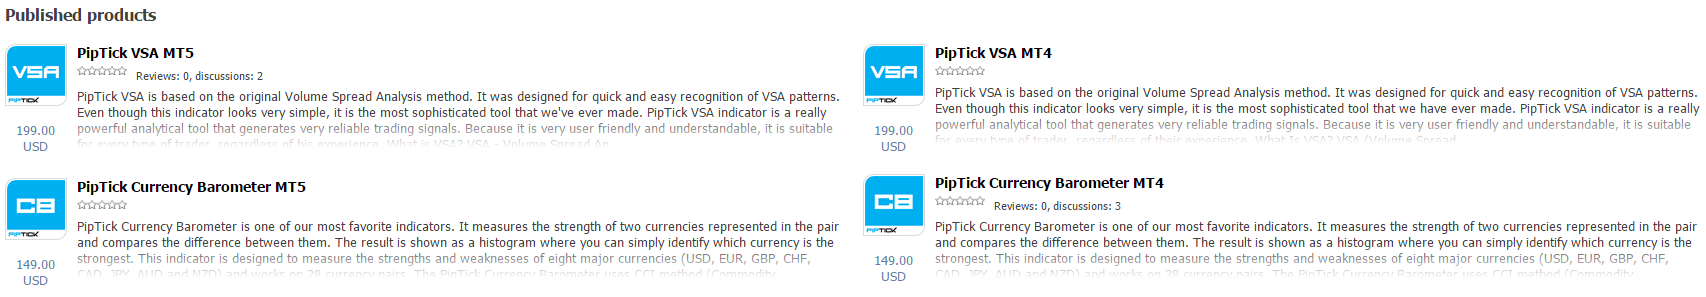
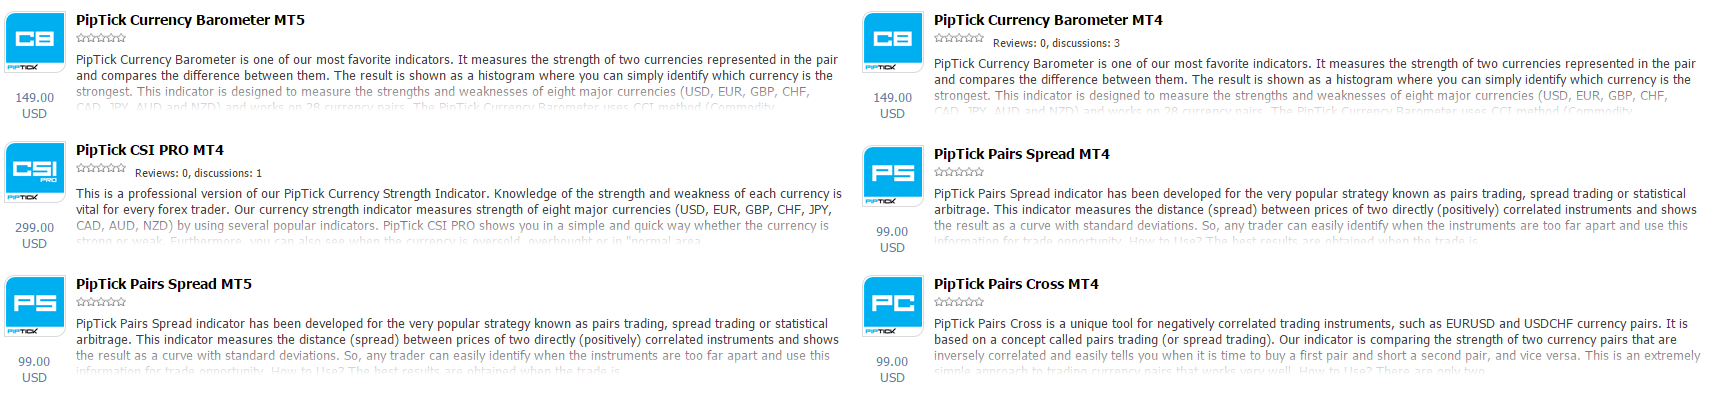
I am a part of the PipTick team developing professional tools for traders. We are focused on the most important financial indicators of the technical analysis instead of useless products for trading. Therefore we have created PipTick portfolio consists high quality products that everyday help to our customers in trading activities.
Our detail oriented team also continuously collects feedback to get knowledge about customers needs and user experience. The information they provide markedly helps us improving our products to be more valuable and capable of bringing befetis to our customers. A long time ago we realized that if PipTick team wants to survive on the competitive field of trading tools, we have to think about our customers as equal partners. As a result their ideas and opinions are very important for our every day work.
We have released PipTick Supply Demand indicator thus we concluded PipTick Indicators Portfolio. According to our plan we proceed to another phase of development - Automated Trading Systems (EAs). We have gained enough experience from both, trading and development world to create a self sufficient PipTick EA Portfolio. Our team has already developed a few successful EAs based on PipTick indicators but they have remained private yet. The main reason is to provide an excellent service of complete, perfectly balanced portfolio supported by effective money and risk management. We work really hard to achieve this goal so you can expect it very soon!
Meanwhile we would like to wish you a successful trading!
PipTick Team
I've never said "it cannot be done". Instead, I try to find the way how to reach the goal. Now you are probably telling yourself that it sounds like old cliche but it's really worth it. If you are afraid of new calls you will not have a chance to learn anything new. Do not forget that "every artist was first an amatuer" - Ralph Waldo Emerson.
Everybody has a dream. My dream is simple - make the world a better place. Even in a small amount but do it! I would like to develop a project which improve people's lives. Because there is nothing better than feeling when your client is successful and satisfied. That five minutes long icy sensation on your back after few days or months spent on a project. That is the real payoff!
I am a part of the PipTick team developing professional tools for traders. We are focused on the most important financial indicators of the technical analysis instead of useless products for trading. Therefore we have created PipTick portfolio consists high quality products that everyday help to our customers in trading activities.
Our detail oriented team also continuously collects feedback to get knowledge about customers needs and user experience. The information they provide markedly helps us improving our products to be more valuable and capable of bringing befetis to our customers. A long time ago we realized that if PipTick team wants to survive on the competitive field of trading tools, we have to think about our customers as equal partners. As a result their ideas and opinions are very important for our every day work.
We have released PipTick Supply Demand indicator thus we concluded PipTick Indicators Portfolio. According to our plan we proceed to another phase of development - Automated Trading Systems (EAs). We have gained enough experience from both, trading and development world to create a self sufficient PipTick EA Portfolio. Our team has already developed a few successful EAs based on PipTick indicators but they have remained private yet. The main reason is to provide an excellent service of complete, perfectly balanced portfolio supported by effective money and risk management. We work really hard to achieve this goal so you can expect it very soon!
Meanwhile we would like to wish you a successful trading!
PipTick Team

Michal Jurnik

Olivier Nomblot
2015.11.14
Merci! We will fight and survive and prosper just like we have for over a 1000 years