• Übersicht
  • Bewertungen (12)
  • Diskussion (44)
  • Neue Funktionen

Netsrac ADR Dashboard

4.91
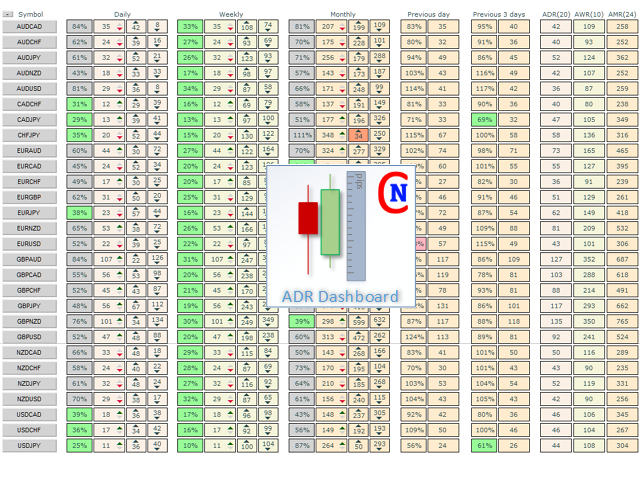
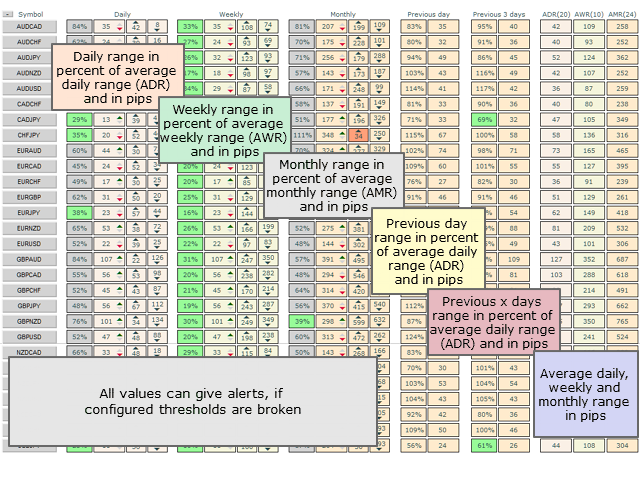
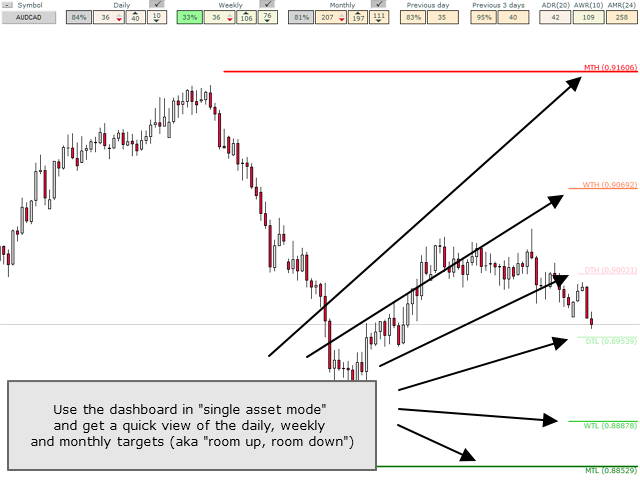
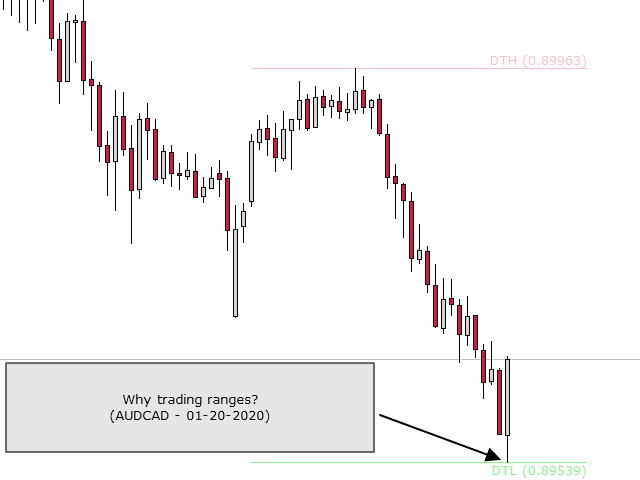
Das Ziel des Dashboards ist es, einen schnellen Überblick über die tägliche, wöchentliche und monatliche Bandbreite der konfigurierten Assets zu geben. Im "Single-Asset-Modus" zeigt Ihnen das Dashboard mögliche Umkehrpunkte direkt im Chart an und macht so Statistiken direkt handelbar. Wird ein konfigurierter Schwellenwert überschritten, kann das Dashboard einen Bildschirm-Alarm, eine Benachrichtigung (an den mobilen MT4) oder eine E-Mail versenden. 

Es gibt verschiedene Möglichkeiten, diese Informationen zu nutzen. Ein Ansatz ist, dass ein Vermögenswert, der fast 100 % seiner durchschnittlichen täglichen Bewegung vollzogen hat, eine Tendenz zur Umkehr aufweist. Ein anderer Ansatz ist die Beobachtung von Vermögenswerten, die im Vergleich zum Durchschnitt eine sehr geringe Volatilität aufweisen. Die Herausforderung besteht nun darin, den Ausbruch aus dieser geringen Volatilität zu handeln.

Dies sind nur zwei mögliche Strategien, für die das Dashboard ein wichtiges Hilfsmittel sein kann. Entdecken Sie die Möglichkeiten!

Eine vollständige Beschreibung der Steuerelemente finden Sie in meinem Blogeintrag (https://www.mql5.com/en/blogs/post/732999).

Hinweis: Dieser Indikator kann nicht im Strategy Tester verwendet werden. Die Demoversion hier vom Markt funktioniert also nicht. Bitte verwenden Sie die kostenlose Version des Indikators zum Testen: https://www.mql5.com/de/market/product/33913

Dies ist die MT4-Version des ADR-Dashboards. Wenn Sie es für MT5 benötigen, gehen Sie zu https://www.mql5.com/en/market/product/52708
Bewertungen 12
lauro1956
4732
lauro1956 2022.01.06 12:41 
 

Very good board mr Pflug ... complete and clear

CasiousD
814
CasiousD 2021.11.16 20:15 
 

Best ADR indicator I have tried. Provides a ton of information that is almost entirely customizable, and all very useful. From determining the lookback periods individually for daily, weekly, and monthly ranges, previous day range and even a customized range of your own, to the customization of the lines drawn on the chart to represent each range, and the indications of how far away price is from the highs or lows of each range...this is such an in depth and valuable indicator. And the ability to use it as a dashboard with multiple instruments or just a single instrument on the current chart is great. Basically, you have unlimited flexibility with this indicator to pretty much set up this ADR indicator to suit whatever your trading style is.

Andrew Lee
2168
Andrew Lee 2020.10.20 23:48 
 

This ADR indicator is a brilliant. Love the dashboard view and the compact single currency option. The information is extremely well laid out and is a great asset to my trading tools. Support from Carsten is amazing - a small display issue I was experiencing was quickly resolved so 5+ stars for support if I could give it.

Empfohlene Produkte
Gold Buster M1 System ist ein professionelles Handelssystem für M1-Charts auf dem XAUUSD-Paar. Aber trotz der Tatsache, dass das System ursprünglich ausschließlich für den Handel mit Gold entwickelt wurde, kann das System auch mit einigen anderen Währungspaaren verwendet werden. Nach dem Kauf gebe ich Ihnen eine Liste von Handelspaaren, die zusätzlich zu XAUUSD mit dem System verwendet werden können, was Ihre Möglichkeiten zur Verwendung dieses Systems erweitert. ALLE ANZEIGEN IM SYSTEM WIEDERHO
Black series MT4
Dmitriy Kashevich
1 (1)
Black series MT4 - The indicator is designed for trading on binary options with Timeframe M1-M5-M15 Multicurrency (Works on cryptocurrency and currency pairs) The signal appears when the candle opens Up to 90% correct signals There is no signal redrawing at all Can be used with other indicators. Good for scalping! In Settings there is: -Indicator working methods -I Allert Arrow color Red signal down Blue signal up Also watch the video how the indicator works and signals
Trend reversal indicator, no repainting. Clean and light rendering There is no alternative buy-sell signal without taking into account the trend. Noise filtering capability. Works with all pairs. Ideal for beginners and experienced traders It is best used on timeframes above the M30, from the beginning of the London session to America. It should be remembered that there are no indicators that are not wrong. Any strategy requires confirmation of its signals. When building your own system, it
MetaTrader indicator that detects WRBs (Wide Range Bodies/Bars) and Hidden Gaps. WRB Hidden Gap MetaTrader indicator  detects WRB and marks it.   WRB can be either a Wide Range Bar (a very large bar) or a Wide Range Body (a candlestick that has a very long body).   WRB alone do not provide much information so the indicator uses WRB to detect Hidden Gaps.   The indicator also displays filled and unfilled Hidden Gaps in a different way, making it easier to view the market situation at a glance
Pokilopers - das fertige Handelssystem wird als Indikator für die Metatrader4-Plattform dargestellt. Wenn Pokilopers einem Chart hinzugefügt werden, analysiert es automatisch die Marktsituation, bestimmt die Richtung des Trends, Widerstandspunkte, den Preisbewegungskanal und andere Marktfaktoren, die die aktuellen und zukünftigen Preisbewegungen beeinflussen. Danach bestimmt Pokilopers automatisch den effektivsten Punkt für die Eröffnung eines Handels und gibt dem Händler ein Signal in Form eine
MACD Divergence
Sergey Deev
2.5 (2)
The indicator detects divergence signals - the divergences between the price peaks and the MACD oscillator values. The signals are displayed as arrows in the additional window and are maintained by the messages in a pop-up window, e-mails and push-notifications. The conditions which formed the signal are displayed by lines on the chart and in the indicator window. Indicator Parameters MacdFast - fast MACD line period MacdSlow - slow MACD line period MacdSignal - MACD signal line period MacdPri
This indicator compares the pips of the current day with the average of pips made in the previous three days. The "Percentage today range" is red if today's figure is less than the range of the previous three days, but turns green when the percentage exceeds 100%. When the range exceeds 100% there are good trading opportunities because we are in the presence of increased volatility of the past three days. Best use with Banks Day Levels indicator. Parameters settings corner (indicator display p
Nas100 Killer V2
Lesedi Oliver Seilane
Nas100 killer V2 (See video of how we test the indicator live) 1000% non-repaint indicator appears on current candlestick. Timeframes: M5, M15, M30, H1, H4. Works on pairs such as (NAS100, US30, SPX500, and Gold) The indicator is strictly for scalping do not hold trades for too long. Orange arrows look for selling opportunities. Light Blue arrows look for buying opportunities. 
VR Cub
Vladimir Pastushak
VR Cub ist ein Indikator für den Erhalt hochwertiger Einstiegspunkte. Der Indikator wurde entwickelt, um mathematische Berechnungen zu erleichtern und die Suche nach Einstiegspunkten in eine Position zu vereinfachen. Die Handelsstrategie, für die der Indikator geschrieben wurde, hat sich seit vielen Jahren bewährt. Ihr großer Vorteil liegt in der Einfachheit der Handelsstrategie, die es auch unerfahrenen Händlern ermöglicht, erfolgreich damit zu handeln. VR Cub berechnet Positionseröffnungspunkt
Asynchronous Trend - this will be the final signal that an uptrend or downtrend has begun or has exhausted itself. This is a great addition to any strategy. Trading based on trend indicators is the simplest and often the most effective. The tool does not take up much space on the chart and does not overload the terminal. You can find many different versions of this tool on the internet, but one of the most effective is the no-redraw version, which you can buy here. The indicator allows you to t
Dieser Indikator wurde entwickelt, um mit der Elliott-Wellen-Theorie auf zwei Arten zu arbeiten: Automatische Arbeitsweise: In diesem Modus erkennt der Indikator automatisch alle fünf Motivwellen im Chart gemäß der Elliott-Wellen-Theorie. Er liefert Prognosen und identifiziert potenzielle Umkehrzonen. Darüber hinaus verfügt er über die Fähigkeit, Warnungen und Push-Nachrichten zu generieren, um Trader über bedeutende Entwicklungen zu informieren. Diese automatisierte Funktionalität vereinfacht d
Gann Line
Sergio D. Rocha
Gann Line indicator is usually used in combination with other Gann’s techniques, some say this is a key point in its success. The Gann line is interpreted as trend indicator, a series of higher highs and higher lows in it's trend are considered bullish, and a series of lower lows and lower highs are bearish. As with other technical indicators, for better results Gann Line should be used in combination with other technical concepts as Gann Fan, fibo, swings, supports and resistance, etc. When rev
Preface: First of all, let me introduce myself. I am a programmer and have been working for over 20 years. 2023 has passed, and our studio has achieved a record of 500 times with 7 manual transmissions. Below, we will show you how to do it through a series of operations. The first step is to model. Modeling is to find a fixed trading pattern. I think everyone has heard of a 2/8 probability, and through this probability, we can further refine it, which means that 1 to 4 is the optimal state. We h
Renegades
Ivan Simonika
Renegade The indicator generates arrows (red and blue by default). The indicator is installed in the usual way on any trading symbol with any time interval. It is an auxiliary tool that is used for technical analysis of the price movement chart in the Forex market. Novice traders have difficulties both with finding an indicator and with its application. Their reason is the lack of technical awareness of ordinary users and the lack of basic knowledge about good trading programs. In Forex trans
This is the complete REX package. It consists of the lite, pro and ULTRA version.  Perfect for beginners and intermediates. REX complete is 100% non repaint. The strategy is based on a mix of different strategies, statistics, including pivot points, oscillators and patterns.  As the trading idea consists of a variety of some classic indicators like Momentum, Williams Percent Range, CCI, Force Index, WPR, DeMarker, CCI, RSI and Stochastic, it is clear that the fundamental indicators have being
Rira Renko
Vitor Palmeira Abbehusen
RENKO on Time Chart This indicator is an enhanced Renko, so you can watch the Renko bricks on the chart to understand price movement more clearly the other improvement is automated box size according to ATR (Average True Range) period you can set the ATR number as you want and the box size of Renko changes automatically based on price movement Inputs Mode: Box size is the input to specify the size of the Renko box you want to print on the chart. This input lets you choose the fixed b
GoldTrend MT4
Sopany Zemmy
5 (1)
GoldTrend MT4 - is  a leading indicator for Gold on MetaTrader 4 - In Update version has been added new ability on USD pairs     ( AUDUSD, EURUSD, GBPUSD, NZDUSD, USDCAD, USDCHF, USDJPY ) - very easy to use , even for beginners - Stoploss and Take Profit provided - no repaint, no redraw and no lagging  When you decide to enter the global market ,  then there is a technical skill you absolutely must have, - which is all about trends . Why - GoldTrend is different from others : Not onl
Breakout FX
David Leander Tschacher
5 (1)
Breakout FX zeichnet Pfeile und gibt Alarme aus, wenn der Preis die letzten n Kerzen über- oder unterschreitet. ️ Breakout FX kann in Expert Advisors verwendet werden. ️ Breakout FX kann bereits vorhandene Trading Strategien verbessern. ️ Breakout FX arbeitet sehr schnell und repainted nicht. Inputs Breakout Range [Candles] Breakout Price Type Arrow Size Enable Alerts Enable Push Notifications Enable Emails
Turtle fast movement
Abdallah Moustafa Hamdy Ahm Abdelrazek
This trend following system was designed by   Dennis Gartman   and   Bill Eckhart , and relies on breakouts of historical highs and lows to take and close trades: it is the complete opposite to the "buy low and sell high" approach. This trend following system was taught to a group of average and normal individuals, and almost everyone turned into a profitable trader. The main rule is   "Trade an N-day breakout and take profits when an M-day high or low is breached (N must me above M)" . Exampl
CCI Currency Strength Meter uses CCI (Commodity Channel Index) to monitor how strong a currency is, or in other words, if it's being bought or sold by the majority compared to the other currencies. If you load this indicator on a chart, it will first display the strength-lines of the currencies (base and counter currency of the chart) with changeable solid lines. Also, you can add up to five additional currencies to the "comparison pool," that already has the base and the profit (counter) curren
Dieser Experte kann paarweise mit demselben Indikator arbeiten. https://www.mql5.com/ru/market/product/34834 Der Experte zeigt nichts auf dem Bildschirm an und handelt nicht. Es führt nur Berechnungen für den Indikator durch. Dies dient zum Speichern Ihrer Computerressourcen. Da der Experte mit Symbolen von Market Watch arbeitet, gibt es keine Möglichkeit, ihn im Tester zu testen. Gebrauchsanweisung: 0) Wählen Sie die erforderlichen Symbole in der Market Watch aus, die im Indikator angezeigt w
FREE
Gioteen Volatility Index (GVI)   - your ultimate solution to overcoming market unpredictability and maximizing trading opportunities. This revolutionary indicator helps you in lowering your losing trades due to choppy market movements. The GVI is designed to measure market volatility, providing you with valuable insights to identify the most favorable trading prospects. Its intuitive interface consists of a dynamic red line representing the volatility index, accompanied by blue line that indicat
Der Smart Strategy Indicator ist ein Handelssystem, mit dem Sie den Markt im Hinblick auf verschiedene Aspekte der technischen Analyse analysieren können. Der erste davon ist ein Preiskanal, der automatisch aufgebaut wird und es dem Händler ermöglicht, die Hauptrichtung der Preisbewegung zu erkennen. Es ermöglicht auch die Analyse des Marktes mithilfe einer Kanalstrategie (Ausbruch und Erholung von Kanallinien). Block 2 ist das SAR-System, das allgemeine Informationen über die Mikrobewegungen
Order Block Hunter
Noha Mohamed Fathy Younes Badr
5 (4)
Order block hunter indicator is the best indicator for  hunt the order blocks that area where there has been a large concentration of limit orders waiting to be executed Order blocks are identified on a chart by observing previous price action and looking for areas where the price experienced significant movement or sudden changes in direction .This indicator does that for you by using very complicated codes and helps you to take the best areas To buy and sell because it make marks at the best a
Market Breaker Updated version 3
Allistair Kabelo Mandow
1 (1)
Features for software Main functions: Accurate entry signals WITH NON REPAINTING! Once a signal appears, it remains valid! This is a significant distinction from other indicators that might provide a signal and then alter it, potentially leading to deposit losses. Now, you can enter the market with higher probability and precision. There's also a function to colour candles after an arrow appears until the target (take profit) is reached or a reversal signal appears . Display of STOP LOSS / TA
DMAX pro
Danny Teoh Kok Keong
DMAX SIGNAL IS VERY POWERFUL TOOL TO HELP YOU ENTRY,ITS CAN DETECT OVERSOLD AND OVERBOUGHT IN FOREX MARKET. ITS CAN TRADE 24 FOREX PAIR IN MARKET, 80% ACCURATE RESULT. MANY TRADER FAIL BECAUSE OF ENTRY POINT AND EXIT POINT , SIGNAL OF DMAX WILL GIVE VERY GOOD SIGNAL TO LET YOU KNOW WHERE TO ENTRY AND EXIT.  RISK MANAGEMENT IS VERY IMPORTANT IN TRADING FOREX, PLEASE DONT RISK OVER 5% PER TRADE IS FORE MARKET
RaysFX Supertrend Bar RaysFX Supertrend Bar è un indicatore personalizzato per MetaTrader 4. Utilizza l'indice di canale delle materie prime (CCI) per generare segnali di trading. L'indicatore mostra dei puntini in una finestra separata sotto il grafico principale per indicare i segnali di trading. Caratteristiche principali: Calcola il CCI per diversi periodi temporali. Visualizza puntini per indicare i segnali di trading. Permette all'utente di modificare i periodi temporali e la distanza tra
Индикатор виртуального эквити, представляемый здесь, может работать по нескольким символам одновременно. Для каждого символа задается направление ( Buy/Sell ) и размер позиции. В настройках также указывается размер предполагаемого депозита, дата открытия и закрытия позиции.   На графике при этом устанавливаются вертикальные линии, обозначающие указываемые в настройках даты.  После установки индикатора на график, можно изменять время открытия и закрытия позиции, передвигая эти линии.   Да
The main idea of this indicator is rates analysis and prediction by Fourier transform. Indicator decomposes exchange rates into main harmonics and calculates their product in future. You may use the indicator as a standalone product, but for better prediction accuracy there is another related indicator - FreqoMaster - which uses FreqoMeterForecast as a backend engine and combines several instances of FreqoMeterForecast for different frequency bands. Parameters: iPeriod - number of bars in the ma
Käufer dieses Produkts erwarben auch
Gann Made Easy
Oleg Rodin
4.85 (82)
Gann Made Easy ist ein professionelles und einfach zu bedienendes Forex-Handelssystem, das auf den besten Handelsprinzipien unter Verwendung der Theorie von Mr. basiert. W.D. Gann. Der Indikator liefert genaue KAUF- und VERKAUFSsignale, einschließlich Stop-Loss- und Take-Profit-Levels. Mit PUSH-Benachrichtigungen können Sie auch unterwegs handeln. Bitte kontaktieren Sie mich nach dem Kauf! Ich werde meine Handelstipps und tolle Bonusindikatoren kostenlos mit Ihnen teilen! Wahrscheinlich haben Si
TPSpro RFI Levels
Roman Podpora
4.82 (22)
Umkehr der ersten Impulsniveaus (RFI)       ANWEISUNGEN       Russland       -        ENG    Die Empfehlung basiert auf dem Indikator -   TPSpro   TREND PRO -   Version MT5 Die wichtigsten Elemente in der Branche sind entweder in Zonen oder in der Fabrik enthalten, oder sie führen zu einer Lösung bei einem Kauf oder dem Verkauf eines anderen Instruments. Wenn viele Menschen ihre Rechte nicht auf dem Händlerkonto verschlüsseln, werden die Folgen nicht schnell genug sein. Ich habe es damit abgesc
Atomic Analyst
Issam Kassas
5 (2)
Zunächst einmal ist es erwähnenswert, dass dieser Handelsindikator nicht neu malt, nicht neu zeichnet und keine Verzögerung aufweist, was ihn sowohl für manuellen als auch für Roboterhandel ideal macht. Benutzerhandbuch: Einstellungen, Eingaben und Strategie. Der Atom-Analyst ist ein PA-Preisaktionsindikator, der die Stärke und das Momentum des Preises nutzt, um einen besseren Vorteil auf dem Markt zu finden. Ausgestattet mit fortschrittlichen Filtern, die helfen, Rauschen und falsche Signale z
TPSproTREND PrO
Roman Podpora
4.79 (19)
TPSpro TREND PRO   ist ein Trendindikator, der den Markt automatisch analysiert und Informationen über den Trend und jede seiner Änderungen liefert sowie Signale für den Einstieg in Geschäfte ohne Neuzeichnung gibt! Der Indikator verwendet jede Kerze und analysiert sie separat. bezieht sich auf verschiedene Impulse – Aufwärts- oder Abwärtsimpuls. Exakte Einstiegspunkte in Transaktionen für Währungen, Krypto, Metalle, Aktien, Indizes! Version MT5                   VOLLSTÄNDIGE BESCHREIBUNG DES
Scalper Inside PRO
Alexey Minkov
4.73 (56)
An exclusive indicator that utilizes an innovative algorithm to swiftly and accurately determine the market trend. The indicator automatically calculates opening, closing, and profit levels, providing detailed trading statistics. With these features, you can choose the most appropriate trading instrument for the current market conditions. Additionally, you can easily integrate your own arrow indicators into Scalper Inside Pro to quickly evaluate their statistics and profitability. Scalper Inside
FX Power MT4 NG
Daniel Stein
5 (12)
Erhalten Sie Ihr tägliches Marktupdate mit Details und Screenshots über unser Morning Briefing hier auf mql5 und auf Telegram ! FX Power MT4 NG ist die nächste Generation unseres langjährig sehr beliebten Währungsstärkemessers FX Power. Und was bietet dieser Stärkezähler der nächsten Generation? Alles, was Sie am ursprünglichen FX Power geliebt haben PLUS GOLD/XAU-Stärkeanalyse Noch präzisere Berechnungsergebnisse Individuell konfigurierbare Analysezeiträume Anpassbares Berechnungslimit für noc
Derzeit 20% Rabatt! Die beste Lösung für jeden Neueinsteiger oder Expert Händler! Dieses Dashboard arbeitet mit 28 Währungspaaren. Es basiert auf 2 unserer Hauptindikatoren (Advanced Currency Strength 28 und Advanced Currency Impulse). Es bietet einen hervorragenden Überblick über den gesamten Forex-Markt. Es zeigt die Werte der Advanced Currency Strength, die Veränderungsrate der Währungen und die Signale für 28 Devisenpaare in allen (9) Zeitrahmen. Stellen Sie sich vor, wie sich Ihr Hande
FX Volume
Daniel Stein
4.58 (33)
Erhalten Sie Ihr tägliches Marktupdate mit Details und Screenshots über unser Morning Briefing hier auf mql5 und auf Telegram ! FX Volume ist der ERSTE und EINZIGE Volumenindikator, der einen ECHTEN Einblick in die Marktstimmung aus Sicht eines Brokers bietet. Es bietet fantastische Einblicke in die Positionierung von institutionellen Marktteilnehmern, wie z.B. Brokern, auf dem Forex-Markt, viel schneller als COT-Berichte. Diese Informationen direkt auf Ihrem Chart zu sehen, ist der wahre Game
DERZEIT 31% RABATT! Die beste Lösung für jeden Newbie oder Expert Trader! Dieser Indikator ist ein einzigartiges, qualitativ hochwertiges und erschwingliches Handelsinstrument, da wir eine Reihe von proprietären Funktionen und eine geheime Formel eingebaut haben. Mit nur EINEM Chart liefert er Alerts für alle 28 Währungspaare. Stellen Sie sich vor, wie sich Ihr Handel verbessern wird, weil Sie in der Lage sind, den genauen Auslösepunkt eines neuen Trends oder einer Scalping-Gelegenheit zu e
Enigmera
Ivan Stefanov
5 (3)
ENIGMERA: Der Kern des Marktes https://www.enigmera.com Einführung Dieser Indikator und dieses Handelssystem sind ein bemerkenswerter Ansatz für die Finanzmärkte. ENIGMERA nutzt die fraktalen Zyklen zur genauen Berechnung von Unterstützungs- und Widerstandsniveaus. Er zeigt die echte Akkumulationsphase an und gibt Richtung und Ziele vor.  Ein System, das funktioniert, egal ob wir uns in einem Trend oder in einer Korrektur befinden.  Wie funktioniert es? ENIGMERA besteht aus drei Linien: der
DERZEIT 26% RABATT Die beste Lösung für jeden Newbie oder Expert Trader! Dieser Indikator ist ein einzigartiges, qualitativ hochwertiges und erschwingliches Trading-Tool, da wir eine Reihe von proprietären Funktionen und eine neue Formel integriert haben. Mit nur EINEM Chart können Sie die Währungsstärke für 28 Forex-Paare ablesen! Stellen Sie sich vor, wie sich Ihr Handel verbessern wird, weil Sie in der Lage sind, den genauen Auslösungspunkt eines neuen Trends oder einer Scalping-Gelegenh
Bomb Bank Signal
Igor Pereira Calil
5 (1)
Bombenbanksignal: Ihr Vertrauensindikator in MetaTrader 4 Bomb Bank Signal ist ein leistungsstarker Indikator für MetaTrader 4, der entwickelt wurde, um die relevantesten Trends auf dem Finanzmarkt zu identifizieren. Wenn Sie nach einem Tool suchen, das Bewegungen genau vorhersieht, ist die Bomb Bank der Verbündete, den Sie brauchen. So funktioniert es: Dieser Indikator kombiniert drei unterschiedliche Methoden – Volumenanalyse, Kerzenschließungen und symmetrischer Trend –, um Kauf- und V
Trend Cutter
Oleg Rodin
5 (2)
Trend Cutter ist ein Trendindikator, der für jeden Zeitrahmen verwendet werden kann, einschließlich der niedrigeren Zeitrahmen wie M1 und M5. Der Indikator ist ideal für Händler, die den Intraday-Handel bevorzugen, und wird auch für diejenigen hilfreich sein, die den langfristigen Handel bevorzugen. Sie können diesen Indikator als Basis für Ihr Handelssystem oder als eigenständige Handelslösung verwenden. Der Indikator bietet alle Arten von Warnungen, einschließlich PUSH-Benachrichtigungen. Der
TakePropips Donchian Trend Pro
Eric John Pajarillaga Aldana
4.44 (16)
TakePropips Donchian Trend Pro   (MT4) ist ein leistungsstarkes und effektives Tool, das mithilfe des Donchian-Kanals automatisch die Richtung des Trends erkennt und Ihnen Handelssignale für den Ein- und Ausstieg liefert! Dieser Multifunktionsindikator umfasst einen Trendscanner, Handelssignale, ein statistisches Panel, einen Screener, Handelssitzungen und ein Dashboard für den Verlauf von Warnungen. Es wurde entwickelt, um Ihnen Handelssignale zu liefern und Ihnen Stunden beim Analysieren der C
Gold Channel is a volatility-based indicator, developed with a specific timing algorithm for the XAUUSD pair, which consists of finding possible corrections in the market. This indicator shows two outer lines, an inner line (retracement line) and an arrow sign, where the theory of the channel is to help identify overbought and oversold conditions in the market. The market price will generally fall between the boundaries of the channel. If prices touch or move outside the channel it is a tra
Advanced Supply Demand
Bernhard Schweigert
4.91 (294)
Derzeit 33% Rabatt! Die beste Lösung für jeden Anfänger oder erfahrenen Händler! Dieser Indikator ist ein einzigartiges, qualitativ hochwertiges und erschwingliches Trading-Tool, da wir eine Reihe von proprietären Funktionen und eine neue Formel integriert haben. Mit diesem Update werden Sie in der Lage sein, doppelte Zeitrahmenzonen anzuzeigen. Sie können nicht nur einen höheren TF (Zeitrahmen) anzeigen, sondern sowohl den Chart-TF als auch den höheren TF: SHOWING NESTED ZONES. Alle Supply Dema
Currency Strength Wizard ist ein sehr leistungsstarker Indikator, der Ihnen eine Komplettlösung für erfolgreichen Handel bietet. Der Indikator berechnet die Stärke dieses oder jenes Forex-Paares anhand der Daten aller Währungen in mehreren Zeitrahmen. Diese Daten werden in Form von benutzerfreundlichen Währungsindizes und Währungsstärkelinien dargestellt, anhand derer Sie die Stärke dieser oder jener Währung erkennen können. Sie müssen lediglich den Indikator an das Diagramm anhängen, mit dem Si
PRO Renko System ist ein hochpräzises Handelssystem, das speziell für den Handel mit RENKO-Charts entwickelt wurde. Dies ist ein universelles System, das auf verschiedene Handelsinstrumente angewendet werden kann. Das System neutralisiert effektiv so genannte Marktgeräusche, die Ihnen Zugang zu genauen Umkehrsignalen geben. Der Indikator ist sehr einfach zu bedienen und hat nur einen Parameter, der für die Signalerzeugung verantwortlich ist. Sie können das Tool einfach an jedes Handelsinstr
M1 Arrow
Oleg Rodin
4.73 (15)
Eine Intraday-Strategie, die auf zwei Grundprinzipien des Marktes basiert. Der Algorithmus basiert auf der Analyse von Volumina und Preiswellen mit zusätzlichen Filtern. Der intelligente Algorithmus des Indikators gibt nur dann ein Signal, wenn sich zwei Marktfaktoren zu einem vereinen. Der Indikator berechnet Wellen eines bestimmten Bereichs auf dem M1-Diagramm unter Verwendung der Daten des höheren Zeitrahmens. Und um die Welle zu bestätigen, verwendet der Indikator eine Volumenanalyse. Dieser
PZ Day Trading
PZ TRADING SLU
3.67 (3)
Dieser Indikator erkennt Preisumkehrungen im Zick-Zack, wobei nur Preisaktionsanalysen und ein Donchian-Kanal verwendet werden. Es wurde speziell für den kurzfristigen Handel entwickelt, ohne dass ein Nachlackieren oder ein Backpainting erforderlich ist. Es ist ein fantastisches Werkzeug für clevere Trader, die darauf abzielen, das Timing ihrer Operationen zu verbessern. [ Installationsanleitung | Update-Anleitung | Fehlerbehebung | FAQ | Alle Produkte ] Erstaunlich einfach zu handeln Es bi
Supply and Demand Dashboard PRO
Bernhard Schweigert
4.8 (20)
Derzeit 20% reduziert! Dieses Dashboard ist eine sehr leistungsfähige Software, die mit mehreren Symbolen und bis zu 9 Zeitrahmen arbeitet. Es basiert auf unserem Hauptindikator (Beste Bewertungen: Advanced Supply Demand ).   Das Dashboard gibt einen guten Überblick. Es zeigt: Gefilterte Angebots- und Nachfragewerte einschließlich der Zonenstärkebewertung, Pips-Abstände zu/und innerhalb von Zonen, Es hebt verschachtelte Zonen hervor, Es gibt 4 Arten von Alarmen für die gewählten Symbole in
True Direction Oscillator
Muhammad Elbermawi
4.86 (362)
Oder (TDO), ein Index, der die Preisänderungsrate nach dem Prinzip des „ Pure Momentum “ misst. Wenn ein Wertpapierkurs von 10 auf 15 steigt, beträgt die Preisänderungsrate 150%, aber wenn er von 15 auf 10 zurückgeht, beträgt die Preisänderungsrate nur 33,3%. Aus diesem Grund liefern Indikatoren der technischen Analyse wie "Price Rate of Change" (ROC) oder "Momentum" höhere Werte für aufsteigende Kursbewegungen als solche für absteigende. TDO behebt dieses Problem, um Händlern zu helfen, das Mo
Entdecken Sie das Geheimnis des erfolgreichen Forex -Handels mit unserem benutzerdefinierten MT4 -Indikator! Haben Sie sich jemals gefragt, wie Sie Erfolg auf dem Forex -Markt erzielen können und gleichzeitig Gewinne erzielen und gleichzeitig das Risiko minimieren können? Hier ist die Antwort, nach der Sie gesucht haben! Erlauben Sie uns, unseren proprietären MT4 -Indikator vorzustellen, der Ihren Handelsansatz revolutionieren wird. Einzigartige Vielseitigkeit Unser Indikator ist speziell
BITTE LESEN SIE DIE INFORMATIONEN UNTEN, BEVOR SIE DAS PRODUKT KAUFEN! Apollo Pips PLUS SP ist ein einzigartiges Produkt! ES IST FÜR ALLE, DIE MEINEN NEUEN „APOLLO PIPS“-INDIKATOR PLUS „SUPER PACK“-BONUS MIT ZUGRIFF AUF ALLE MEINE HANDELSINDIKATOREN ERHALTEN MÖCHTEN! Mit dem Kauf des Produkts Apollo Pips PLUS SP erwerben Sie tatsächlich eine völlig neue Version meines Apollo Pips-Indikators. Diese Version des Indikators verfügt über einen verbesserten Algorithmus und einen benutzerfreundlichen P
Currency Strength Exotics
Bernhard Schweigert
4.87 (30)
Stärke von 8 Währungen plus EIN EXOTISCHES Paar oder Rohstoffe oder Indexe! Jedes Produkt kann als 9. Linie hinzugefügt werden. Fügen Sie Rohstoffe, Indexes oder exotische Währungen hinzu (Gold, Silber, Öl, DAX, US30, MXN, TRY, CNH ...). Eine neue noch nie dagewesene TRADING STRATEGIE  !!! Dieser Indikator ist einzigartig, weil wir eine Reihe von proprietäre Funktionen und neue Formeln eingebaut haben. Es funktioniert für alle Zeitrahmen. Basierend auf neuen zugrunde liegenden Algorithmen ist
Dieses Dashboard zeigt die neuesten verfügbaren harmonischen Muster für die ausgewählten Symbole, so dass Sie Zeit sparen und effizienter sein werden / MT5-Version . Kostenloser Indikator: Basic Harmonic Pattern Spalten des Indikators Symbol: die ausgewählten Symbole werden angezeigt Trend: bullish oder bearish Pattern : Art des Musters (Gartley, Schmetterling, Fledermaus, Krabbe, Hai, Cypher oder ABCD) Entry : Einstiegskurs SL: Stop-Loss-Kurs TP1: 1. Take-Profit-Kurs TP2: 2. Gewinnmitnah
MetaBands M4
Vahidreza Heidar Gholami
5 (2)
MetaBands verwendet leistungsstarke und einzigartige Algorithmen, um Kanäle zu zeichnen und Trends zu erkennen, sodass es Tradern potenzielle Punkte für den Einstieg und Ausstieg aus Trades bieten kann. Es ist ein Kanalindikator sowie ein leistungsstarker Trendindikator. Es umfasst verschiedene Arten von Kanälen, die einfach durch Verwendung der Eingabeparameter zusammengeführt werden können. MetaBands verwendet alle Arten von Warnmeldungen, um Benutzer über Marktereignisse zu informieren. Funkt
XQ Indicator MetaTrader 4
Marzena Maria Szmit
3.67 (3)
Step into the realm of Forex trading with confidence and precision using XQ, a cutting-edge Forex indicator designed to elevate your trading game to unprecedented heights. Whether you're a seasoned trader or just stepping into the world of currency exchange,   XQ Forex Indicator   empowers you with the insights and signals needed to make informed trading decisions. The signal conditions are a combination of three indicators, and XQ Forex Indicator only display  medium and long-term trends . The
Shepherd Harmonic Pattern
Abdullah Alrai
4.65 (49)
Dieser Indikator erkennt harmonische Muster, die manuell oder automatisch auf dem Chart gezeichnet wurden. Sie können das Benutzerhandbuch unter diesem Link einsehen: Fügen Sie Ihre Bewertung hinzu und kontaktieren Sie uns, um es zu erhalten. Es gibt eine kostenlose Version, um dieses Produkt auf MT4 auszuprobieren. Sie können es verwenden, um Gartley- und Nenstar-Muster zu erkennen: https://www.mql5.com/en/market/product/30181 Sie können die vollständige MT4-Version von kaufen: https://www.mql5
Automated Trendlines
Georgios Kalomoiropoulos
5 (16)
Trendlinien sind das wichtigste Werkzeug der technischen Analyse im Devisenhandel. Leider zeichnen die meisten Händler sie nicht richtig. Der automatische Trendlinien-Indikator ist ein professionelles Tool für ernsthafte Trader, das Ihnen hilft, die Trendbewegung der Märkte zu visualisieren. Es gibt zwei Arten von Trendlinien Bullische Trendlinien und Bärische Trendlinien. Im Aufwärtstrend wird die Forex-Trendlinie durch die niedrigsten Swing-Punkte der Preisbewegung gezogen. Wenn man m
Weitere Produkte dieses Autors
Netsrac PAAIOS
Carsten Pflug
5 (5)
PAAIOS steht für Price Action All In One Solution. Und genau das ist der Zweck des Indikators. Er soll Ihnen ein Werkzeug an die Hand geben, mit dem Sie Ihr Trading maßgeblich verbessern können, weil Sie die maßgeblichen Informationen auf einen Blick erhalten. Der Indikator vereinfacht die Suche nach starken Signalen. Er zeigt Trendlinien, Nachfrage- und Angebotszonen aus frei wählbaren Zeitrahmen an. Merkmale * erkennt Angebots- und Nachfragezonen für mehrere Zeitrahmen * erkennt und zeigt T
Netsrac Correlation Trader
Carsten Pflug
4.67 (12)
Der Netsrac Correlation Trader (NCT) ist ein sehr leistungsfähiges Tool für den Handel mit positiv und negativ korrelierten Währungspaaren mit abgesicherten Aufträgen.  1) Er sucht nach positiv und negativ korrelierten Paaren 2) Es zeigt Ihnen ein Signal an, wenn die korrelierten Paare nicht im Gleichgewicht sind 3) Es kann einige oder alle korrelierten Paare mit den von Ihnen eingestellten Zeitrahmen und Signalwerten "autotraden" (mit Vorsicht behandeln) 4) Es kann die korrekte Lot-Größe ein
This is the free version of the Supply&Demand + Trendline + Trend tool. This version works only with EURCHF! You find the full version here:  https://www.mql5.com/en/market/product/67274 PAAIOS stands for   Price   Action   All   In   One   Solution. And that is the purpose of the Indicator. It should give you a tool to improve your trading decisively because you get the crucial information at a glance. The indicator simplifies the search for strong signals. It shows trend lines, demand and s
FREE
The intention of the dashboard is to provide a quick overview of the daily, weekly and monthly range of configured assets. In "single asset mode" the dashboard shows you possible reversal points directly in the chart, thus making statistics directly tradable. If a configured threshold is exceeded, the dashboard can send a screen alert, a notification (to the mobile MT5) or an email.  There are various ways of using this information. One approach is that an asset that has completed nearly 100%
The Netsrac Correlation Trade Indicator (NCTI) was created to trade correlations between different assets. NCTI offers five different strategies to do this. Five different correlation trading strategies with two or three assets Fast access your assets with one click via asset buttons Your profit/loss at a glance Configurable alerts via screen or mobile You can use the indicator with every timeframe. Higher timeframes give fewer but better signals. If you have some questions or suggestions - plea
FREE
The intention of the dashboard is to provide a quick overview of the daily, weekly and monthly range of configured assets. In "single asset mode" the dashboard shows you possible reversal points directly in the chart, thus making statistics directly tradable. If a configured threshold is exceeded, the dashboard can send a screen alert, a notification (to the mobile MT4) or an email.  There are various ways of using this information. One approach is that an asset that has completed nearly 100% o
FREE
Das Dashboard soll dabei helfen, eine schnelle Übersicht über die Korrelationen verschiedener Underlyings zueinander zu bekommen. Dafür werden die Werte-Reihen nach der Pearson-Methode miteinander verglichen. Das Ergebnis ist der Wert der Korrelation (in Prozent).   Verwendung Für die Korrelation gibt es unterschiedliche Methoden. Beim so genannten Carry-Trade wird ein Underlying gekauft. Ein möglichst hoch negativ korreliertes Paar wird verkauft. Eine wesentliche Rolle spielen bei dieser Meth
FREE
Netsrac SuPrEs
Carsten Pflug
5 (1)
Sinn Der SuPrEs-Indikator zeigt den Abstand zur nächsten horizontalen Linie an, deren Namen mit dem konfigurierten Präfix (siehe Optionen) beginnt. Verwendung Zeichne Widerstände und Unterstützungen in den Chart und lasse Dich vom Indikator warnen, sobald ein konfigurierter Abstand unterschritten wird. Nutze den Präfix, um neben Standard-Linien auch Linien anderer Indikatoren mit einer Alarmfunktion zu versehen (siehe Screenshot mit Pivot-Indikator). Anzeige des Indikators Der Indikator z
FREE
The Netsrac Correlation Trade Indicator (NCTI) was created to trade correlations between different assets. NCTI offers five different strategies to do this. Five different correlation trading strategies with two or three assets Fast access your assets with one click via asset buttons Your profit/loss at a glance Configurable alerts via screen or mobile You can use the indicator with every timeframe. Higher timeframes give fewer but better signals. If you have some questions or suggestions - plea
FREE
Netsrac Correlation Trader (NCT)   is a very powerful tool to trade positive and negative correlated currency pairs with hedged orders.  NCT is doing many things for you: 1) It looks for positive and negative correlated pairs 2) It shows you a signal, if the correlated pairs are not in balance 3) It can "autotrade" some or all correlated pairs with your setting of time frames and signal-values (handle with care) 4) It can set the correct lot size to have pip value and daily range based opti
FREE
Mit dem SR Dashboard erhalten Sie ein mächtiges Werkzeug zur Kontrolle von einigen der wichtigsten Informationen im Trading. Stellen Sie sich ein Setup ganz nach ihrer Strategie zusammen und lassen sich informieren, sobald dieses Setup gültig ist. Vergeben Sie verschiedene Punkte auf ausgewählte Bedingungen. Wählen Sie aus Trend, Average Daily Range, Moving Averages, Pivot (Daily, Weekly, Monthly), Highs und Lows sowie Candlestick-Pattern. Hinweis: Dieser Indikator ist die freie Version des Ne
FREE
Das Dashboard hilft dabei, eine schnelle Übersicht über die Korrelationen verschiedener Underlyings zueinander zu bekommen. Dafür werden die Werte-Reihen nach der Pearson-Methode miteinander verglichen. Das Ergebnis ist der Wert der Korrelation (in Prozent).   Verwendung Für die Korrelation gibt es unterschiedliche Methoden. Beim so genannten Carry-Trade wird ein Underlying gekauft. Ein möglichst hoch negativ korreliertes Paar wird verkauft. Eine wesentliche Rolle spielen bei dieser Methode di
Mit dem SR Dashboard erhalten Sie ein mächtiges Werkzeug zur Kontrolle von einigen der wichtigsten Informationen im Trading. Stellen Sie sich ein Setup ganz nach ihrer Strategie zusammen und lassen sich informieren, sobald dieses Setup gültig ist. Vergeben Sie verschiedene Punkte auf ausgewählte Bedingungen. Wählen Sie aus Trend, Average Daily Range, Moving Averages, Pivot (Daily, Weekly, Monthly), Highs und Lows sowie Candlestick-Pattern. Hinweis: Dieser Indikator kann nicht im Strategietester
The Netsrac Correlation Trade Indicator (NCTI) was created to trade correlations between different assets. NCTI offers five different strategies to do this. Five different correlation trading strategies with two or three assets Fast access your assets with one click via asset buttons Your profit/loss at a glance Configurable alerts via screen or mobile You can use the indicator with every timeframe. Higher timeframes give fewer but better signals. If you have some questions or suggestions - ple
Netsrac "Supply and Demand Easy" is a small but highly specialized tool for quickly finding supply & demand zones without frills. It shows the next supply and demand zone in the current timeframe. Highly efficient and fast. Works perfectly with the Netsrac "Supply and Demand Dashboard" (https://www.mql5.com/en/market/product/96511 ) Controls Variable Description (SD01) Supply color Set your color for supply zones (default is LightCoral) (SD02) Demand color Set your color for demand zones (defa
The Netsrac Supply&Demand Dashboard shows you at a glance where relevant zones are located on your favorite assets. Open your chart directly from the dashboard and trade zones that really matter. Features Finds the next relevant supply and demand zone and displays the distance to this zone (in pips) Finds and displays the zones in three different timeframes Calculates a trend indicator for the current and past candle for each configured time frame Opens a chart with your chart template direct
The Netsrac Correlation Trade Indicator (NCTI) was created to trade correlations between different assets. NCTI offers five different strategies to do this. Five different correlation trading strategies with two or three assets Fast access your assets with one click via asset buttons Your profit/loss at a glance Configurable alerts via screen or mobile You can use the indicator with every timeframe. Higher timeframes give fewer but better signals. If you have some questions or suggestions - pl
With the SR Dashboard, you get a powerful tool to control some of the most important information in trading. Assemble a setup according to your strategy and get informed as soon as this setup is valid. Assign scores to defined conditions and let the Dashboard find them. Choose from Trend, Average Daily Range, RSI, Moving Averages, Pivot (Daily, Weekly, Monthly), Highs and Lows, Candlestick Patterns. What can you do with this tool? Use the dashboard as a powerful tool for your discretionary trad
THE flexible Expert Advisor for Custom Trading Strategies in MetaTrader 5 The Netsrac TradeAid expert is a powerful tool for traders looking to develop their own trading strategies in MetaTrader 5. With this expert advisor, you can combine a variety of technical indicators and trading rules with a simple "If This (AND This...) Then That" logic to create tailored trading strategies that match your individual preferences. You don´t need any knowledge in MQL5 coding language to build your own exper
Auswahl:
wdbnz1
84
wdbnz1 2023.03.20 06:10 
 

A very good indicator, well-designed, and easy to use. Carsten responds to questions efficiently and is extremely helpful in clarifying the functionality of the Dashboard. I have been successfully live trading with the Dashboard for over a year and can highly recommend it. Good value for money!

lauro1956
4732
lauro1956 2022.01.06 12:41 
 

Very good board mr Pflug ... complete and clear

CasiousD
814
CasiousD 2021.11.16 20:15 
 

Best ADR indicator I have tried. Provides a ton of information that is almost entirely customizable, and all very useful. From determining the lookback periods individually for daily, weekly, and monthly ranges, previous day range and even a customized range of your own, to the customization of the lines drawn on the chart to represent each range, and the indications of how far away price is from the highs or lows of each range...this is such an in depth and valuable indicator. And the ability to use it as a dashboard with multiple instruments or just a single instrument on the current chart is great. Basically, you have unlimited flexibility with this indicator to pretty much set up this ADR indicator to suit whatever your trading style is.

Andrew Lee
2168
Andrew Lee 2020.10.20 23:48 
 

This ADR indicator is a brilliant. Love the dashboard view and the compact single currency option. The information is extremely well laid out and is a great asset to my trading tools. Support from Carsten is amazing - a small display issue I was experiencing was quickly resolved so 5+ stars for support if I could give it.

John Greydanus
566
John Greydanus 2020.08.28 05:31 
 

I totally agree with previous user comments = I am quite familiar with ADR indicators, and this is without a doubt the best and most powerful ADR indicator I have seen thus far. It takes a little time to learn how everything works, but the developer is very helpful to answer questions and to provide solutions if needed. I have complete confidence in this product and in the ability of the coder (Carsten) who created it. Highly recommended! And would like to add, not only most excellent as a Dashboard but also when applied to each individual chart. The price levels are great when in a trade, as daily and weekly target levels are clearly displayed, can't be beaten. I'll be buying for MT5 as well.

Ralph
230
Ralph 2020.08.17 04:45 
 

Phenomenal indicator, I highly recommend it!!

De Airelle
50
De Airelle 2020.05.28 03:55 
 

This is phenomenal!

Devonish
3027
Devonish 2020.04.21 13:19 
 

I think this is a very good tool, although it's taking a little time for me to understand the principles of how to apply this to my technical trading. Carsten is a very helpful developer who responds quickly. Update: Sept'20: New additions to the tool are very useful. Thank you for continued ongoing support and development.

Daniele Tosolini
295
Daniele Tosolini 2020.01.23 11:54 
 

Great dashboard!!! It still have some things to improve but it's a really good instrument I like it very much!!!

Carsten is also very helpful !!

cvdestyfx
2702
cvdestyfx 2020.01.22 17:56 
 

I am quite familiar with ADR indicators, and this is without a doubt the best and most powerful ADR indicator I have seen thus far.

It takes a little time to learn how everything works, but the developer is very helpful to answer questions and to provide solutions if needed.

I have complete confidence in this product and in the ability of the coder (Carsten) who created it. Highly recommended!

Ikechukwu Emmanuel Okaro
983
Ikechukwu Emmanuel Okaro 2019.07.23 12:41 
 

This indicator is a must have for any serious trader. Welldone Carsten!

Arnel Arnao
2004
Arnel Arnao 2019.07.03 07:37 
 

Excellent Indicator. If you can add another column for the underlying trend short term and long term trend this will be a perfect indicator for level traders.

Antwort auf eine Rezension
Version 4.6 2023.04.20
- Fixed an issue with a division by zero in a special configuration
Version 4.5 2023.04.12
- Fixed an issue with the handling of warning colors (thanks John!)
Version 4.4 2022.11.08
fix: Button object remains on chart after removing the indicator
Version 4.3 2021.09.09
- small fix in the graphical representation to make the ADR Dashboard work better with "Netsrac PAAIOS"
Version 4.2 2021.03.15
- fixed "division by zero" error
Version 4.1 2021.01.26
- visual backtest mode in the full version (show past periods in the chart for a visual backtest) - see blog for details
Version 4.0 2020.10.20
New: UHD mode for high screen resolutions
Version 3.9 2020.09.24
- New Targetmode "locked range": If you are using ADR-Dashboard in "Single Asset Mode" as a tool to find trading targets, this mode can be very helpful. It uses the exact value for the daily/weekly/monthly range, depending on the position of price in relation to the daily/weekly/monthly open. Check it out (Variable TAM) - it is a very cool feature.
Version 3.8 2020.08.18
Fixed: bug which can produce "division by zero - error"
Version 3.7 2020.06.02
- Small fix: Headings now can have it's own color (some people had problems with the colors)
Version 3.6 2020.04.20
- fix on the prefix/suffix function
Version 3.5 2020.04.20
- Added variable to input prefix and suffix
Version 3.4 2020.04.19
- New variable OF17 to change the dashboard resolution to fit better on small screens
Version 3.3 2020.02.28
* alert system improvements - new lock alert mode for less annoying alerts
* the values for the average daily, weekly and monthly range are now updated regularly
* some detail improvements
Version 3.2 2020.01.22
* bugfix: target line label remains on chart after closing the indicator
* bugfix: if using a template with ADR-Dashboard in single asset mode, the name of the asset is not changing
* suggestion implemented: choose, if the indicator opens new charts in the same or in a new window
Version 3.1 2020.01.21
* Fixed a small bug in the alert system (alert time out had no effect in dashboard mode).
Version 3.0 2020.01.21
* completely redesigned - please read the description and my blog entry
Version 2.4 2019.04.10
- Bugfix and improvements in Alert-Engine
Version 2.3 2019.04.01
- New Single Asset Mode to use the dashboard for one asset on the chart
- optional: projection of Daily Target High/Low (DTH/DTL) in the chart (in Single Asset Mode)
- Redesign of the Alert-Engine (now fewer but better alerts)
Version 2.2 2019.03.19
- improvement in the view of Daily Target High/Low
Version 2.1 2019.02.11
- "unbenutzten" Bereich nach oben und unten hinzugefügt, um eine potenzielle Umkehrung leichter erkennen zu können
Version 2.0 2019.01.18
- Vergleich einer konfigurierbaren ADR mit der Referenz-ADR möglich
- Erweiterung des Dashboard um Prozentwerte für jeden Vergleichswert
- Freier konfigurierbare Darstellung