• Übersicht
  • Bewertungen (39)
  • Diskussion (372)
  • Neue Funktionen

Blahtech Supply Demand

4.63

Was: $299  Now: $99  

Supply Demand uses previous price action to identify potential imbalances between buyers and sellers. The key is to identify the better odds zones, not just the untouched ones.

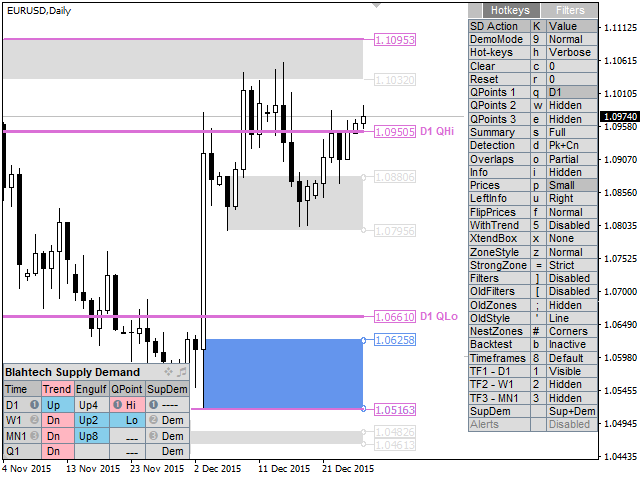
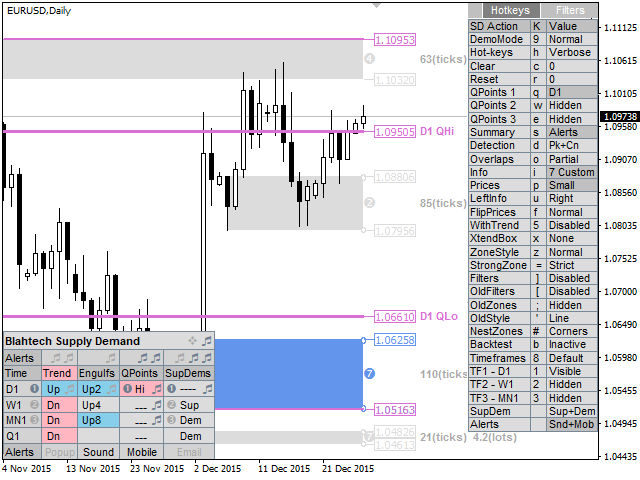
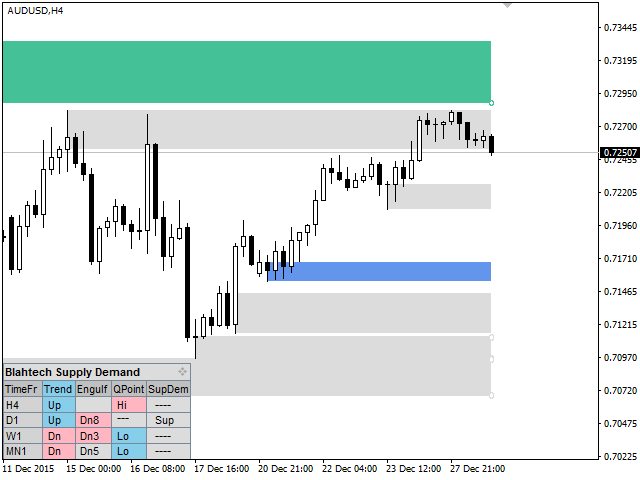
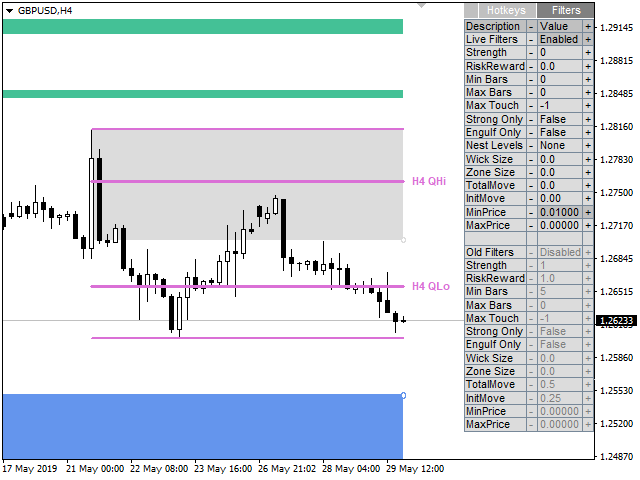
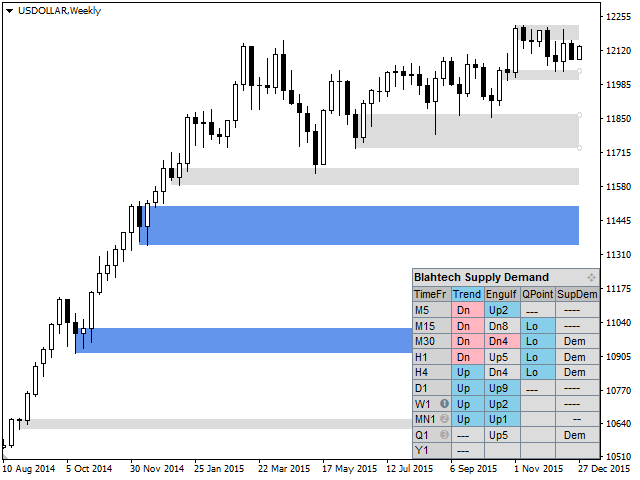
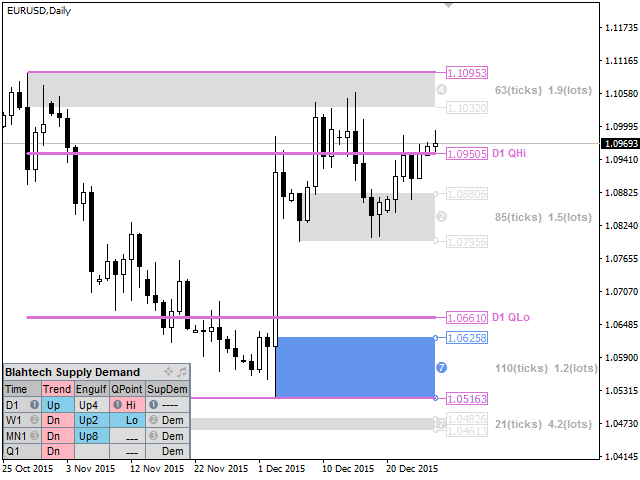
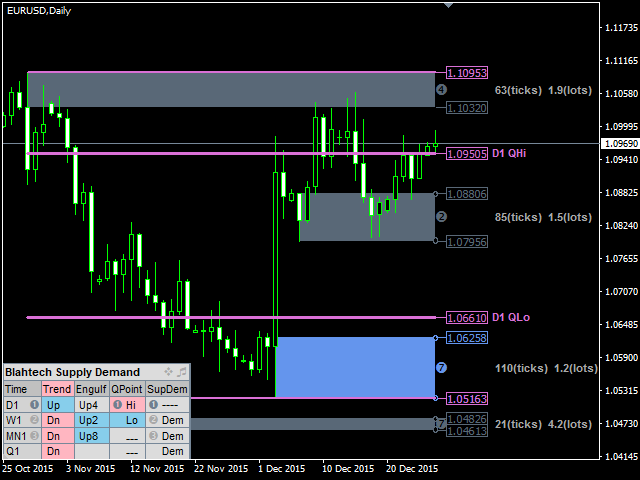
Blahtech Supply Demand indicator delivers functionality previously unavailable on any trading platform. This 4-in-1 indicator not only highlights the higher probability zones using a multi-criteria strength engine, but also combines it with multi-timeframe trend analysis, previously confirmed swings and engulfing detectors. Driven by an easy to use interface and innovative backtest mode this indicator is a must-have for all supply demand traders.

Links [ Install | Update | Documentation & Training ]


Feature Highlights

  • Multi-timeframe display
  • Backtest directly on the chart
  • Summary panel
  • Multi-timeframe trend analysis
  • Confirmed swings (High and Low QPoints)
  • Zone strength engine (seven criteria)

Feature Highlights continued...

  • Advanced level detection (peaks, consolidations, drop-base-drops)
  • Fast access hot-keys
  • Alerts
  • Engulfing detector
  • Visibility Filters
  • Old zones (broken levels or trend changes)
  • Highlight of Nested zones

Input Parameters

 - Download documentation using link above for details


    Bewertungen 20
    Zakarias
    48
    Zakarias 2021.11.03 13:05 
     

    Awesome, i like the idea and its running very very good

    David Cooper
    38
    David Cooper 2021.08.03 03:32 
     

    A leading indicator very well done. Remember to wait for price to come to you.

    YHW1022221880
    170
    YHW1022221880 2021.07.27 12:19 
     

    Good supply and demand indicators

    Empfohlene Produkte
    BoxChart MT4
    Evgeny Shevtsov
    4.57 (7)
    The market is unfair if only because 10% of participants manage 90% of funds. An ordinary trader has slim changes to stand against these "vultures". This problem can be solved. You just need to be among these 10%, learn to predict their intentions and move with them. Volume is the only preemptive factor that faultlessly works on any timeframe and symbol. First, the volume appears and is accumulated, and only then the price moves. The price moves from one volume to another. Areas of volume accumu
    33 USD
    Blahtech Market Profile
    Blahtech Limited
    4.61 (18)
    Was: $249  Now: $99   Market Profile defines a number of day types that can help the trader to determine market behaviour. A key feature is the Value Area, representing the range of price action where 70% of trading took place. Understanding the Value Area can give traders valuable insight into market direction and establish the higher odds trade. It is an excellent addition to any system you may be using. Blahtech Limited presents their Market Profile indicator for the MetaTrader community. Ins
    99 USD
    MarketProfile EForex
    Veridiana Adorno Kendrick
    Market Profile Shows where the price has spent more time, highlighting important levels that can be used in trading. It is a powerful tool which is designed to take the fundamental components which comprise every market; price/volume/time, and visually display their relationship in real-time as the market develops for a pre-determined time period. Very powerful tool!
    30 USD
    Der Indikator erstellt aktuelle Notierungen, die mit historischen verglichen werden können, und auf dieser Grundlage eine Preisbewegungsprognose erstellen. Der Indikator verfügt über ein Textfeld zur schnellen Navigation zum gewünschten Datum. Optionen: Symbol - Auswahl des Symbols, das der Indikator anzeigen soll; SymbolPeriod - Auswahl des Zeitraums, aus dem der Indikator Daten aufnimmt; IndicatorColor - Indikatorfarbe; HorisontalShift - Verschiebung der vom Indikator gezeichnet
    55 USD
    Ein technischer Indikator, der seine Messwerte anhand des Handelsvolumens berechnet. In Form eines Histogramms zeigt es die Akkumulation der Stärke der Bewegung des Handelsinstruments. Es verfügt über unabhängige Berechnungssysteme für bullische und bärische Richtungen. Funktioniert mit allen Handelsinstrumenten und Zeitrahmen. Kann jedes Handelssystem ergänzen. Der Indikator zeichnet seine Werte nicht neu, die Signale erscheinen auf der aktuellen Kerze. Es ist einfach zu bedienen, lädt das Di
    79 USD
    VolumeProfile
    Robert Hess
    3.8 (5)
    Beschreibung: Das Volumen Profil zeigt detailierte Informationen von historischen trading Aktivitäten in bestimmten Preisbereichen (Markt Profil).  Damit finden Sie die Zonen mit den besten Preisen im Markt und erlangen so einen entscheidenen Vorteil gegenüber anderen Marktteilnehmern. Support: Zögern Sie bitte nicht, mich über die MQL5 Platform zu kontaktieren. Ich bin sehr dankbar für den Bericht von aufgetretenen Fehlern, sodass ich den Indikator verbessern kann. Bitte geben Sie auch gerne
    99 USD
    Market Profile 3
    Hussien Abdeltwab Hussien Ryad
    4 (4)
    Market Profile 3 MetaTrader 4 indicator  — is a classic Market Profile implementation that can show the price density over time, outlining the most important price levels, value area, and control value of a given trading session. This indicator can be attached to timeframes between M1 and D1 and will show the Market Profile for daily, weekly, monthly, or even intraday sessions. Lower timeframes offer higher precision. Higher timeframes are recommended for better visibility. It is also possible t
    FREE
    The Chaikin Oscillator is a technical indicator developed by Marc Chaikin that combines price and volume data to measure the accumulation and distribution of a financial instrument. It aims to identify potential buying and selling opportunities in the market. The Chaikin Oscillator is calculated by subtracting a 10-day exponential moving average of the Accumulation Distribution Line (ADL) from a 3-day exponential moving average of the ADL. Here's how to use the Chaikin Oscillator indicator in tr
    250 USD
    Simply The Best Pro
    Szymon Palczynski
    5 (1)
    This indicator displays the histogram and arrows on chart. When Simple The Best Pro are placed on a chart, they identify the trend.  The color of may be blue or red. The blue color stands for upside moves and the red color stands for downside trends. The indicator offers to set Stop Loss (SL) and  Take Profit (TP)  setting. The default value is ATR. Indicator has automatic optimization. The STB is a unique indicator that shows the tendency (button Bars) of a particular signals. The STB tells us
    78 USD
    Daily Candle Predictor ist ein Indikator, der den Schlusskurs einer Kerze vorhersagt. Der Indikator ist in erster Linie für die Verwendung in D1-Charts gedacht. Dieser Indikator eignet sich sowohl für den traditionellen Devisenhandel als auch für den Handel mit binären Optionen. Der Indikator kann als eigenständiges Handelssystem oder als Ergänzung zu Ihrem bestehenden Handelssystem verwendet werden. Dieser Indikator analysiert die aktuelle Kerze und berechnet bestimmte Stärkefaktoren innerhalb
    65 USD
    BoxInside MT4
    Evgeny Shevtsov
    4.56 (9)
    This indicator calculates the volume profile and places labels that correspond to the VAH, VAL and POC levels, for each candle individually. Indicator operation features The indicator works on the timeframes from M5 to MN, but it uses the history data of smaller periods: M1 - for periods from M5 to H1, M5 - for the H4 period, M30 - for the D1 period, H4 - for the W1 period, D1 - for the MN period. The color and location of the VAL, VAH and POC labels on the current candle are considered to be
    FREE
    Forex Market Profile (kurz FMP) Wenn Sie dies lieber in einem Live-Chart sehen möchten, anstatt die Beschreibung zu lesen, können Sie hier sofort eine kostenlose Demo herunterladen. Was das nicht ist: FMP ist nicht die klassische buchstabencodierte TPO-Anzeige , zeigt nicht die Berechnung des gesamten Diagrammdatenprofils an und segmentiert das Diagramm nicht in Perioden und berechnet diese nicht. Was es macht : Am wichtigsten ist, dass der FMP-Indikator Daten verarbeitet, die sich zwis
    FREE
    The indicator allows you to trade binary options. The recommended time frame is М1 and the expiration time is 1,2,3 minutes. The indicator suitable for auto and manual trading. A possible signal is specified as a arrows above/under a candle. You should wait until the candle closes! Arrows are not re-painted Trade sessions: TOKYO section (Half-end) Currency pairs: USD/JPY Working time frame: M1 Expiration time: 1,2,3 minutes. The indicator also shows good results when using the martingale strateg
    FREE
    Volume by Price MT4
    Brian Collard
    5 (13)
    Was: $259 Now: $120 — The Volume by Price Indicator for MetaTrader 4 features Volume Profile and Market Profile TPO (Time Price Opportunity). Get valuable insights out of currencies, equities and commodities data. Gain an edge trading financial markets. Volume and TPO histogram bar and line charts. Volume Footprint charts. TPO letter and block marker charts including split structures. Versatile segmentation and compositing methods. Static, dynamic and flexible ranges with relative and/or absolu
    120 USD
    The indicator analyzes the change in the minimum and maximum prices of the previous bars fixing the entrance of the big players. If the change (delta) increases, a signal is displayed on the graph in the form of an arrow. At the same time, virtual trade on history is carried out. In case of a repeat of the signal, the positions are increased (refilling). Thus the lot of positions can differ. The results of virtual trading in the form of losses / losses, profitability, drawdown and transaction li
    30 USD
    Dollar mint indicator is a special workmanship with years of experience in forex.   Dollar mint ea is a fully non repaint indicator optimised with price action data such that once it gives you a signal t . The indicator   can be used to trade anything on the mt4 with much ease. Benefits ; Fully non repaint Use in any timeframe Use in all the available tradable assets on mt4 Best to use on h4. It generates fully analysed buy and sell signals based on trend and also filters out retracement
    38 USD
    The Magneto Volume Trigger indicator is designed for determining the volume confirmed by the candlestick pattern and predicting the trend tendency. Indicator setup and use The calculation of values is affected by two parameters - Period and Gate . The lower the value of Gate , the higher the sensitivity of the indicator. Period allows making a sample of data for the specified number of candles. The lower the value of Period , the more the indicator is adapted to the current market conditions.
    79 USD
    VR Calculate Martingale
    Vladimir Pastushak
    5 (5)
    Der VR Calculate Martingale Indikator ist ein leistungsstarker Rechner von Aufträgen und Positionen, um Gewinn oder Verlust zu berechnen. Mit Hilfe eines Rechners von Aufträgen und Positionen kann der Trader den durchschnittlichen Kurs von Devisen, Aktien oder Kryptowährungen berechnen. Schon jetzt können Sie den Indikator verbinden und starten Sie die Funktion der Überlagerung virtueller Aufträge auf Ihre realen Aufträge und Positionen. Indem Sie zusätzliche virtuelle Positionen erstellen, könn
    34 USD
    UPD1 Volume Pixel
    Vitaliy Kuznetsov
    5 (3)
    Der Indikator findet basierend auf den angegebenen Koeffizienten ein niedriges, hohes, extremes Volumen und färbt es in den angegebenen Farben. Es ersetzt die standardmäßige Volumenzeichnung im Metatrader-Terminal. Kerzen können auch in der Farbe des Volumens gefärbt werden. Bei Kerzen mit extremem Volumen wird das maximale horizontale Volumen (cluster/POC) bestimmt. Je nach Standort (Schieben, neutral, Stoppen) hat der Cluster auch seine eigene Farbe. Wenn sich der Cluster im Schatten befindet
    39 USD
    VolumeDeltaM1
    Stanislav Korotky
    3.67 (3)
    This indicator provides tick volume delta analysis on M1 timeframe. It monitors up and down ticks and sums them up as separate volumes for buys and sells, as well as their delta volumes, and volume clusters on price scale within a specified number of bars. This indicator complements VolumeDelta , which uses similar algorithms but does not process ticks and therefore cannot work on M1. VolumeDelta can show its signals on entire history because it reads M1 volumes for calculations on higher timefr
    30 USD
    The   Visual Volatility Clustering   indicator clusters the market based on volatility. The indicator does not redraw and gives accurate data, does not use closing prices. Uses the opening prices or the highs or lows of the previous completed bar. Therefore, all information will be clear and unambiguous. The essence of the indicator is to divide the price market into certain areas according to a similar type of volatility. This can be done in any way. In this example, the indicator is configure
    109 USD
    Max LotSize
    Luis Alberto Atuncar Sanchez
    5 (2)
    LotSize Indicator Discover the appropriate lot size to use in your trades based on the available margin. This indicator provides valuable information for risk management. If the indicator shows a value of 0, it means that your balance or available margin is insufficient for trading. It is important to maintain adequate margin levels for safe trading practices. This indicator is exclusively designed for the MT4 platform, a popular and reliable trading platform in the market. With the LotSize Indi
    FREE
    Master Scalping M1 ist ein innovativer Indikator, der einen Algorithmus verwendet, um den Trend schnell und genau zu bestimmen. Der Indikator berechnet den Zeitpunkt zum Öffnen und Schließen von Positionen, die Indikatoralgorithmen ermöglichen es Ihnen, die idealen Zeitpunkte für den Einstieg in einen Handel (Kauf oder Verkauf eines Vermögenswerts) zu finden, was den Erfolg von Transaktionen für die meisten Händler erhöht. Vorteile des Indikators: Einfach zu bedienen, überladen Sie das Diagramm
    30 USD
    Der Indikator berechnet und zeichnet automatisch Fibonacci-Unterstützungs- und Widerstandsniveaus - eines der effektivsten Werkzeuge für die Marktanalyse. Die Berechnung verwendet die gemittelten Preisdaten für den ausgewählten Zeitraum und Zeitraum. Das Minimum und das Maximum für diesen Zeitraum gelten als Beginn und Ende der Bewegung. Fibonacci-Niveaus ermöglichen es Ihnen, potenzielle Referenzpunkte zu erkennen, um die sich die Preisbewegung verlangsamen oder umkehren kann, dh sie werden ver
    30 USD
    VN Trade Panel II
    Vyacheslav Nekipelov
    4 (1)
    The new version of the trading panel, which now has the ability to separately close Buy and Sell orders, display targets for all orders on the chart, as well as the ability to use the panel to trade with brokers working on the FIFO rule. Also, the new version adds option buttons for separate management of open orders. It has a convenient visualized interface and intuitive control without a lot of additional tabs to which traders have to be distracted and switch their attention. Thanks to this
    35 USD
    Cumulative Delta MT4
    Evgeny Shevtsov
    4.69 (35)
    The indicator analyzes the volume scale and splits it into two components - seller volumes and buyer volumes, and also calculates the delta and cumulative delta. The indicator does not flicker or redraw, its calculation and plotting are performed fairly quickly, while using the data from the smaller (relative to the current) periods. The indicator operation modes can be switched using the Mode input variable: Buy - display only the buyer volumes. Sell - display only the seller volumes. BuySell -
    FREE
    This panel is a part of the SupDem-Pro trading system and is used to search for the best opportunities for any available instruments. Which can be selected manually in the Market Watch (open it with CTRL + M). Using this trading panel in combination with ShvedSupDem-Pro_Zone allows to analyze multiple currency pairs with a single click. The panel allows to load any instruments from the Market Watch, from 6 major currency pairs up to all instruments (480). The indicator parameters Button Width
    30 USD
    The Market Profile Indicator for MT4 displays the price levels and zones where increased trading activity happens. These zones with substantial forex trading activity provide the forex traders with the best entry levels, support, and resistance levels. Moreover, price levels indicate the best reversal zones. As a result, forex traders can identify BULLISH and BEARISH market trends and BUY and SELL entry points as well as the best reversal points. The indicator works well in all intraday timefram
    50 USD
    This indicator is a conventional analytical tool for tick volumes changes. It calculates tick volumes for buys and sells separately, and their delta on every bar, and displays volumes by price clusters (cells) within a specified bar (usually the latest one). The algorithm used internally is the same as in the indicator VolumeDelta , but results are shown as cumulative volume delta bars (candlesticks). Analogous indicator for MetaTrader 5 exists - VolumeDeltaBars . This is a limited substitution
    30 USD
    Trend Ray
    Andriy Sydoruk
    The indicator shows the potential trend direction by cyclical-wave dependence. Thus, all the rays of the intersection will be optimal rays, in the direction of which the price is expected to move, taking into account the indicator period. Rays can be used as a direction for potential market movement. But we must not forget that the approach must be comprehensive, the indicator signals require additional information to enter the market.
    59 USD
    Käufer dieses Produkts erwarben auch
    TrendMaestro
    Stefano Frisetti
    5 (2)
    note: this indicator is for METATRADER4, if you want the version for METATRADER5 this is the link: TRENDMAESTRO recognizes a new TREND in the bud, he never makes mistakes. The certainty of identifying a new TREND is priceless. DESCRIPTION TRENDMAESTRO identifies a new TREND in the bud, this indicator examines the volatility, volumes and momentum to identify the moment in which there is an explosion of one or more of these data and therefore the moment in which prices have strong probability of f
    777 USD
    DERZEIT 26% RABATT Die beste Lösung für jeden Newbie oder Expert Trader! Dieser Indikator ist ein einzigartiges, qualitativ hochwertiges und erschwingliches Trading-Tool, da wir eine Reihe von proprietären Funktionen und eine neue Formel integriert haben. Mit nur EINEM Chart können Sie die Währungsstärke für 28 Forex-Paare ablesen! Stellen Sie sich vor, wie sich Ihr Handel verbessern wird, weil Sie in der Lage sind, den genauen Auslösungspunkt eines neuen Trends oder einer Scalping-Gelegenh
    148 USD
    TPSpro RFI Levels
    Roman Podpora
    5 (12)
    Reversal First Impulse levels (RFI) - are the maximum volume levels/areas that turn the market around, so they play a critical role in future trading decisions. The logic behind the movement of any chart is that the price moves from the first impulse level (RFI) to the first impulse level (RFI) of the past trend. The first impulse level (RFI) is the most powerful level during a trend reversal, which forms a reversal zone. The first impulse level from the reversal of the previous movement is also
    145 USD
    TPSproTREND PrO
    Roman Podpora
    5 (15)
    TPSpro TRENDPRO  - is a trend indicator that automatically analyzes the market and provides information about the trend and each of its changes, as well as giving signals for entering trades without redrawing! The indicator uses each candle, analyzing them separately. referring to different impulses - up or down impulse. Exact entry points into transactions for currencies, crypto, metals, stocks, indices!  - To maximize the potential and learn how to trade using this indicator, read the full des
    135 USD
    Derzeit 20% Rabatt! Die beste Lösung für jeden Neueinsteiger oder Expert Händler! Dieses Dashboard arbeitet mit 28 Währungspaaren. Es basiert auf 2 unserer Hauptindikatoren (Advanced Currency Strength 28 und Advanced Currency Impulse). Es bietet einen hervorragenden Überblick über den gesamten Forex-Markt. Es zeigt die Werte der Advanced Currency Strength, die Veränderungsrate der Währungen und die Signale für 28 Devisenpaare in allen (9) Zeitrahmen. Stellen Sie sich vor, wie sich Ihr Hande
    199 USD
    Wir stellen vor       Quantum Trend Sniper Indicator   , der bahnbrechende MQL5-Indikator, der die Art und Weise, wie Sie Trendumkehrungen erkennen und handeln, verändert! Entwickelt von einem Team erfahrener Händler mit über 13 Jahren Handelserfahrung,       Quantum Trend Sniper-Indikator       wurde entwickelt, um Ihre Trading-Reise mit seiner innovativen Methode zur Identifizierung von Trendumkehrungen mit extrem hoher Genauigkeit auf ein neues Niveau zu heben. ***Kaufe Quantum Trend Snipe
    149.99 USD
    Advanced Supply Demand
    Bernhard Schweigert
    4.92 (309)
    Derzeit 33% Rabatt! Die beste Lösung für jeden Anfänger oder erfahrenen Händler! Dieser Indikator ist ein einzigartiges, qualitativ hochwertiges und erschwingliches Trading-Tool, da wir eine Reihe von proprietären Funktionen und eine neue Formel integriert haben. Mit diesem Update werden Sie in der Lage sein, doppelte Zeitrahmenzonen anzuzeigen. Sie können nicht nur einen höheren TF (Zeitrahmen) anzeigen, sondern sowohl den Chart-TF als auch den höheren TF: SHOWING NESTED ZONES. Alle Supply Dema
    148 USD
    Quantum Breakout Indicator PRO
    Bogdan Ion Puscasu
    4.96 (25)
    Wir stellen vor       Quantum Breakout PRO   , der bahnbrechende MQL5-Indikator, der die Art und Weise, wie Sie mit Breakout-Zonen handeln, verändert!   Quantum Breakout PRO   wurde von einem Team erfahrener Händler mit über 13 Jahren Handelserfahrung entwickelt und soll Ihre Handelsreise mit seiner innovativen und dynamischen Breakout-Zonen-Strategie auf ein neues Niveau bringen. Der Quantum Breakout Indicator zeigt Ihnen Signalpfeile auf Breakout-Zonen mit 5 Gewinnzielzonen und Stop-Loss
    149.99 USD
    GOLD Impulse with Alert
    Bernhard Schweigert
    4.56 (9)
    Dieser Indikator ist eine hervorragende Kombination aus unseren 2 Produkten Advanced Currency IMPULSE with ALERT  +   Currency Strength Exotics . Es funktioniert für alle Zeitrahmen und zeigt grafisch Impulse der Stärke oder Schwäche für die 8 wichtigsten Währungen plus ein Symbol! Dieser Indikator ist darauf spezialisiert, die Beschleunigung der Währungsstärke für beliebige Symbole wie Gold, Exotische Paare, Rohstoffe, Indizes oder Futures anzuzeigen. Als erster seiner Art kann jedes Sym
    149 USD
    PZ Swing Trading
    PZ TRADING SLU
    5 (4)
    Swing Trading ist der erste Indikator, der Schwankungen in Trendrichtung und mögliche Umkehrschwankungen erkennt. Es wird der in der Handelsliteratur weit verbreitete Baseline-Swing-Trading-Ansatz verwendet. Der Indikator untersucht mehrere Preis- und Zeitvektoren, um die aggregierte Trendrichtung zu verfolgen und erkennt Situationen, in denen der Markt überverkauft oder überkauft ist und zur Korrektur bereit ist. [ Installationsanleitung | Update-Anleitung | Fehlerbehebung | FAQ | Alle Produkte
    249 USD
    Scalper Inside PRO
    Alexey Minkov
    4.74 (54)
    GET 10% OFF NOW! An exclusive indicator that utilizes an innovative algorithm to swiftly and accurately determine the market trend. The indicator automatically calculates opening, closing, and profit levels, providing detailed trading statistics. With these features, you can choose the most appropriate trading instrument for the current market conditions. Additionally, you can easily integrate your own arrow indicators into Scalper Inside Pro to quickly evaluate their statistics and profitabilit
    119 USD
    FX Power MT4 NG
    Daniel Stein
    5 (7)
    Erhalten Sie Ihr tägliches Marktupdate mit Details und Screenshots über unser Morning Briefing hier auf mql5 und auf Telegram ! FX Power MT4 NG ist die nächste Generation unseres langjährig sehr beliebten Währungsstärkemessers FX Power. Und was bietet dieser Stärkezähler der nächsten Generation? Alles, was Sie am ursprünglichen FX Power geliebt haben PLUS GOLD/XAU-Stärkeanalyse Noch präzisere Berechnungsergebnisse Individuell konfigurierbare Analysezeiträume Anpassbares Berechnungslimit für noc
    149 USD
    THISE INDICATOR NOT WORK ON FREE DEMO. there is a protocol to work it. target finder indicator is a forecast the find probably targets.up and down. to use thise indicator, there is a protocol,i explain below. first load indicator  you will see blue and red lines. on the left side look to the higher value of line ,and draw horizantal line on top it. and on the right side see the LEVEL NUMBER. Finding UP TARGET h=put that level number  m=1 b=1 pres ok. you will see on the screen ,on top right ,r
    100 USD
    PTS Precision Index Oscillator V2
    PrecisionTradingSystems
    5 (1)
    Der Precision Index Oscillator (Pi-Osc) von Roger Medcalf von Precision Trading Systems Version 2 wurde sorgfältig neu codiert, um extrem schnell auf Ihrem Chart geladen zu werden, und es wurden einige andere technische Verbesserungen eingearbeitet, um die Erfahrung zu verbessern. Pi-Osc wurde entwickelt, um genaue Handelstimingsignale bereitzustellen, die darauf abzielen, extreme Erschöpfungspunkte zu finden, an die die Märkte gezwungen werden, um einfach die Stops aller herauszunehmen.
    147.50 USD
    TakePropips Donchian Trend Pro
    Eric John Pajarillaga Aldana
    4.81 (16)
    TakePropips Donchian Trend Pro   (MT4) ist ein leistungsstarkes und effektives Tool, das mithilfe des Donchian-Kanals automatisch die Richtung des Trends erkennt und Ihnen Handelssignale für den Ein- und Ausstieg liefert! Dieser Multifunktionsindikator umfasst einen Trendscanner, Handelssignale, ein statistisches Panel, einen Screener, Handelssitzungen und ein Dashboard für den Verlauf von Warnungen. Es wurde entwickelt, um Ihnen Handelssignale zu liefern und Ihnen Stunden beim Analysieren der C
    199 USD
    Currency Strength Exotics
    Bernhard Schweigert
    4.88 (33)
    Stärke von 8 Währungen plus EIN EXOTISCHES Paar oder Rohstoffe oder Indexe! Jedes Produkt kann als 9. Linie hinzugefügt werden. Fügen Sie Rohstoffe, Indexes oder exotische Währungen hinzu (Gold, Silber, Öl, DAX, US30, MXN, TRY, CNH ...). Eine neue noch nie dagewesene TRADING STRATEGIE  !!! Dieser Indikator ist einzigartig, weil wir eine Reihe von proprietäre Funktionen und neue Formeln eingebaut haben. Es funktioniert für alle Zeitrahmen. Basierend auf neuen zugrunde liegenden Algorithmen ist
    128 USD
    Price Action Entry Alerts
    Stephen Sanjeeve Sahayam
    5 (2)
    Dieser Indikator überprüft jeden Balken auf Kauf- oder Verkaufsdruck und identifiziert 4 Arten von Kerzenmustern mit dem höchsten Volumen. Diese Kerzen werden dann mithilfe mehrerer linearer Filter gefiltert, um Kauf- oder Verkaufssignale anzuzeigen. Signale funktionieren am besten in Verbindung mit einer höheren Zeitrahmenrichtung und wenn sie während der Stunden mit hohem Handelsvolumen gehandelt werden. Alle Filter sind anpassbar und funktionieren unabhängig voneinander. Kann Signale einer e
    135 USD
    PTS - Divergence Buy Finder von Precision Trading Systems Der Precision Divergence Finder wurde entwickelt, um Markt-Tiefpunkte mit höchster Genauigkeit zu finden und tut dies häufig. In der technischen Analyse ist das Aufspüren von Tiefpunkten im Allgemeinen viel einfacher als das Aufspüren von Höchstpunkten. Dieses Tool wurde genau für diese Aufgabe entwickelt. Nachdem eine bullische Divergenz identifiziert wurde, ist es ratsam, auf die Trendwende zu warten, bevor Sie kaufen. Sie können e
    147 USD
    CyberZingFx Volume Plus
    Afsal Meerankutty
    4.93 (15)
    Advanced version of CyberZingFx Volume Plus, the ultimate MT4 indicator for traders seeking highly accurate buy and sell signals. With an additional strategy and price action dot signals that enhances its effectiveness, this indicator offers a superior trading experience for professionals and beginners alike. The CyberZingFx Volume Plus Advanced version combines the power of volume analysis and historical price data with an additional strategy, resulting in even more precise and reliable signals
    135 USD
    "Dragon's Tail" is an integrated trading system, not just an indicator. This system analyzes each candle on a minute-by-minute basis, which is particularly effective in high market volatility conditions. The "Dragon's Tail" system identifies key market moments referred to as "bull and bear battles". Based on these "battles", the system gives trade direction recommendations. In the case of an arrow appearing on the chart, this signals the possibility of opening two trades in the indicated directi
    1 000 USD
    TheStrat Monitor
    Robert Gerald Wood
    5 (1)
    If you've not already learnt about The Strat trading strategy , go google it now. I promise it won't be a waste of your time, and you will likely learn some new tricks whether you use it or not. OK, so now you know what TheStrat is, you will be able to understand what this indicator can do for you. Key Features In short, the Indicator will: Show Timeframe Continuity for all supported timeframes Supports two timeset views, Day trader and Swing trader Show when Full Timeframe Continuity is in pl
    150 USD
    RelicusRoad Pro
    Relicus LLC
    4.78 (139)
    Jetzt 147 US -Dollar (nach ein paar Aktualisierungen auf 499 US -Dollar) - Unbegrenzte Konten (PCs oder MACs) RelicusRoad Benutzerhandbuch + Schulungsvideos + Zugang zur privaten Discord-Gruppe + VIP-Status EINE NEUE ART, DEN MARKT ZU BETRACHTEN RelicusRoad ist der weltweit leistungsstärkste Handelsindikator für Forex, Futures, Kryptowährungen, Aktien und Indizes und gibt Händlern alle Informationen und Tools, die sie benötigen, um profitabel zu bleiben. Wir bieten technische Analysen un
    147 USD
    Shepherd Harmonic Pattern
    Abdullah Alrai
    4.68 (59)
    Dieser Indikator erkennt harmonische Muster, die manuell oder automatisch auf dem Chart gezeichnet wurden. Sie können das Benutzerhandbuch unter diesem Link einsehen: Fügen Sie Ihre Bewertung hinzu und kontaktieren Sie uns, um es zu erhalten. Es gibt eine kostenlose Version, um dieses Produkt auf MT4 auszuprobieren. Sie können es verwenden, um Gartley- und Nenstar-Muster zu erkennen: https://www.mql5.com/en/market/product/30181 Sie können die vollständige MT4-Version von kaufen: https://www.mql5
    200 USD
    The  RSI Basket Currency Strenght  brings the RSI indicator to a new level.  Expanding the boundaries of TimeFrames and mono-currency analysis, the RSI Multi Time Frame Currency Strenght take the movements of each currency that composes the cross and confront them in the whole basket of 7 crosses.  The indicator works with any combination of  AUD, CAD, CHF, EUR, GBP, JPY, NZD, USD  pairs and with full automation takes in account every RSI value for the selected Time Frame.  After that, the ind
    120 USD
    Best Currency Strength Indicator
    Tumelo Patrick Rakotsoane
    4.55 (47)
    Advanced Currency Strength Indicator The Advanced Divergence Currency Strength Indicator. Not only it breaks down all 28 forex currency pairs and calculates the strength of individual currencies across all timeframes , but, You'll be analyzing the WHOLE forex market in 1 window (In just 1 minute) . This indicator is very powerful because it reveals the true movements of the market.  It is highly recommended to  analyze charts knowing the performance of individual currencies or the countries ec
    149 USD
    FX Volume
    Daniel Stein
    4.6 (35)
    Erhalten Sie Ihr tägliches Marktupdate mit Details und Screenshots über unser Morning Briefing hier auf mql5 und auf Telegram ! FX Volume ist der ERSTE und EINZIGE Volumenindikator, der einen ECHTEN Einblick in die Marktstimmung aus Sicht eines Brokers bietet. Es bietet fantastische Einblicke in die Positionierung von institutionellen Marktteilnehmern, wie z.B. Brokern, auf dem Forex-Markt, viel schneller als COT-Berichte. Diese Informationen direkt auf Ihrem Chart zu sehen, ist der wahre Game
    229 USD
    Natürlich, hier ist die Übersetzung in Deutsch: Vorstellung des Astronomie-Indikators für MT4: Dein ultimativer himmlischer Trading-Begleiter Bist du bereit, deine Trading-Erfahrung auf himmlische Höhen zu heben? Suche nicht weiter als unseren revolutionären Astronomie-Indikator für MT4. Dieses innovative Tool übertrifft herkömmliche Trading-Indikatoren und nutzt komplexe Algorithmen, um dir unvergleichliche astronomische Einblicke und präzise Berechnungen zu bieten. Ein Universum an Information
    250 USD
    Enigmera
    Ivan Stefanov
    5 (1)
    ENIGMERA: Der Kern des Marktes https://www.enigmera.com Einführung Dieser Indikator und dieses Handelssystem sind ein bemerkenswerter Ansatz für die Finanzmärkte. ENIGMERA nutzt die fraktalen Zyklen zur genauen Berechnung von Unterstützungs- und Widerstandsniveaus. Er zeigt die echte Akkumulationsphase an und gibt Richtung und Ziele vor.  Ein System, das funktioniert, egal ob wir uns in einem Trend oder in einer Korrektur befinden.  Wie funktioniert es? ENIGMERA besteht aus drei Linien: der
    100 USD
    Supply and Demand Dashboard PRO
    Bernhard Schweigert
    4.82 (22)
    Derzeit 20% reduziert! Dieses Dashboard ist eine sehr leistungsfähige Software, die mit mehreren Symbolen und bis zu 9 Zeitrahmen arbeitet. Es basiert auf unserem Hauptindikator (Beste Bewertungen: Advanced Supply Demand ).   Das Dashboard gibt einen guten Überblick. Es zeigt: Gefilterte Angebots- und Nachfragewerte einschließlich der Zonenstärkebewertung, Pips-Abstände zu/und innerhalb von Zonen, Es hebt verschachtelte Zonen hervor, Es gibt 4 Arten von Alarmen für die gewählten Symbole in
    199 USD
    Gann Zone Pro
    Kirill Borovskii
    This indicator identifies and displays zones, as it were areas of strength, where the price will unfold. The indicator can work on any chart, any instrument, at any timeframe. The indicator has two modes. The indicator is equipped with a control panel with buttons for convenience and split into two modes. Manual mode: To work with manual mode, you need to press the NEW button, a segment will appear. This segment is stretched over the movement and the LVL button is pressed. The level is displayed
    470 USD
    Weitere Produkte dieses Autors
    Blahtech Supply Demand MT5
    Blahtech Limited
    4.57 (14)
    Was: $299  Now: $99   Supply Demand uses previous price action to identify potential imbalances between buyers and sellers. The key is to identify the better odds zones, not just the untouched ones. Blahtech Supply Demand indicator delivers functionality previously unavailable on any trading platform. This 4-in-1 indicator not only highlights the higher probability zones using a multi-criteria strength engine, but also combines it with multi-timeframe trend analysis, previously confirmed swings
    99 USD
    Was: $249  Now: $99   Market Profile defines a number of day types that can help the trader to determine market behaviour. A key feature is the Value Area, representing the range of price action where 70% of trading took place. Understanding the Value Area can give traders valuable insight into market direction and establish the higher odds trade. It is an excellent addition to any system you may be using. Inspired by Jim Dalton’s book “Mind Over Markets”, this indicator is designed to suit the
    99 USD
    Blahtech Candle Timer MT5
    Blahtech Limited
    4.78 (109)
    Over 100,000 users on MT4 and MT5 Blahtech Candle Timer displays the remaining time before the current bar closes and a new bar forms. It can be used for time management Links [  Install  |  Update  |  Training  ] Feature Highlights The only candle timer on MT5 with no stutter and no lag S electable Location Tracks server time not local time Multiple colour Schemes Configurable Text Customisable alerts and messages Optimised to reduce CPU usage Input Parameters Text Location - Beside / Upper L
    FREE
    Blahtech Candle Timer
    Blahtech Limited
    4.82 (93)
    Over 100,000 users on MT4 and MT5 Blahtech Candle Timer displays the remaining time before the current bar closes and a new bar forms. It can be used for time management Links [  Install  |  Update  |  Training  ] Feature Highlights The only candle timer on MT4 with no stutter and no lag S electable Location Tracks server time not local time Multiple colour Schemes Configurable Text Customisable alerts and messages Optimised to reduce CPU usage Input Parameters Text Location   - Beside / Upper
    FREE
    Was: $49    Now: $34  Blahtech Better Volume provides an enhanced version of the vertical volume bars. Each bar is compared to the previous 20 bars. Depending on its volume, range and volume density it will be assigned a state and colour. Low Volume – Minimum volume High Churn   – Significant volume with limited movement Climax Neutral –   High volume with unclear direction Climax Up   – High volume with bullish direction Climax Dn   – High volume with bearish direction Climax Churn – High vol
    34 USD
    Blahtech Market Profile
    Blahtech Limited
    4.61 (18)
    Was: $249  Now: $99   Market Profile defines a number of day types that can help the trader to determine market behaviour. A key feature is the Value Area, representing the range of price action where 70% of trading took place. Understanding the Value Area can give traders valuable insight into market direction and establish the higher odds trade. It is an excellent addition to any system you may be using. Blahtech Limited presents their Market Profile indicator for the MetaTrader community. Ins
    99 USD
    Was: $99  Now: $34   Blahtech Daily Range indicator displays the average daily range alongside the individual session ranges. Using the daily open price as a reference the indicator shows fixed range and dynamic range targets as lines on the charts. These lines clearly show when the average range has been exhausted. Daily and session ranges can be useful for confirming entries or setting targets and is an excellent odds enhancer for many trading systems. Links [  Documentation   |   Install  | 
    34 USD
    Blahtech VWAP MT5
    Blahtech Limited
    5 (1)
    Was: $69  Now: $34   Blahtech VWAP - Volume Weighted Average Price (VWAP) is the ratio of price to total volume. It provides an average price over a specified time interval.  Links [  Install  |  Update  |  Documentation   ] Feature Highlights Configurable VWAP Line Sessions, intervals, anchored or continuous Previous day settlement line Standard Deviation bands Alerts at bar close or real time Automatic Broker or Tick volumes Significantly reduced CPU usage Input Parameters Expert Advisor
    34 USD
    Blahtech Better Volume
    Blahtech Limited
    3 (2)
    Was: $49    Now: $34  Blahtech Better Volume provides an enhanced version of the vertical volume bars. Each bar is compared to the previous 20 bars. Depending on its volume, range and volume density it will be assigned a state and colour. Low Volume – Minimum volume High Churn   – Significant volume with limited movement Climax Neutral –   High volume with unclear direction Climax Up   – High volume with bullish direction Climax Dn   – High volume with bearish direction Climax Churn – High vol
    34 USD
    Blahtech Moving Average indicator is a multitimeframe version of the standard Moving Average indicator. It is also enhanced with customisable alerts, period breaks and other configuration options. The 50 day and 200 day moving averages are widely followed by investors and traders, with breaks above and below the MA lines considered to be signals of interest. Links [  Install  |  Update  |   Training   |   All Products  ] Feature Highlights Up to three timeframes Configurable calculation variab
    FREE
    Blahtech VWAP
    Blahtech Limited
    5 (2)
    Was: $69    Now: $34   Blahtech VWAP - Volume Weighted Average Price (VWAP) is the ratio of price to total volume. It provides an average price over a specified time interval.  Links [  Install  |  Update  |  Documentation   ] Feature Highlights Configurable VWAP Line Sessions, intervals, anchored or continuous Previous day settlement line Standard Deviation bands Alerts at bar close or real time Automatic Broker or Tick volumes Significantly reduced CPU usage Input Parameters Expert Advis
    34 USD
    Blahtech Fisher Transform indicator is an oscillator that displays overbought and oversold locations on the chart. The Fisher Transform algorithm transforms prices with any distribution shape into a normal distribution. The end result is a curve with sharp turning points that may help to identify bullish or bearish trends. Fisher Transform values exceeding 1.66 on the daily chart are considered to be good areas for reversal trades. Links [  Install  |  Update  |  Training   |  All Products  ]
    33 USD
    Blahtech Moving Average
    Blahtech Limited
    4.5 (6)
    Blahtech Moving Average indicator is a multitimeframe version of the standard Moving Average indicator. It is also enhanced with customisable alerts, period breaks and other configuration options. The 50 day and 200 day moving averages are widely followed by investors and traders, with breaks above and below the MA lines considered to be signals of interest. Links [  Install  |  Update  |   Training   |   All Products  ] Feature Highlights Up to three timeframes Configurable calculation variab
    FREE
    Blahtech Daily Range
    Blahtech Limited
    4.8 (5)
    Was: $99  Now: $34   Blahtech Daily Range indicator displays the average daily range alongside the individual session ranges. Using the daily open price as a reference the indicator shows fixed range and dynamic range targets as lines on the charts. These lines clearly show when the average range has been exhausted. Daily and session ranges can be useful for confirming entries or setting targets and is an excellent odds enhancer for many trading systems. Links [  Documentation   |   Install  |
    34 USD
    Auswahl:
    Man xola Man xola
    77
    Man xola Man xola 2023.03.23 05:04 
     

    One the best

    Nerijus1982
    373
    Nerijus1982 2022.08.08 15:58 
     

    On backtesting looks good.But in real conditions levels repainting and disappears even when they’re not broken.You just can’t trust them.

    Blahtech Limited
    125724
    Antwort vom Entwickler James Cater 2022.09.27 14:38
    To reduce clutter, narrow levels formed from just two candles don't get displayed as old zones. If you want to display these levels set the parameter "Other Parameters / Min Bars For Old Levels" => 2
    Zakarias
    48
    Zakarias 2021.11.03 13:05 
     

    Awesome, i like the idea and its running very very good

    David Cooper
    38
    David Cooper 2021.08.03 03:32 
     

    A leading indicator very well done. Remember to wait for price to come to you.

    YHW1022221880
    170
    YHW1022221880 2021.07.27 12:19 
     

    Good supply and demand indicators

    efecetinel
    111
    efecetinel 2021.05.05 20:16 
     

    Perfect indicator, perfect owner. Thank you James

    Nicolas Dobrovsky
    674
    Nicolas Dobrovsky 2021.03.07 10:55 
     

    The best SR indicator on the market. It is necessary to set the indicator according to the trading style. I spent a lot of time testing different variants and settings. Everyone has to find what suits them.

    Edit: Backtest mode does not work properly, sometimes repaint. You always need to use the previous candle, otherwise you will have very different results in the real account.

    Frank Paetsch
    6741
    Frank Paetsch 2021.03.03 12:47 
     

    Good! thank you

    Kavindran Elangoven
    641
    Kavindran Elangoven 2021.03.01 02:55 
     

    for a person who doesnt know how to trade, this indicator wont be helpful at all, but if you are a experience trader in the markets but sometimes are unconfident about the levels you are watching, and with the knowledge you already have about the markets to develop a bias on your trading day. this can be a game changer

    DilliBab
    19
    DilliBab 2021.02.23 15:05 
     

    Hi Friends this indicator am using last one day ,can you tell me how to use this, where we go short and long.please explain me anybody friends...+91 9952104997 my whatsapp number

    njs7891
    124
    njs7891 2021.01.04 16:30 
     

    The levels this indicator shows are very good and make it easy to see where price is likely to react from. I like the hotkey features to cycle between higher timeframe levels as you can quickly spot levels you may have missed when zoomed into a lower timeframe. The backtesting feature is also great and very useful. Good support also. Great indicator.

    Ng Choong Huan
    229
    Ng Choong Huan 2020.12.09 07:04 
     

    This is perfect indicator S/D which auto calculate a lot of data (score or those complicate manual job). Well done. Love it so much

    finisheroffaith
    24
    finisheroffaith 2020.10.27 20:43 
     

    For those who say a free Supply and Demand indicator is just as good as this one. My first response would be have you bought this one, because there is no free supply and demand indicator that even comes remotely close to this indicator that I know of. This indicator is absolutely awesome. The features are outstanding. It is not' your standard free supply and demand indicator.I fill it is money well spent. If you are not educated with the supply and demand method that may change your perception of the worth of the indicator. I say don't buy something you are not educated on.I also say don't let someone make an evaluation for you they are not educated on.

    T3chAddict
    59
    T3chAddict 2020.09.17 15:11 
     

    Fast and reliable indicator. Not 'heavy' on the system. Apart from not wasting time to plot my own SD zones the back-test mode is super handy.

    Martin Freiherr Von Mirbach Doring
    507
     

    Unfortunately not a good indicator. Too bad about the money. My free indicator, which I used for a long time, is much better and more reliable.

    hashmi007
    100
    hashmi007 2020.06.10 19:11 
     

    Excellent indicator.I use it with my Bollinger/MA crossover strategy and blahtech provides me with accurate Target zones.great tool.

    Bradley Bosworth
    335
    Bradley Bosworth 2020.01.14 06:32 
     

    Awesome Indicator, but I'm trying to install on my computer (same one I originally installed) and it claims I've used all my "activations" when I've had to reinstall mt4 multiple times. I guess that counts as an activation even though it's the same PC?

    hkarram
    288
    hkarram 2019.10.20 15:29 
     

    Excellent indicator ..... a must for any supply demand trader ...... the backtest mode is a great tool ...... thanks for the developers

    Trader mql5
    1266
    Trader mql5 2019.10.11 02:01 
     

    The free S/D indicators are good enough for amateur traders. But for fine-tuning to my professional needs this is a good start (lol - always give space for future improvements). Love it!!

    anonymouse73
    24
    anonymouse73 2019.04.29 20:34 
     

    Der Benutzer hat keinen Kommentar hinterlassen

    12
    Antwort auf eine Rezension
    Version 4.1 2024.01.11
    - Solo Zones - Use "Zone Line Width 1" when setting SoloZone Line Width
    - Keyboard - Fix Ctrl and Shift Click mappings on MT5
    - Alerts - Add "Reverse Candle From Zone" alerts
    - Alerts - Update parameter names
    Version 4.0 2022.05.12
    - Overall Trend - Add "Three In A Row" option to highlight trend when all three timeframe trends align
    - Hotkeys - Zone Visibility - With Trend - Hide zones with unknown trend status
    - Alerts - Zone Visibility - Alow user to filter visibility independent of the display hotkey setting
    Version 3.9 2022.04.11
    - New Alerts - Stop excessive alerts being generated when multiple timeframes are active
    Version 3.8 2022.02.07
    - Block invalid alerts that were triggered when broker resets data feed
    - Improve level tooltip texts to always include nested info
    - Summary Panel - Add parameter Trend Show Consolidation Dots
    - Summary Panel - Rename parameter Engulfings - Stop Loss to Engulfings - Viable Size
    Version 3.7 2021.05.05
    Enhancements
    - Timeframes - Add new timeframe options - Current Plus One / Two / Three
    - Profiles - Add parameter "Clear Hotkeys On Terminal Close" to improve profile switching on MT5
    - Offline Charts - Add support for offline charts and backtest tools with missing market data and unsynced current time

    Fixes
    - Summary Panel - Q Points - Improve accuracy of real time updates
    - Summary Panel - Q Points - Ensure text is positioned correctly in the center of the box
    - Trend Change - Incremental - Check that BarNum >= MinBarsOldZones
    - Mouse Events - Keep CHART_EVENT_MOUSE_MOVE enabled if other indicators are waiting on mouse events
    Version 3.6 2021.04.20
    Enhancements
    - MT5 - Add support for extended timeframes
    - Trend Worm - Add option to display Trend Worm and/or Consolidation Worm on the chart
    (Due to a platform issue, MT5 users may need to re-attach the indicator to see the Trend Worm)

    Performance
    - Clear Hotkey - Improve performance of clear chart calls
    - Redraw - Remove ObjectsDeleteAll calls that slow other indicators with many objects
    Version 3.5 2021.04.02
    Fixes
    - Summary SupDem - Apply Filters to SupDem column
    - iCustom - Apply Filters to iCustom buffers
    - iCustom - Improve Blahtech Expert Advisor Examples
    - Alerts - Add MinBarsLevel and PriceAway filters to alerts
    - Overall Move - Fix edge case where Overall Move wasn't being calculated correctly
    Version 3.4 2021.03.24
    Enhancements
    - Enable filters whenever an individual filter is changed in the GUI
    - iCustom - Refactor EA code examples into class to support cleaner multiple instances

    Fixes
    - Summary SupDem - Improve highlighting of overlapped zones
    - Consolidations - Fix edge case when near MaxBars
    - Allow user to configure Timeframes 1-4 in any order
    - Allow experts to operate on higher timeframes than the current chart period
    - Change format of diff files to support iCustom development
    - Only populate iCustom buffers if they are enabled and used
    - Change position of Overall Move filter to the top half of the GUI
    Version 3.3 2021.03.08
    Enhancements
    - Summary Trend - Display dot next to the trend direction when recent bars are consolidating
    - Filters - Add Max Levels filter to allow the user to restrict the number of levels on the chart
    - Zone Highlight - Add parameter to change highlighting mode (None/Strength/Untouched)
    - Parameters - Write simple list of changed parameters to experts log when Ctrl+Q keys are pressed
    - Parameters - Create detailed report of changed parameters in Files/Blahtech directory to assist users and support

    Fixes
    - Q Points - Add Min Risk Reward parameter
    - Trend Change - Add Min Range and rename Min Risk Reward parameters
    - Overall Trend Alerts - Print all three timeframe directions in alert message
    - Summary SupDem - Improve highlighting accuracy with overlapped zones
    - Old Zones - Enable detection of old zones with just two bars
    - Consolidation - Fix edge case in consolidation zones detection
    - Hotkeys - Revert regression from 3.1 release where [ and ] were swapped round
    - Expert Advisor Mode - Change to a single option named "Reserved For iCustom Calls"
    Version 3.2 2021.01.20
    Enhancements
    - Alerts - Add parameter "Filter Nested (Levels)" to control raising alerts for nested zones only
    - Alerts - Add parameter "Trigger Alerts Early" to trigger touch/break alerts N points before the level
    - Hotkey Panel - Add "Alerts Nest" button to allow user to modify the nested zone filter from the GUI
    - Summary - Alerts panel - Add icon next to title to show "Trigger Early Alerts" points value
    - Summary - Alerts panel - Improve alerts icon tooltips
    - Touches - Increase accuracy of Touches and add optional Touch/Untouch points parameters
    - Info - Add parameter to control the precision of the {lots1} substitution string
    - Info - Add a second user custom format string

    Fixes
    - Alerts - Fix edge case where duplicate alerts could be raised
    - Alerts - Remove overlaps from Retouch alerts and apply filters to New alerts
    - Alerts - Don't raise alerts for levels hidden from display by the "Zone Visibility" parameter
    - Alerts - Improve text format, add bid price and number of touches
    - Trend Change - Modify trend change parameter to OVERLAP_ALL to improve consistency of trend reversals
    - Summary Panel - Improve accuracy of summary panel when price retraces from touched levels
    - Summary Panel - Optimise summary panel redraw to compensate for increased accuracy
    - HotKey Panel - Adjust panel Y location when position changed to Bottom left/right
    Version 3.1 2019.10.17
    - Enable left mouse click actions on Hotkey panel when keys have been reserved
    Version 3.0 2019.10.09
    Enhancements
    - Add a third mode to the Summary panel GUI to control all alerts
    - Alow user to set individual alert timeframes for Trend, Engulfings, QPoints and Levels
    - Allow M30,H4,D1 as well as 1,2,3 when setting alerts timeframe parameters
    - Enable Summary Timeframe Bubble Numbers by default
    - Add bubble numbers to QPoints and SupDem columns in the Summary panel
    - Add option to adjust the zone start bar of a level to the begining of a consolidation
    - Add Timeframe hints to the TF section of the Hotkey panel
    - Add {lots3} option to Info format

    Fixes
    - Change default colour of QPoint 2 from MediumOrchid to PaleVoiletRed
    - Change Invert Style and colour parameters to be more intuitive
    - Change text colour of oversized Q Points on the chart to Gray
    - Change Summary heading from TimeF to Time
    - Improve the behaviour of the Q Points hotkeys
    - Modify all lines drawn by the indicator to be unselectable
    - Include first bar in search for max move away of zones and Q Points
    - Reset hotkey settings when indicator is removed from chart or chart is closed
    - Only call TerminalInfoInteger to get ctrl status when key pressed or object clicked
    Version 2.9 2019.07.18
    Fix issue when backtesting beyond Max Bars
    Version 2.8 2019.06.19
    Enhancements
    - Add options to draw multi timeframe Q Points on the chart
    - Add GUI tab within HUD panel for control of filter parameters
    - Add extra filters for Nested Levels, Zone Size and Min Price Away
    - Change default values for live filters to disabled
    - Add option to choose method for Zone Height calculation - Default/Whole Body/Entire Candle
    - Add parameters to limit zone height "Zone Height Min" and "Zone Height Max"
    - Add iCustom Buffers for QPoint 1 Top Bar and QPoint 1 Bot Bar
    - Add option to display Total Move in custom format
    - Left clicking any description in the Hud Panel now resets the value back to its input parameter version

    Fixes
    - Change defaults to display more features on chart at startup
    - Check UserTickSize to stop divide by zero error
    - Check for empty iCustom buffer
    Version 2.7 2018.05.30
    Enhancements
    - Option to disable highlighting of Strong Zones
    - Option to use Current Timeframe only for Overall Trend
    - Parameter to change corner anchor of Summary Display
    - Added Sup/Dem button to show only supplies or demands
    - Added filter for number of retouches
    - Added filter for levels that were formed by engulfing pattern
    - Added filter for max price away
    - Added filter for age of old zones in bars
    - Support alerts for trend changes
    - Support alerts for overall trend changes
    Version 2.5 2017.08.29
    Enhancements
    - Support alerts for QPoint touches and breaks
    - Support alerts for up to 3 timeframes
    - Support inverted zone styles for the multi timeframe display
    - Remember hotkey states when restarting terminal
    - Support iCustom calls with 64+ parameters by using a set file

    Changes
    - Add tooltips to nested zone graphics
    - Add reserved keys parameter to prevent clashes with other products
    Version 2.2 2017.04.06
    Enhancements
    - Support additional timeframes
    - Support alerts for engulfings
    - Draw zones one bar back if the conterminous line originates there
    - Changed colour and font of QPoints label when range greater than 15x average size
    - Separated old and active filters to simplify usage
    - Added advanced iCustom buffers for timeframes two and three
    - Added second demo mode to show extra timeframes
    = Summary Panel
    - Support clicking on timeframe values to show/hide zones
    - Support clicking on QPoint values to change focus
    - Disabled highlighting of QPoint value in pink/blue when range is less than 15x average range
    - Modified highlighting of SupDem values to only use pink/blue
    = Hotkeys
    - Reversed the order of hotkey changes when "Shift" key is pressed
    - Nudge both start and end of zones one bar forward when "X" key is pressed

    Fixes
    - Remember the QPoint timeframe set by the user when switching chart timeframes
    - Fixed the average bar size to match version 1.0 values (regression bug)
    - Rebuild with latest compiler for MetaTrader platform changes
    - Changed all global variables to be constant expressions
    Version 2.1 2017.01.19
    Fixes
    - Resolved issues with iCustom calls

    Performance
    - Reduced overhead each tick to optimise Expert Advisor performance
    - Added Expert Advisor mode to skip creation and drawing of objects
    Version 2.0 2016.12.09
    New Features
    - Alerts - User customisable
    - Engulfing detector - Multi-timeframe
    - Filters - User configurable visibility filters
    - Old Zones - Choice of broken levels or trend changes
    - Nested Zones - Highlight levels that are nested within higher timeframe zones
    - iCustom - Add buffers for developers

    Enhancements
    - Info - Add bubble scores
    - Scores - Normalise with-trend scores so they are always out of 8
    - Timeframes - Change mappings for M1 to M1/M5/M30
    - Strength Engine Mode - Allow user to relax the criteria for a strong zone
    - Calc Mode - Add option to disable incremental calculations
    - Demo Mode - Allow user to switch between default and demo settings
    = Summary display:
    - Show icons when filters are active
    - Highlight "extended" trend in deeper colour
    - Support clicking then dragging panel to new location
    = Hotkey display:
    - Add verbose display
    - Allow user to change value by clicking on the rows
    - Support clicking then dragging panel to new location
    - Highlight values that have changed from input parameter settings

    Fixes
    - Summary - Do not highlight countertrend levels when all three trends align
    - Scores - Change so the user enters 0-8 rather than 0.0-1.0 for the strong zone scores
    - Trend - Support DBD levels changing trend
    - Hotkeys - Update position when window height is changed
    - Backtest - Use TimeLocal for backtest expire so it works when market is closed
    - Reset - Force clear and redraw of all objects on Reset

    Architecture
    - Candle parser - Rewrite candle parse to enable old zones

    Performance
    - Implement incremental calculations to reduce CPU usage
    - Only refresh each tick if next level has been touched or broken
    - Only redraw Hotkey display if chart width has changed

    New Hotkeys
    - "9" - Demo mode
    - "=" - Strength Mode
    - "]" - Filters - All Zones
    - "[" - Filters - Old Zones
    - ";" - Old Zones
    - "'" - Old Zones Style
    - "#" - Nested Zones

    Developers and parameters
    - Developers - Twenty five iCustom buffers
    - Parameters - Fifty extra parameters to control new features
    - See documentation for details http://www.blahtech.co.uk/supplydemand
    Version 1.1 2016.04.12
    - Bug Fix : Chart Zones - Hotkey "X" wasn't working on MN1 timeframe
    - Enhancement : Chart Zones - Add new Hotkey "Z" - Zone style (Applies to solo timeframe only)
    - Enhancement : Summary View - Highlight Active QPoint and differentiate between in the middle (---) and no QPoints ( )
    - Enhancement : Summary View - Change overall trend to use "Two Adjacent" rather than "Best Of Three"
    - Enhancement : Summary View - Improve Trend detection when we bust the top
    - Enhancement : Summary View - Improve SupDem highlighting to focus on QPoints as well as Trend
    - Enhancement : Summary View - Add Input parameter - Highlight SupDem in QPoint - Level Strength
    - Enhancement : Summary View - Shift text right one space when in full mode
    - Enhancement : Daylight Savings - UseDaylightSavings parameter - Change default to true
    - Enhancement : High Res Displays - WindowsDesktopScaling - Add parameter to support desktop scaling for 4K and other high res screens
    - Performance : Backtest Mode - Do not recalculate every tick when in backtest mode