• Genel bakış
  • İncelemeler (40)
  • Yorumlar (364)
  • Yenilikler

Blahtech Supply Demand

4.62

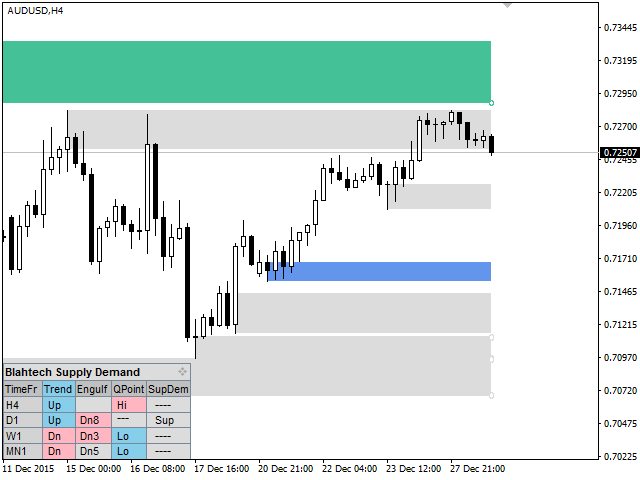
Supply Demand uses previous price action to identify potential imbalances between buyers and sellers. The key is to identify the better odds zones, not just the untouched ones.

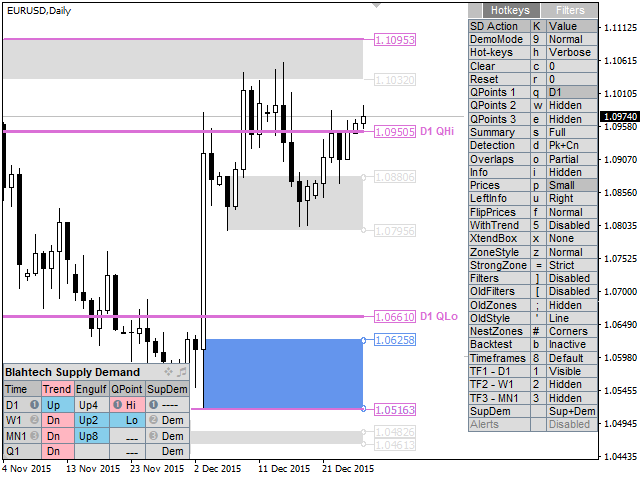
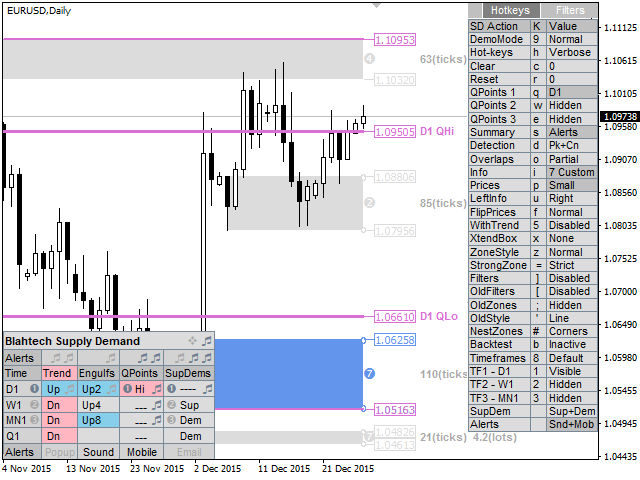
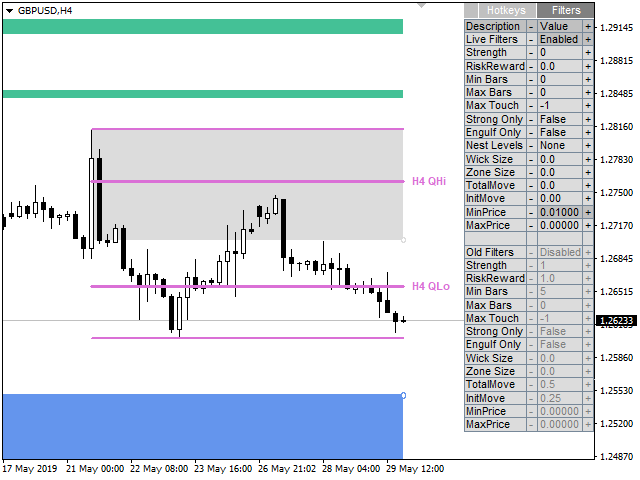
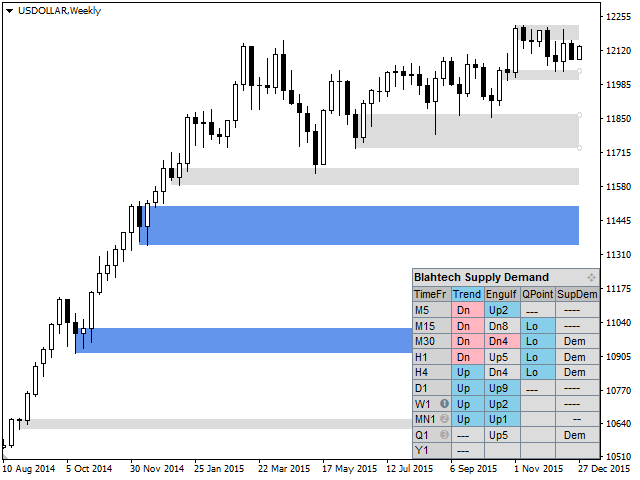
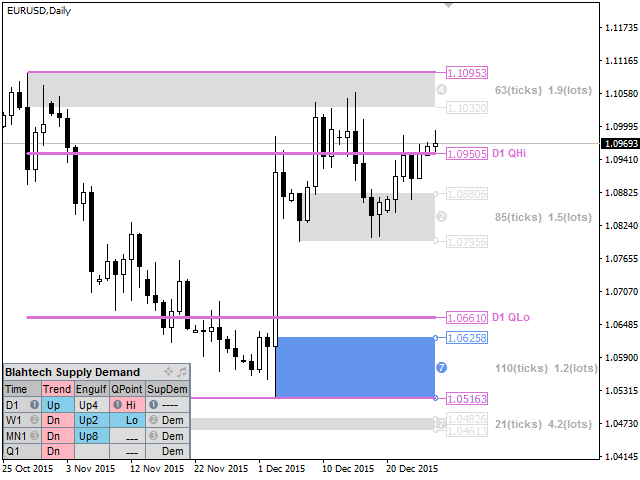
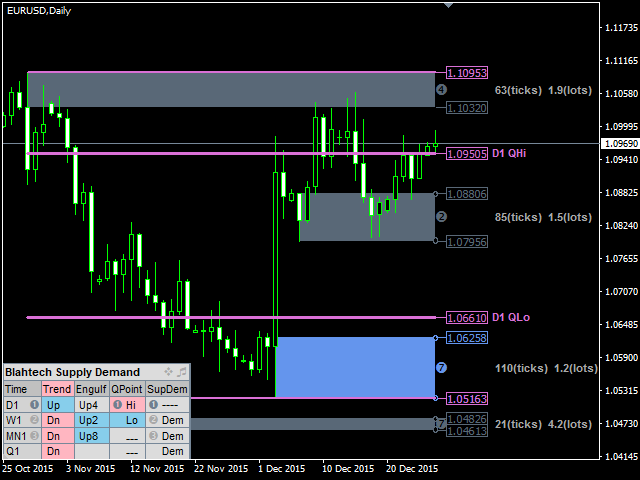
Blahtech Supply Demand indicator delivers functionality previously unavailable on any trading platform. This 4-in-1 indicator not only highlights the higher probability zones using a multi-criteria strength engine, but also combines it with multi-timeframe trend analysis, previously confirmed swings and engulfing detectors. Driven by an easy to use interface and innovative backtest mode this indicator is a must-have for all supply demand traders.

Links [ Install | Update | Documentation & Training ]


Feature Highlights

  • Multi-timeframe display
  • Backtest directly on the chart
  • Summary panel
  • Multi-timeframe trend analysis
  • Confirmed swings (High and Low QPoints)
  • Zone strength engine (seven criteria)

Feature Highlights continued...

  • Advanced level detection (peaks, consolidations, drop-base-drops)
  • Fast access hot-keys
  • Alerts
  • Engulfing detector
  • Visibility Filters
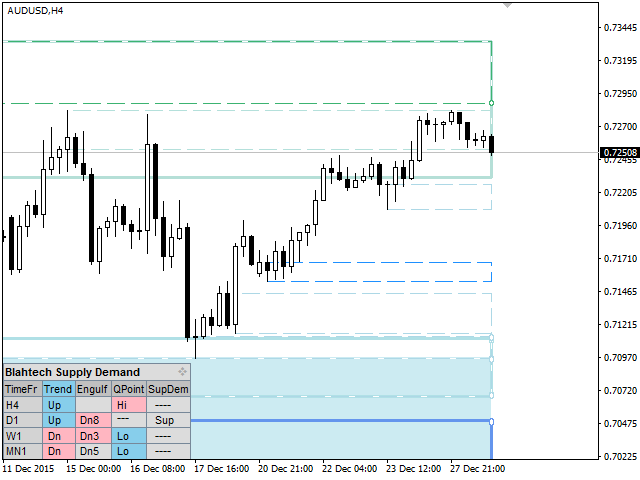
  • Old zones (broken levels or trend changes)
  • Highlight of Nested zones

Input Parameters

 - Download documentation using link above for details


    İncelemeler 20
    Zakarias
    48
    Zakarias 2021.11.03 13:05 
     

    Awesome, i like the idea and its running very very good

    David Cooper
    38
    David Cooper 2021.08.03 03:32 
     

    A leading indicator very well done. Remember to wait for price to come to you.

    YHW1022221880
    170
    YHW1022221880 2021.07.27 12:19 
     

    Good supply and demand indicators

    Önerilen ürünler
    Bu, bir mumun kapanış fiyatını tahmin eden bir göstergedir. Gösterge öncelikle D1 çizelgelerinde kullanılmak üzere tasarlanmıştır. Bu gösterge hem geleneksel forex ticareti hem de ikili opsiyon ticareti için uygundur. Gösterge, bağımsız bir ticaret sistemi olarak kullanılabilir veya mevcut ticaret sisteminize ek olarak hareket edebilir. Bu gösterge, mevcut mumu analiz ederek mumun gövdesi içindeki belirli güç faktörlerini ve önceki mumun parametrelerini hesaplar. Böylece gösterge, piyasa hareket
    65 USD
    The Fibonacci Magic Pivot Levels is a powerful yet easy to use indicator . It continuously monitor s intra-day price action and uses complex algorithms to calculate and detect key support, resistance and pivot levels, using the D1 timeframe as a filter. The   Fibonacci Magic Pivot Levels is optimized for H4, H1, M30, M15, M5 & M1 timeframes and can be used on ALL Currencies, Indices, Commodities, and Cryptocurrency pairs . Trade with improved confidence and maximize your success rate. Benefits o
    99 USD
    Zig Zag 123
    Stephen Reynolds
    Zig Zag 123 tells us when a reversal or continuation is more likely by looking at the shift in supply and demand. When this happens a signature pattern appears known as 123 (also known ABC) will often break out in direction of higher low or lower high. Stop loss and take profit levels have been added. There is a panel that shows the overall performance of your trades for if you was to use these stop loss and take profit levels.  We get alerted if a pattern 123 appears and also if the price
    30 USD
    Trendiness Index
    Libertas LLC
    5 (3)
    "The trend is your friend" is one of the best known sayings in investing, because capturing large trendy price movements can be extremely profitable. However, trading with the trend is often easier said than done, because many indicators are based on price reversals not trends. These aren't very effective at identifying trendy periods, or predicting whether trends will continue. We developed the Trendiness Index to help address this problem by indicating the strength and direction of price trend
    49 USD
    Point61 Indicator
    Evgeniy Machok
    5 (1)
    The Point61 indicator is the result of many years of monitoring of price behavior of currency pairs and metals. It is not a secret, that in times of uncertainty, traders are looking for possible levels of support and resistance - the point, where price should stop its movement. There are 2 possible scenarios at these points: 1. Reverse (correction) to the opposite direction; 2. Breakthrough to continue movement. Very often these points are used to set stop orders - TakeProfit or
    249 USD
    TWO PAIRS SQUARE HEDGE METER INDICATOR Try this brilliant 2 pairs square indicator It draws a square wave of the relation between your two inputs symbols when square wave indicates -1 then it is very great opportunity to SELL pair1 and BUY Pair2 when square wave indicates +1 then it is very great opportunity to BUY pair1 and SELL Pair2 the inputs are : 2 pairs of symbols         then index value : i use 20 for M30 charts ( you can try other values : 40/50 for M15 , : 30 for M30 , : 10 for H1 ,
    10 USD
    Master Scalping M1 , trendi hızlı ve doğru bir şekilde belirlemek için bir algoritma kullanan yenilikçi bir göstergedir. Gösterge, pozisyonların açılış ve kapanış zamanını hesaplar, gösterge algoritmaları, bir ticarete girmek (bir varlık satın almak veya satmak) için ideal anları bulmanızı sağlar, bu da çoğu tüccar için işlemlerin başarısını artırır. Göstergenin faydaları: Kullanımı kolaydır, çizelgeyi gereksiz bilgilerle aşırı yüklemez. Herhangi bir strateji için bir filtre olarak kullanılabili
    30 USD
    Gösterge, piyasa analizi için en etkili araçlardan biri olan Fibonacci destek ve direnç seviyelerini otomatik olarak hesaplar ve çizer. Hesaplama, seçilen dönem ve zaman çerçevesi için ortalama fiyat verilerini kullanır. Bu süre için minimum ve maksimum hareketin başlangıcı ve sonu olarak alınır. Fibonacci seviyeleri, etrafında fiyat hareketinin yavaşlayabileceği veya tersine dönebileceği potansiyel referans noktalarını görmenizi sağlar, yani bunlar daha fazla hareketi tahmin etmek ve ayrıca sto
    30 USD
    Noize Absorption Index - is the manual trading system that measures the difference of pressure between bears forces and bulls forces. Green line - is a noize free index that showing curent situation. Zero value of index shows totally choppy/flat market.Values above zero level shows how powerfull bullish wave is and values below zero measures bearish forces.Up arrow appears on bearish market when it's ready to reverse, dn arrow appears on weak bullish market, as a result of reverse expectation. S
    199 USD
    Infinity Trend Pro
    Yaroslav Varankin
    1 (1)
    This is a trend indicator without redrawing Developed instead of the binary options strategy (by the color of the Martingale candlestick) Also works well in forex trading When to open trades (binary options) A signal will appear in the place with a candle signaling the current candle It is recommended to open a deal for one candle of the current timeframe M1 and M5 When a blue dot appears, open a deal up When a red dot appears, open a trade down. How to open trades on Forex. When a signal is rec
    1 000 USD
    Super Gator
    Agustinus Biotamalo Lumbantoruan
    This indi shows the following 1. Supertrend 2. Alligator (Not a regular alligator) 3. ZigZag 4. Moving Average 5. Trend Continuation/Mini correction Signal (plotted in X) (See screenshots in green background color 6. Early Signal Detection (See screenshots in green background color) You may treat Alligator as the lagging indicator The leading indicator is the supertrend. The zig zag is based on the leading indicator where it gets plotted when the leading indicator got broken to the opposite.
    150 USD
    Trade with Gann on your side!! MASTER CIRCLE 360 CIRCLE CHART, originally created by Gann admitted that this is “The Mother of all charts”. It is one of the last studies that this great trader left for us. The numeric tab le is apparently quite simple like all the tables and is based on square numbers, the SQUARE OF 12 and is by evolution, one of the most important square numbers. Here we can find CYCLE, PRICE AND TIME thanks to angles and grades, to show past and future support and resistance.
    149.99 USD
    MT4 göstergeleri. Üç seviyeli Fibonacci destek ve direnç seviyeleri otomatik olarak çizilir. Bunlar: Ay Seviyesi: Orta Orkide Haftalık seviye: Turuncu Kırmızı Gün çizgisi seviyesi: Turkuaz Renk parametrelerle ayarlanabilir. MT5 Version: https://www.mql5.com/EN/market/product/80068 Bu gösterge esas olarak daha iyi ticaret analizi için gelecekteki destek ve direnç seviyelerini analiz etmek için kullanılır. Destek seviyesi birçok kez etkin bir şekilde desteklenirse, piyasa bir önceki y
    40 USD
    The indicator displays the data of the Stochastic oscillator from a higher timeframe on the chart. The main and signal lines are displayed in a separate window. The stepped response is not smoothed. The indicator is useful for practicing "manual" forex trading strategies, which use the data from several screens with different timeframes of a single symbol. The indicator uses the settings that are identical to the standard ones, and a drop-down list for selecting the timeframe. Indicator Parame
    30 USD
    BoxChart MT4
    Evgeny Shevtsov
    4.57 (7)
    The market is unfair if only because 10% of participants manage 90% of funds. An ordinary trader has slim changes to stand against these "vultures". This problem can be solved. You just need to be among these 10%, learn to predict their intentions and move with them. Volume is the only preemptive factor that faultlessly works on any timeframe and symbol. First, the volume appears and is accumulated, and only then the price moves. The price moves from one volume to another. Areas of volume accumu
    33 USD
    Introduction to Chart Pattern MT Chart Pattern MT is a chart pattern scanner to detect the triangle pattern, falling wedge pattern, rising wedge pattern, channel pattern and so on. Chart Pattern MT uses highly sophisticated chart pattern detection algorithm. However, we have designed it in the easy to use with intuitive user interface. Chart Pattern MT will show all the patterns in your chart in the most efficient format for your trading. You do not have to do tedious manual pattern detection an
    180 USD
    Laguerre SuperTrend Clouds adds an Adaptive Laguerre averaging algorithm and alerts to the widely popular SuperTrend indicator. As the name suggests, Laguerre SuperTrend Clouds (LSC) is a trending indicator which works best in trendy (not choppy) markets. The SuperTrend is an extremely popular indicator for intraday and daily trading, and can be used on any timeframe. Incorporating Laguerre's equation to this can facilitate more robust trend detection and smoother filters. The LSC uses the impro
    30 USD
    The Th3Eng PipFinite indicator is based on a very excellent analysis of the right trend direction with perfect custom algorithms. It show the true direction and the best point to start trading. With StopLoss point and Three Take Profit points. Also it show the right pivot of the price and small points to order to replace the dynamic support and resistance channel, Which surrounds the price. And Finally it draws a very helpful Box on the left side on the chart includes (take profits and Stop loss
    89 USD
    Accuracy of correct predictions 83%! This indicator was tested on the basis of real statistics for all market indicators according to indicators for 3 months of trading. 83% of correct trade forecasts for usd / jpy on the m30 time frame were received on our statistics! if you have any questions, please contact us in private messages or in discussions under this indicator and we will figure it out and help any questions will arise personal messages or in discussions under this indicator As soon
    100 USD
    Buy Sell Strength (BSS) (For MT4 ) is a stock technical analysis oscillator, showing bullish (buy) and bearish (sell) strength by comparing upward and downward stock momentum movements. The BSS is easy to interpret: 1. When BBS Histogram is moving Upward, it is bullish, when it is Downward, it is bearish. 2. When the Orange rectangle is changing shorter and shorter, it shows the trend will change direction. when it dispears, it shows Buy or Sell signals. 3. BSS is considered overbought whe
    30 USD
    Gösterge, tarihsel olanlarla karşılaştırılabilecek güncel teklifler oluşturur ve bu temelde bir fiyat hareketi tahmini yapar. Gösterge, istenen tarihe hızlı navigasyon için bir metin alanına sahiptir. Seçenekler: Sembol - göstergenin göstereceği sembolün seçimi; SymbolPeriod - göstergenin veri alacağı dönemin seçimi; GöstergeRenk - gösterge rengi; Ters - doğru tırnakları tersine çevirir, yanlış - orijinal görünüm; Sonraki, tarihi girebileceğiniz ve 'enter' tuşuna basa
    55 USD
    Cosmic Diviner X Planet
    Olena Kondratenko
    4 (2)
    This unique multi-currency strategy simultaneously determines the strength of trends and market entry points, visualizing this using histograms on the chart. The indicator is optimally adapted for trading on the timeframes М5, М15, М30, Н1. For the convenience of users, the indicator renders the entry point (in the form of an arrow), recommended take profit levels (TP1, TP2 with text labels) and the recommended Stop Loss level. The take profit levels (TP1, TP2) are automatically calculated for
    79 USD
    An indicator of pattern #31 ("Long Island") from Encyclopedia of Chart Patterns by Thomas N. Bulkowski. The second gap is in the opposite direction. Parameters: Alerts - show alert when an arrow appears   Push - send a push notification when an arrow appears (requires configuration in the terminal) GapSize - minimum gap size in points ArrowType - a symbol from 1 to 17 ArrowVShift - vertical shift of arrows in points   ShowLevels - show levels ColUp - color of an upward line ColDn - color of
    30 USD
    Pazar Tıraş Makinesi   Pazar Ölçekleyici Bu gösterge, RPTrade Pro Solutions sistemlerinin bir parçasıdır. Market Scalper, Fiyat Hareketi, Dinamik Destek ve Dirençleri kullanan günlük bir trend göstergesidir. Herkes tarafından kullanılmak üzere tasarlanmıştır, ticarete yeni başlayanlar bile kullanabilir. ASLA yeniden boyamaz. Endikasyonlar yakından kapana doğru verilmiştir. Tek başına kullanılmak üzere tasarlanmıştır, başka bir göstergeye gerek yoktur. Size Açık ve basit göstergeler verir
    240 USD
    Fibonacci retracements is a popular instrument used by technical analysts to determine support and resistance areas. In technical analysis, this tool is created by taking two extreme points (usually a peak and a minimum) on the chart and dividing the vertical distance by the key Fibonacci coefficients equal to 23.6%, 38.2%, 50%, 61.8%, and 100%. Once these levels are defined, horizontal lines are then drawn and used to determine possible support and resistance levels. When using the Auto Fibonac
    30 USD
    The indicator analyzes the change in the minimum and maximum prices of the previous bars fixing the entrance of the big players. If the change (delta) increases, a signal is displayed on the graph in the form of an arrow. At the same time, virtual trade on history is carried out. In case of a repeat of the signal, the positions are increased (refilling). Thus the lot of positions can differ. The results of virtual trading in the form of losses / losses, profitability, drawdown and transaction li
    30 USD
    The Supply and Demand Zones indicator is one of the best tools we have ever made. This great tool automatically draws supply and demand zones, the best places for opening and closing positions. It has many advanced features such as multi timeframe zones support, displaying the width of zones, alert notifications for retouched zones, and much more. Because of market fractality, this indicator can be used for any kind of trading. Whether you are a positional, swing, or intraday trader does not ma
    99 USD
    For sure, this indicator has become very popular amongst traders. Through coding this indicator will give you the most accurate levels possible for your trading analysis. We have also added in the ability for you to receive alerts when the price breaks above or below a Support or Resistance lines! HOW TO USE The red rectangles represent your resistance/supply zone. The green rectangles represent your support/demand zone.  BONUS FEATURES We coded this indicator with the ability to switch between
    197 USD
    Mean Reversion Supply Demand Indicator Mean Reversion Supply Demand is the indicator to detect the important supply demand zone in your chart. The concept of supply demand trading relies on the quantity mismatching between buying and selling volumes in the financial market. Typically, supply demand zone serves to predict the turning point. The wave pattern, for any supply demand zone to work as an successful trade, looks like the price must touch the base zone, move away and then return to zone
    80 USD
    Monster Harmonic Indicator
    Paul Geirnaerdt
    4.65 (31)
    Monster Harmonics Indicator is a harmonic pattern indicator. It recognizes Gartley, Bat, Crab, Butterfly, Cypher, White Swan, Black Swan, Shark and several other patterns. Projected patterns that are not yet completed are recognized, too. Monster even shows the PRZ (Potential Reversal Zone). Users can add their own user defined patterns to Monster. Besides the current pattern, Monster also shows all patterns in the symbols history. Monster will provide alerts for developing patterns. Introduced
    79 USD
    Bu ürünün alıcıları ayrıca şunları satın alıyor
    RelicusRoad Pro
    Relicus LLC
    4.9 (104)
    ŞİMDİ 147 $ (602 $ İNDİRİMLİ) - SINIRSIZ HESAPLAR - SONRAKİ GÜNCELLEMEDE FİYAT ARTIŞLARI - 5 YILDIZLI YORUM BIRAKMAYI UNUTMAYIN RelicusRoad Kullanım Kılavuzu + Eğitim Videoları + Özel Discord Grubuna Erişim + VIP Durumu PİYASAYA BAKMAK İÇİN YENİ BİR YOL RelicusRoad, forex, vadeli işlemler, kripto para birimleri, hisse senetleri ve endeksler için dünyanın en güçlü ticaret göstergesidir ve yatırımcılara kârlı kalmaları için ihtiyaç duydukları tüm bilgileri ve araçları sağlar. Başlangıç ​​s
    147 USD
    ŞU ANDA %26 INDIRIMLI Yeni Başlayanlar veya Uzman Tüccarlar için En İyi Çözüm! Bu Gösterge benzersiz, yüksek kaliteli ve uygun fiyatlı bir ticaret aracıdır çünkü bir dizi tescilli özellik ve yeni bir formül ekledik. Sadece BİR grafik ile 28 Forex çifti için Döviz Gücünü okuyabilirsiniz! Yeni bir trendin veya scalping fırsatının tam tetik noktasını belirleyebildiğiniz için ticaretinizin nasıl gelişeceğini hayal edin? Kullanım kılavuzu: buraya tıklayın Bu ilk olan, orijinal! Değersiz bir
    148 USD
    Advanced Supply Demand
    Bernhard Schweigert
    4.93 (295)
    CURRENTLY 26% OFF !! Best Solution for any Newbie or Expert Trader! This indicator is a unique, high quality and affordable trading tool because we have incorporated a number of proprietary features and a new formula. With this update, you will be able to show double timeframe zones. You will not only be able to show a higher TF but to show both, the chart TF, PLUS the higher TF: SHOWING NESTED ZONES. All Supply Demand traders will love it. :) Important Information Revealed Maximize the potenti
    148 USD
    Şu anda %20 İNDİRİMLİ! Herhangi bir Acemi veya Uzman Tüccar için En İyi Çözüm! Bu gösterge paneli yazılımı 28 döviz çifti üzerinde çalışıyor. Ana göstergelerimizden 2'sine (Gelişmiş Para Birimi Gücü 28 ve Gelişmiş Para Birimi Dürtüsü) dayanmaktadır. Tüm Forex piyasasına harika bir genel bakış sağlar. Gelişmiş Para Birimi Gücü değerlerini, para birimi hareket hızını ve tüm (9) zaman dilimlerinde 28 Forex çifti için sinyalleri gösterir. Trendleri ve / veya scalping fırsatlarını belirlemek içi
    199 USD
    Entry Points Pro
    Yury Orlov
    4.72 (218)
    Yeniden boyamadan bir ticarete girmek için doğru sinyaller sağlayan MT5 için en iyi gösterge! Herhangi bir finansal varlığa uygulanabilir: forex, kripto para birimleri, metaller, hisse senetleri, endeksler. MT5 versiyonu burada Oldukça doğru alım satım sinyalleri sağlayacak ve bir alım satımı açıp kapatmanın en iyi zamanını size söyleyecektir. Göstergeyi ödeyen yalnızca bir sinyali işleme örneğiyle videoyu (6:22) izleyin! Çoğu tüccar, Giriş Noktaları Pro göstergesinin yardımıyla ilk işl
    125 USD
    Ultimate Sniper Dashboard
    Hispraise Chinedum Abraham
    4.65 (23)
    İndirimli fiyatı 299$! Fiyatlar gelecekte artabilir! Aşağıdaki açıklamayı okuyun! Ultimate Sniper Dashboard için En İyi Giriş Sistemi: NIHAI DINAMIK SEVIYELER. (Lütfen Ürünlerimi Kontrol Edin) Ultimate Sniper Dashboard, MT4 çoklu para birimi test limitleri nedeniyle SADECE canlı piyasalarda çalışır. Ultimate-Sniper Dashboard ile tanışın! Hem HA-Sniper hem de MA-Sniper içeren en iyimiz. ve birçok özel mod. Ultimate Sniper Dashboard mutlak bir canavar! Herhangi bir Acemi veya Uzman Tüccar
    299 USD
    GOLD Impulse with Alert
    Bernhard Schweigert
    3.67 (3)
    Bu gösterge, 2 ürünümüz Advanced Currency IMPULSE with ALERT  +   Currency Strength Exotics  'in süper bir kombinasyonudur. Tüm zaman dilimleri için çalışır ve 8 ana para birimi artı bir Sembol için grafiksel olarak güç veya zayıflık dürtüsünü gösterir! Bu Gösterge, Altın, Egzotik Çiftler, Emtialar, Endeksler veya Vadeli İşlemler gibi herhangi bir sembol için para birimi gücü ivmesini göstermek için uzmanlaşmıştır. Türünün ilk örneğidir, Altın, Gümüş, Petrol, DAX, US30, MXN, TRY, CNH vb.
    149 USD
    Currency Strength Exotics
    Bernhard Schweigert
    4.84 (25)
    ŞU ANDA %20 INDIRIMLI! Herhangi bir Acemi veya Uzman Tüccar için En İyi Çözüm! Bu Gösterge, Egzotik Çiftler Emtialar, Endeksler veya Vadeli İşlemler gibi herhangi bir sembol için para birimi gücünü göstermek için uzmanlaşmıştır. Türünün ilk örneğidir, Altın, Gümüş, Petrol, DAX, US30, MXN, TRY, CNH vb. gerçek para birimi gücünü göstermek için 9. satıra herhangi bir sembol eklenebilir. Bu benzersiz, yüksek kaliteli ve uygun fiyatlı bir ticaret aracıdır çünkü bir dizi tescilli özelliği ve yeni
    128 USD
    Ultimate Dynamic Levels
    Hispraise Chinedum Abraham
    4.88 (8)
    Şu anda tatil indiriminde $399! Fiyatlar gelecekte artabilir. Aşağıdaki açıklamayı okuyun!  Ultimate Sniper Dashboard için EN İYİ Giriş Göstergesi olan Ultimate Dynamic Levels ile tanışın! Son derece Düşük Riskli zamanında girişler ve yüksek RR!!! Ultimate Sniper Dashboard'u BURADA bulabilirsiniz. Hem yeni başlayanlar hem de profesyonel tüccarlar için en önemli yetenek, bir piyasanın tam olarak nereye ve ne zaman dönme olasılığının en yüksek olduğunu ve güvenli bir şekilde nasıl girileceğini
    199 USD
    A. A2SR nedir ?   * Önde gelen bir teknik göstergedir (yeniden boyama yok, gecikme yok). -- Rehberlik : -- https://www.mql5.com/en/blogs/post/734748/page4#comment_16532516 adresinde -- ve https://www.mql5.com/en/users/yohana/blog A2SR, Destek (talep) ve Direnç (arz) seviyelerini belirlemede özel bir tekniğe sahiptir. İnternette gördüğümüz sıradan yoldan farklı olarak A2SR, gerçek SR seviyelerini belirlemede özgün bir konsepte sahiptir. Orijinal teknik internetten alınmadığı gibi internette
    386 USD
    Supply and Demand Dashboard PRO
    Bernhard Schweigert
    4.8 (20)
    Şu anda %20 İNDİRİMLİ! Bu gösterge paneli, birden fazla sembol ve 9 zaman dilimine kadar çalışan çok güçlü bir yazılım parçasıdır. Ana göstergemize dayanmaktadır (En iyi yorumlar: Advanced Supply Demand ).     Gösterge paneli harika bir genel bakış sağlar. Gösterir:    Bölge mukavemet derecesi dahil filtrelenmiş Arz ve Talep değerleri, Bölgelere/ve bölgeler içindeki pip mesafeleri, İç içe geçmiş bölgeleri vurgular, Tüm (9) zaman dilimlerinde seçilen semboller için 4 çeşit uyarı verir. Kişis
    199 USD
    MetaBands M4
    Vahidreza Heidar Gholami
    5 (1)
    MetaBands uses powerful and unique algorithms to draw channels and detect trends so that it can provide traders with potential points for entering and exiting trades. It’s a channel indicator plus a powerful trend indicator. It includes different types of channels which can be merged to create new channels simply by using the input parameters. MetaBands uses all types of alerts to notify users about market events. Features Supports most of the channel algorithms Powerful trend detection algorith
    129 USD
    Attention! Friends, since there have been many scammers on the Internet recently selling indicators called ForexGump, we decided to warn you that only on our page is the LICENSE AUTHOR'S VERSION of the INDICATOR sold! We do not sell this indicator on other sites at a price lower than this! All indicators are sold cheaper - fakes! And even more often sold demo versions that stop working in a week! Therefore, in order not to risk your money, buy this indicator only on this site! Forex Gump Scalpin
    147 USD
    PZ Harmonacci Patterns
    PZ TRADING SLU
    3.43 (7)
    This is arguably the most complete harmonic price formation auto-recognition indicator you can find for the MetaTrader Platform. It detects 19 different patterns, takes fibonacci projections as seriously as you do, displays the Potential Reversal Zone (PRZ) and finds suitable stop-loss and take-profit levels. [ Installation Guide | Update Guide | Troubleshooting | FAQ | All Products ] It detects 19 different harmonic price formations It plots primary, derived and complementary Fibonacci pro
    249 USD
    An extremely convenient indicator that truly makes the process of making money on the exchange easy. It is based on the scientifically rigorous theory of the market developed by the author, the beginning of which is presented here .               The indicator calculates the most probable price movement trajectory and displays it on the chart. Based on the predicted price movement trajectory, the indicator calculates the direction of the position and the position of the take profit
    139 USD
    MTF Supply Demand Zones
    Georgios Kalomoiropoulos
    4.81 (21)
    Yeni Nesil Otomatik Arz ve Talep Bölgeleri. Her Grafikte Çalışan Yeni ve Yenilikçi Algoritma. Tüm Bölgeler Piyasanın Fiyat Hareketine Göre Dinamik Olarak Oluşturulmaktadır. İKİ TÜR UYARI --> 1) FİYAT BİR BÖLGEYE ÇIKTIĞINDA 2) YENİ BİR BÖLGE OLUŞTURDUĞUNDA Bir tane daha işe yaramaz gösterge almazsın. Kanıtlanmış Sonuçlarla eksiksiz bir Ticaret Stratejisi elde edersiniz.     Yeni özellikler:     Fiyat Arz/Talep Bölgesine ulaştığında uyarılar     Yeni bir Arz/Talep Bölgesi olu
    149 USD
    Tricky to find and scarce in frequency, divergences are one of the most reliable trading scenarios. This indicator finds and scans for regular and hidden divergences automatically using your favourite oscillator. [ Installation Guide | Update Guide | Troubleshooting | FAQ | All Products ] Easy to trade Finds regular and hidden divergences Supports many well known oscillators Implements trading signals based on breakouts Displays suitable stop-loss and take-profit levels Configurable oscill
    175 USD
    Trade system "PAX Multi TMA/HMA 8" it is a ready-made trading system for trading on any instrument and any timeframe. An experienced trader on one instrument can get a profit from 100% to 400% per day . Completely ready for manual trading and use in robots. Not redrawn. It is convenient to work on timeframes M30, H1, H4. Tested on metals, currency pairs, oil, international stocks, Russian stocks, cryptocurrencies, monetary and cryptocurrency indices. What the trading system cons
    144 USD
    Please send me Direct message on MQL5 CHAT after purchasing the Indicator for Training and Installation Support There are some additional files that is important to use with the Indicator . So be sure to contact me after purchasing the Indicator So that I can add you for training and support . If you find any difficulty with installation then send me Direct message here So that I can connect with you via Anydesk or Teamview for the product installation. " Smart Order Block Indicator " to find
    249 USD
    Robot Choppiness
    Diego Mauricio Padilla Mendez
    5 (1)
    Choppines robotu, MT4 göstergeler klasöründe bir gösterge olarak yüklenir 5 dakikalık bir şamdan zaman çerçevesi kullanılması tavsiye edilir, önerilen robot son kullanma süresi 5 dakikadır. Robot, MT2, MX2, PRICEPRO platformlarına sinyal gönderecek şekilde yapılandırılabilir. Sinyal göndermek için çalışmak istediğiniz platformun bağlayıcı programını kullanmalısınız. Konnektöre takmak için aşağıdaki prosedürü uygulayın (MT2 platform konnektörü ile yapılandırmayı açıklayan bir resim eklenmi
    599 USD
    Quantum Currency Matrix Indicator
    QUANTUM TRADING SOFTWARE LIMITED
    Of all the four principle capital markets, the world of foreign exchange trading is the most complex and most difficult to master, unless of course you have the right tools! The reason for this complexity is not hard to understand. First currencies are traded in pairs. Each position is a judgment of the forces driving two independent markets. If the GBP/USD for example is bullish, is this being driven by strength in the pound, or weakness in the US dollar. Imagine if we had to do the same thing
    197 USD
    Price Action Entry Alerts
    Stephen Sanjeeve Sahayam
    5 (2)
    Bu gösterge, alış veya satış baskısı için her çubuğu tarar ve en yüksek hacme sahip 4 tip mum modelini tanımlar. Bu mumlar daha sonra Alış veya Satış sinyallerini göstermek için birkaç doğrusal filtre kullanılarak filtrelenir. Sinyaller, daha yüksek zaman çerçevesi yönüyle bağlantılı olarak ve yüksek hacimli saatlerde alım satım yapıldığında en iyi sonucu verir. Tüm filtreler özelleştirilebilir ve bağımsız çalışır. Bir düğmeyi tıklayarak tek bir yönün sinyallerini görüntüleyebilir. Sinyaller he
    145 USD
    Blitz Scalper
    Cengiz Erkoyuncu
    Blitz Scalper, Forex piyasasında hızlıca karlı işlem fırsatları, yani GİRİŞ-ÇIKIŞ, gibi işlemleri belirlemeye yardımcı olan, fiyat hareketine dayalı bir scalping göstergesidir. Bu gösterge, birden fazla zaman diliminde çalışmak için optimize edilmiş ana döviz çiftleri ile çalışır. Blitz Scalper göstergesi, fiyat hareketi, destek direnç ve trend analizi gibi güçlü ticaret stratejilerinin bir kombinasyonuna dayanır. Bu faktörleri analiz ederek, gösterge yüksek olasılıklı işlem fırsatlarını belirl
    250 USD
    THEQ Volumen
    Luis Alberto Vazquez Carpio
    5 (1)
    THEQ Volume is a volume oscillator. Trade following trends or possible reversal. THEQ Volume also includes THEQ Volume Arrows, indicator with signals and alerts, and THEQ Volume EA for real / demo, backtesting and optimizing or make your own strategy. Additional indicator and Robot EA are shipped separately after payment. THEQ Volume does not repaint, has no lag and the signals never disappear when the candle closes. It also has a pre-signal to be ready and get into the market fast. You will hav
    495 USD
    All in One Trade
    Alexey Minkov
    4.46 (26)
    The main purpose of the All-in-One Trade Indicator (AOTI) is determining the daily targets for EURUSD, EURJPY, GBPUSD, USDCHF, EURGBP, EURCAD, EURAUD, AUDJPY, GBPAUD, GBPCAD, GBPCHF, and GBPJPY. All other modules work on any instruments. The indicator includes many features: Double Channel trend direction, Price channel, MA Bands, Fibo levels, Climax Bar detection, etc. The indicator is designed to simplify the analysis of the market, and it is based on several trading strategies that I apply to
    148 USD
    TrendfollowerSR
    Paul Reymkhe
    4.91 (118)
    Take Your Trading Experience To the Next Level ! and get the exclusive TFSR-Analyzer for free !    So you have all these outstanding features  on up to 20 symbols and all timeframes in a smart and clear Design. Correct identification of the trends  in stock investments are pivotal and TrendFollowerSR ensures this perspective while displaying the correct trend on multiply timeframes to help you go long way as much as possible. The latest technology of the Indicator enables to track whether if
    149 USD
    TPA True Price Action indicator reveals the true price action of the market makers through 100% non-repainting signals (except early signals mode) strictly at the close of a candle! TPA shows entries and re-entries, every time the bulls are definitely stronger than the bears and vice versa. Not to confuse with red/green candles. The shift of power gets confirmed at the earliest stage and is ONE exit strategy of several. There are available now two free parts of the TPA User Guide for our custo
    168 USD
    Allows multiple indicators to be combined into a single indicator, both visually and in terms of an alert. Indicators can include standard indicators, e.g. RSI, CCI, etc., and also Custom Indicators, even those purchased through Market, or where just have the ex4 file. An early alert is provided, say when 4 out 5 indicators have lined up, and a confirmed alert when all are in agreement. A‌lso features a statistics panel reporting the success of the combined indicator by examining the current cha
    149 USD
    Predictor PRO MT4
    Evgenii Aksenov
    5 (1)
    A new generation PROgressive indicator from INFINITY. Predictor PRO uses its own entry and exit calculation strategy. Indicator without redrawing signals! This is very important for real trading. The indicator can be used for any currency pairs, metals, cryptocurrencies or indices. The best time of the H1 chart. Unlike other indicators, Predictor PRO shows shows the Buy/Sell entry point and the Close exit point. Calculating the profit of all signals in points on the panel helps to choose th
    125 USD
    MT5 Version TTM Squeeze Momentum TTM Squeeze Momentum is an enhanced indicator ideal for recognizing consolidation periods in the market and the start of the next explosive move. This improved version is a volatility indicator based on John Carter's "TTM Squeeze" in which the histogram is based on a linear regression rather than a simple momentum indicator. Red dots on the middle line indicate that the market has entered a "Squeeze" zone or consolidation period, indicated in this enhanced vers
    129 USD
    Yazarın diğer ürünleri
    Blahtech Supply Demand MT5
    Blahtech Limited
    4.45 (11)
    Supply Demand uses previous price action to identify potential imbalances between buyers and sellers. The key is to identify the better odds zones, not just the untouched ones. Blahtech Supply Demand indicator delivers functionality previously unavailable on any trading platform. This 4-in-1 indicator not only highlights the higher probability zones using a multi-criteria strength engine, but also combines it with multi-timeframe trend analysis, previously confirmed swings and engulfing detecto
    99 USD
    Blahtech VWAP - Volume Weighted Average Price (VWAP) is the ratio of price to total volume. It provides an average price over a specified time interval.  Links [  Install  |  Update  |  Documentation   ] Feature Highlights Configurable VWAP Line Sessions, intervals, anchored or continuous Previous day settlement line Standard Deviation bands Alerts at bar close or real time Automatic Broker or Tick volumes Significantly reduced CPU usage Input Parameters Max Bars   - Restrict the number of
    49 USD
    Market Profile defines a number of day types that can help the trader to determine market behaviour. A key feature is the Value Area, representing the range of price action where 70% of trading took place. Understanding the Value Area can give traders valuable insight into market direction and establish the higher odds trade. It is an excellent addition to any system you may be using. Blahtech Limited presents their Market Profile indicator for the MetaTrader community. Inspired by Jim Dalton’s
    99 USD
    Blahtech VWAP
    Blahtech Limited
    5 (1)
    Blahtech VWAP - Volume Weighted Average Price (VWAP) is the ratio of price to total volume. It provides an average price over a specified time interval.  Links [  Install  |  Update  |  Documentation   ] Feature Highlights Configurable VWAP Line Sessions, intervals, anchored or continuous Previous day settlement line Standard Deviation bands Alerts at bar close or real time Automatic Broker or Tick volumes Significantly reduced CPU usage Input Parameters Max Bars   - Restrict the number of
    49 USD
    Blahtech Market Profile
    Blahtech Limited
    4.63 (19)
    Market Profile defines a number of day types that can help the trader to determine market behaviour. A key feature is the Value Area, representing the range of price action where 70% of trading took place. Understanding the Value Area can give traders valuable insight into market direction and establish the higher odds trade. It is an excellent addition to any system you may be using. Blahtech Limited presents their Market Profile indicator for the MetaTrader community. Inspired by Jim Dalton’s
    99 USD
    Blahtech Candle Timer
    Blahtech Limited
    4.8 (81)
    Over 100,000 users on MT4 and MT5 Blahtech Candle Timer displays the remaining time before the current bar closes and a new bar forms. It can be used for time management Links [  Install  |  Update  |  Training  ] Feature Highlights The only candle timer on MT4 with no stutter and no lag S electable Location Tracks server time not local time Multiple colour Schemes Configurable Text Customisable alerts and messages Optimised to reduce CPU usage Input Parameters Text Location   - Beside / Upper
    FREE
    Blahtech Candle Timer MT5
    Blahtech Limited
    4.73 (89)
    Over 100,000 users on MT4 and MT5 Blahtech Candle Timer displays the remaining time before the current bar closes and a new bar forms. It can be used for time management Links [  Install  |  Update  |  Training  ] Feature Highlights The only candle timer on MT5 with no stutter and no lag S electable Location Tracks server time not local time Multiple colour Schemes Configurable Text Customisable alerts and messages Optimised to reduce CPU usage Input Parameters Text Location - Beside / Upper L
    FREE
    Blahtech Daily Range
    Blahtech Limited
    4.83 (6)
    Blahtech Daily Range indicator displays the average daily range alongside the individual session ranges. Using the daily open price as a reference the indicator shows fixed range and dynamic range targets as lines on the charts. These lines clearly show when the average range has been exhausted. Daily and session ranges can be useful for confirming entries or setting targets and is an excellent odds enhancer for many trading systems. Links [  Documentation   |   Install  |  Update  |  Training  
    34 USD
    Blahtech Moving Average indicator is a multitimeframe version of the standard Moving Average indicator. It is also enhanced with customisable alerts, period breaks and other configuration options. The 50 day and 200 day moving averages are widely followed by investors and traders, with breaks above and below the MA lines considered to be signals of interest. Links [  Install  |  Update  |   Training   |   All Products  ] Feature Highlights Up to three timeframes Configurable calculation variab
    FREE
    Blahtech Better Volume provides an enhanced version of the vertical volume bars. Each bar is compared to the previous 20 bars. Depending on its volume, range and volume density it will be assigned a state and colour. Low Volume – Minimum volume High Churn   – Significant volume with limited movement Climax Neutral –   High volume with unclear direction Climax Up   – High volume with bullish direction Climax Dn   – High volume with bearish direction Climax Churn – High volume with restricted mo
    31 USD
    Blahtech Moving Average
    Blahtech Limited
    4.5 (6)
    Blahtech Moving Average indicator is a multitimeframe version of the standard Moving Average indicator. It is also enhanced with customisable alerts, period breaks and other configuration options. The 50 day and 200 day moving averages are widely followed by investors and traders, with breaks above and below the MA lines considered to be signals of interest. Links [  Install  |  Update  |   Training   |   All Products  ] Feature Highlights Up to three timeframes Configurable calculation variab
    FREE
    Blahtech Fisher Transform indicator is an oscillator that displays overbought and oversold locations on the chart. The Fisher Transform algorithm transforms prices with any distribution shape into a normal distribution. The end result is a curve with sharp turning points that may help to identify bullish or bearish trends. Fisher Transform values exceeding 1.66 on the daily chart are considered to be good areas for reversal trades. Links [  Install  |  Update  |  Training   |  All Products  ]
    33 USD
    Blahtech Better Volume
    Blahtech Limited
    5 (1)
    Blahtech Better Volume provides an enhanced version of the vertical volume bars. Each bar is compared to the previous 20 bars. Depending on its volume, range and volume density it will be assigned a state and colour. Low Volume – Minimum volume High Churn   – Significant volume with limited movement Climax Neutral –   High volume with unclear direction Climax Up   – High volume with bullish direction Climax Dn   – High volume with bearish direction Climax Churn – High volume with restricted mo
    31 USD
    Blahtech Fisher Transform indicator is an oscillator that displays overbought and oversold locations on the chart. The Fisher Transform algorithm transforms prices with any distribution shape into a normal distribution. The end result is a curve with sharp turning points that may help to identify bullish or bearish trends. Fisher Transform values exceeding 1.66 on the daily chart are considered to be good areas for reversal trades. Links [  Install  |  Update  |  Training   |  All Products  ]
    33 USD
    Filtre:
    Man xola Man xola
    77
    Man xola Man xola 2023.03.23 05:04 
     

    One the best

    Nerijus1982
    348
    Nerijus1982 2022.08.08 15:58 
     

    On backtesting looks good.But in real conditions levels repainting and disappears even when they’re not broken.You just can’t trust them.

    Blahtech Limited
    159637
    Geliştiriciden yanıt James Cater 2022.09.27 14:38
    To reduce clutter, narrow levels formed from just two candles don't get displayed as old zones. If you want to display these levels set the parameter "Other Parameters / Min Bars For Old Levels" => 2
    Zakarias
    48
    Zakarias 2021.11.03 13:05 
     

    Awesome, i like the idea and its running very very good

    David Cooper
    38
    David Cooper 2021.08.03 03:32 
     

    A leading indicator very well done. Remember to wait for price to come to you.

    YHW1022221880
    170
    YHW1022221880 2021.07.27 12:19 
     

    Good supply and demand indicators

    vilem.iv
    121
    vilem.iv 2021.05.11 13:07 
     

    I never thought it will be possible for retail trader equipped with MT4 platform to read orderflow in realtime - Blahtech SnD is exactly what gave mi the "to the pip" reaction levels. With Market Profile, Average daily range and Market Stalkers course as "the wrap up of the logic behind the indicator": Retail trader has truly a chance to succes. Thanks to the team.

    efecetinel
    111
    efecetinel 2021.05.05 20:16 
     

    Perfect indicator, perfect owner. Thank you James

    Nicolas Dobrovsky
    527
    Nicolas Dobrovsky 2021.03.07 10:55 
     

    The best SR indicator on the market. It is necessary to set the indicator according to the trading style. I spent a lot of time testing different variants and settings. Everyone has to find what suits them.

    Edit: Backtest mode does not work properly, sometimes repaint. You always need to use the previous candle, otherwise you will have very different results in the real account.

    Frank Paetsch
    7292
    Frank Paetsch 2021.03.03 12:47 
     

    Good! thank you

    Kavindran Elangoven
    641
    Kavindran Elangoven 2021.03.01 02:55 
     

    for a person who doesnt know how to trade, this indicator wont be helpful at all, but if you are a experience trader in the markets but sometimes are unconfident about the levels you are watching, and with the knowledge you already have about the markets to develop a bias on your trading day. this can be a game changer

    DilliBab
    19
    DilliBab 2021.02.23 15:05 
     

    Hi Friends this indicator am using last one day ,can you tell me how to use this, where we go short and long.please explain me anybody friends...+91 9952104997 my whatsapp number

    njs7891
    124
    njs7891 2021.01.04 16:30 
     

    The levels this indicator shows are very good and make it easy to see where price is likely to react from. I like the hotkey features to cycle between higher timeframe levels as you can quickly spot levels you may have missed when zoomed into a lower timeframe. The backtesting feature is also great and very useful. Good support also. Great indicator.

    Ng Choong Huan
    204
    Ng Choong Huan 2020.12.09 07:04 
     

    This is perfect indicator S/D which auto calculate a lot of data (score or those complicate manual job). Well done. Love it so much

    finisheroffaith
    24
    finisheroffaith 2020.10.27 20:43 
     

    For those who say a free Supply and Demand indicator is just as good as this one. My first response would be have you bought this one, because there is no free supply and demand indicator that even comes remotely close to this indicator that I know of. This indicator is absolutely awesome. The features are outstanding. It is not' your standard free supply and demand indicator.I fill it is money well spent. If you are not educated with the supply and demand method that may change your perception of the worth of the indicator. I say don't buy something you are not educated on.I also say don't let someone make an evaluation for you they are not educated on.

    T3chAddict
    59
    T3chAddict 2020.09.17 15:11 
     

    Fast and reliable indicator. Not 'heavy' on the system. Apart from not wasting time to plot my own SD zones the back-test mode is super handy.

    Martin Freiherr Von Mirbach Doring
    507
     

    Unfortunately not a good indicator. Too bad about the money. My free indicator, which I used for a long time, is much better and more reliable.

    hashmi007
    100
    hashmi007 2020.06.10 19:11 
     

    Excellent indicator.I use it with my Bollinger/MA crossover strategy and blahtech provides me with accurate Target zones.great tool.

    Bradley Bosworth
    335
    Bradley Bosworth 2020.01.14 06:32 
     

    Awesome Indicator, but I'm trying to install on my computer (same one I originally installed) and it claims I've used all my "activations" when I've had to reinstall mt4 multiple times. I guess that counts as an activation even though it's the same PC?

    hkarram
    288
    hkarram 2019.10.20 15:29 
     

    Excellent indicator ..... a must for any supply demand trader ...... the backtest mode is a great tool ...... thanks for the developers

    Trader mql5
    1153
    Trader mql5 2019.10.11 02:01 
     

    The free S/D indicators are good enough for amateur traders. But for fine-tuning to my professional needs this is a good start (lol - always give space for future improvements). Love it!!

    12
    İncelemeye yanıt
    Sürüm 4.0 2022.05.12
    - Overall Trend - Add "Three In A Row" option to highlight trend when all three timeframe trends align
    - Hotkeys - Zone Visibility - With Trend - Hide zones with unknown trend status
    - Alerts - Zone Visibility - Alow user to filter visibility independent of the display hotkey setting
    Sürüm 3.9 2022.04.11
    - New Alerts - Stop excessive alerts being generated when multiple timeframes are active
    Sürüm 3.8 2022.02.07
    - Block invalid alerts that were triggered when broker resets data feed
    - Improve level tooltip texts to always include nested info
    - Summary Panel - Add parameter Trend Show Consolidation Dots
    - Summary Panel - Rename parameter Engulfings - Stop Loss to Engulfings - Viable Size
    Sürüm 3.7 2021.05.05
    Enhancements
    - Timeframes - Add new timeframe options - Current Plus One / Two / Three
    - Profiles - Add parameter "Clear Hotkeys On Terminal Close" to improve profile switching on MT5
    - Offline Charts - Add support for offline charts and backtest tools with missing market data and unsynced current time

    Fixes
    - Summary Panel - Q Points - Improve accuracy of real time updates
    - Summary Panel - Q Points - Ensure text is positioned correctly in the center of the box
    - Trend Change - Incremental - Check that BarNum >= MinBarsOldZones
    - Mouse Events - Keep CHART_EVENT_MOUSE_MOVE enabled if other indicators are waiting on mouse events
    Sürüm 3.6 2021.04.20
    Enhancements
    - MT5 - Add support for extended timeframes
    - Trend Worm - Add option to display Trend Worm and/or Consolidation Worm on the chart
    (Due to a platform issue, MT5 users may need to re-attach the indicator to see the Trend Worm)

    Performance
    - Clear Hotkey - Improve performance of clear chart calls
    - Redraw - Remove ObjectsDeleteAll calls that slow other indicators with many objects
    Sürüm 3.5 2021.04.02
    Fixes
    - Summary SupDem - Apply Filters to SupDem column
    - iCustom - Apply Filters to iCustom buffers
    - iCustom - Improve Blahtech Expert Advisor Examples
    - Alerts - Add MinBarsLevel and PriceAway filters to alerts
    - Overall Move - Fix edge case where Overall Move wasn't being calculated correctly
    Sürüm 3.4 2021.03.24
    Enhancements
    - Enable filters whenever an individual filter is changed in the GUI
    - iCustom - Refactor EA code examples into class to support cleaner multiple instances

    Fixes
    - Summary SupDem - Improve highlighting of overlapped zones
    - Consolidations - Fix edge case when near MaxBars
    - Allow user to configure Timeframes 1-4 in any order
    - Allow experts to operate on higher timeframes than the current chart period
    - Change format of diff files to support iCustom development
    - Only populate iCustom buffers if they are enabled and used
    - Change position of Overall Move filter to the top half of the GUI
    Sürüm 3.3 2021.03.08
    Enhancements
    - Summary Trend - Display dot next to the trend direction when recent bars are consolidating
    - Filters - Add Max Levels filter to allow the user to restrict the number of levels on the chart
    - Zone Highlight - Add parameter to change highlighting mode (None/Strength/Untouched)
    - Parameters - Write simple list of changed parameters to experts log when Ctrl+Q keys are pressed
    - Parameters - Create detailed report of changed parameters in Files/Blahtech directory to assist users and support

    Fixes
    - Q Points - Add Min Risk Reward parameter
    - Trend Change - Add Min Range and rename Min Risk Reward parameters
    - Overall Trend Alerts - Print all three timeframe directions in alert message
    - Summary SupDem - Improve highlighting accuracy with overlapped zones
    - Old Zones - Enable detection of old zones with just two bars
    - Consolidation - Fix edge case in consolidation zones detection
    - Hotkeys - Revert regression from 3.1 release where [ and ] were swapped round
    - Expert Advisor Mode - Change to a single option named "Reserved For iCustom Calls"
    Sürüm 3.2 2021.01.20
    Enhancements
    - Alerts - Add parameter "Filter Nested (Levels)" to control raising alerts for nested zones only
    - Alerts - Add parameter "Trigger Alerts Early" to trigger touch/break alerts N points before the level
    - Hotkey Panel - Add "Alerts Nest" button to allow user to modify the nested zone filter from the GUI
    - Summary - Alerts panel - Add icon next to title to show "Trigger Early Alerts" points value
    - Summary - Alerts panel - Improve alerts icon tooltips
    - Touches - Increase accuracy of Touches and add optional Touch/Untouch points parameters
    - Info - Add parameter to control the precision of the {lots1} substitution string
    - Info - Add a second user custom format string

    Fixes
    - Alerts - Fix edge case where duplicate alerts could be raised
    - Alerts - Remove overlaps from Retouch alerts and apply filters to New alerts
    - Alerts - Don't raise alerts for levels hidden from display by the "Zone Visibility" parameter
    - Alerts - Improve text format, add bid price and number of touches
    - Trend Change - Modify trend change parameter to OVERLAP_ALL to improve consistency of trend reversals
    - Summary Panel - Improve accuracy of summary panel when price retraces from touched levels
    - Summary Panel - Optimise summary panel redraw to compensate for increased accuracy
    - HotKey Panel - Adjust panel Y location when position changed to Bottom left/right
    Sürüm 3.1 2019.10.17
    - Enable left mouse click actions on Hotkey panel when keys have been reserved
    Sürüm 3.0 2019.10.09
    Enhancements
    - Add a third mode to the Summary panel GUI to control all alerts
    - Alow user to set individual alert timeframes for Trend, Engulfings, QPoints and Levels
    - Allow M30,H4,D1 as well as 1,2,3 when setting alerts timeframe parameters
    - Enable Summary Timeframe Bubble Numbers by default
    - Add bubble numbers to QPoints and SupDem columns in the Summary panel
    - Add option to adjust the zone start bar of a level to the begining of a consolidation
    - Add Timeframe hints to the TF section of the Hotkey panel
    - Add {lots3} option to Info format

    Fixes
    - Change default colour of QPoint 2 from MediumOrchid to PaleVoiletRed
    - Change Invert Style and colour parameters to be more intuitive
    - Change text colour of oversized Q Points on the chart to Gray
    - Change Summary heading from TimeF to Time
    - Improve the behaviour of the Q Points hotkeys
    - Modify all lines drawn by the indicator to be unselectable
    - Include first bar in search for max move away of zones and Q Points
    - Reset hotkey settings when indicator is removed from chart or chart is closed
    - Only call TerminalInfoInteger to get ctrl status when key pressed or object clicked
    Sürüm 2.9 2019.07.18
    Fix issue when backtesting beyond Max Bars
    Sürüm 2.8 2019.06.19
    Enhancements
    - Add options to draw multi timeframe Q Points on the chart
    - Add GUI tab within HUD panel for control of filter parameters
    - Add extra filters for Nested Levels, Zone Size and Min Price Away
    - Change default values for live filters to disabled
    - Add option to choose method for Zone Height calculation - Default/Whole Body/Entire Candle
    - Add parameters to limit zone height "Zone Height Min" and "Zone Height Max"
    - Add iCustom Buffers for QPoint 1 Top Bar and QPoint 1 Bot Bar
    - Add option to display Total Move in custom format
    - Left clicking any description in the Hud Panel now resets the value back to its input parameter version

    Fixes
    - Change defaults to display more features on chart at startup
    - Check UserTickSize to stop divide by zero error
    - Check for empty iCustom buffer
    Sürüm 2.7 2018.05.30
    Enhancements
    - Option to disable highlighting of Strong Zones
    - Option to use Current Timeframe only for Overall Trend
    - Parameter to change corner anchor of Summary Display
    - Added Sup/Dem button to show only supplies or demands
    - Added filter for number of retouches
    - Added filter for levels that were formed by engulfing pattern
    - Added filter for max price away
    - Added filter for age of old zones in bars
    - Support alerts for trend changes
    - Support alerts for overall trend changes
    Sürüm 2.5 2017.08.29
    Enhancements
    - Support alerts for QPoint touches and breaks
    - Support alerts for up to 3 timeframes
    - Support inverted zone styles for the multi timeframe display
    - Remember hotkey states when restarting terminal
    - Support iCustom calls with 64+ parameters by using a set file

    Changes
    - Add tooltips to nested zone graphics
    - Add reserved keys parameter to prevent clashes with other products
    Sürüm 2.2 2017.04.06
    Enhancements
    - Support additional timeframes
    - Support alerts for engulfings
    - Draw zones one bar back if the conterminous line originates there
    - Changed colour and font of QPoints label when range greater than 15x average size
    - Separated old and active filters to simplify usage
    - Added advanced iCustom buffers for timeframes two and three
    - Added second demo mode to show extra timeframes
    = Summary Panel
    - Support clicking on timeframe values to show/hide zones
    - Support clicking on QPoint values to change focus
    - Disabled highlighting of QPoint value in pink/blue when range is less than 15x average range
    - Modified highlighting of SupDem values to only use pink/blue
    = Hotkeys
    - Reversed the order of hotkey changes when "Shift" key is pressed
    - Nudge both start and end of zones one bar forward when "X" key is pressed

    Fixes
    - Remember the QPoint timeframe set by the user when switching chart timeframes
    - Fixed the average bar size to match version 1.0 values (regression bug)
    - Rebuild with latest compiler for MetaTrader platform changes
    - Changed all global variables to be constant expressions
    Sürüm 2.1 2017.01.19
    Fixes
    - Resolved issues with iCustom calls

    Performance
    - Reduced overhead each tick to optimise Expert Advisor performance
    - Added Expert Advisor mode to skip creation and drawing of objects
    Sürüm 2.0 2016.12.09
    New Features
    - Alerts - User customisable
    - Engulfing detector - Multi-timeframe
    - Filters - User configurable visibility filters
    - Old Zones - Choice of broken levels or trend changes
    - Nested Zones - Highlight levels that are nested within higher timeframe zones
    - iCustom - Add buffers for developers

    Enhancements
    - Info - Add bubble scores
    - Scores - Normalise with-trend scores so they are always out of 8
    - Timeframes - Change mappings for M1 to M1/M5/M30
    - Strength Engine Mode - Allow user to relax the criteria for a strong zone
    - Calc Mode - Add option to disable incremental calculations
    - Demo Mode - Allow user to switch between default and demo settings
    = Summary display:
    - Show icons when filters are active
    - Highlight "extended" trend in deeper colour
    - Support clicking then dragging panel to new location
    = Hotkey display:
    - Add verbose display
    - Allow user to change value by clicking on the rows
    - Support clicking then dragging panel to new location
    - Highlight values that have changed from input parameter settings

    Fixes
    - Summary - Do not highlight countertrend levels when all three trends align
    - Scores - Change so the user enters 0-8 rather than 0.0-1.0 for the strong zone scores
    - Trend - Support DBD levels changing trend
    - Hotkeys - Update position when window height is changed
    - Backtest - Use TimeLocal for backtest expire so it works when market is closed
    - Reset - Force clear and redraw of all objects on Reset

    Architecture
    - Candle parser - Rewrite candle parse to enable old zones

    Performance
    - Implement incremental calculations to reduce CPU usage
    - Only refresh each tick if next level has been touched or broken
    - Only redraw Hotkey display if chart width has changed

    New Hotkeys
    - "9" - Demo mode
    - "=" - Strength Mode
    - "]" - Filters - All Zones
    - "[" - Filters - Old Zones
    - ";" - Old Zones
    - "'" - Old Zones Style
    - "#" - Nested Zones

    Developers and parameters
    - Developers - Twenty five iCustom buffers
    - Parameters - Fifty extra parameters to control new features
    - See documentation for details http://www.blahtech.co.uk/supplydemand
    Sürüm 1.1 2016.04.12
    - Bug Fix : Chart Zones - Hotkey "X" wasn't working on MN1 timeframe
    - Enhancement : Chart Zones - Add new Hotkey "Z" - Zone style (Applies to solo timeframe only)
    - Enhancement : Summary View - Highlight Active QPoint and differentiate between in the middle (---) and no QPoints ( )
    - Enhancement : Summary View - Change overall trend to use "Two Adjacent" rather than "Best Of Three"
    - Enhancement : Summary View - Improve Trend detection when we bust the top
    - Enhancement : Summary View - Improve SupDem highlighting to focus on QPoints as well as Trend
    - Enhancement : Summary View - Add Input parameter - Highlight SupDem in QPoint - Level Strength
    - Enhancement : Summary View - Shift text right one space when in full mode
    - Enhancement : Daylight Savings - UseDaylightSavings parameter - Change default to true
    - Enhancement : High Res Displays - WindowsDesktopScaling - Add parameter to support desktop scaling for 4K and other high res screens
    - Performance : Backtest Mode - Do not recalculate every tick when in backtest mode