Handelsroboter und Indikatoren für den MetaTrader 4 - 92

Imbalance Volume Trend ist ein professioneller Indikator für MetaTrader, der Fair Value Gap (FVG) / Imbalance-Zonen mit der Analyse von Volumen-Ungleichgewichten und einer auf Ungleichgewichten basierenden Trend-Engine kombiniert. Der Indikator findet automatisch bullische und bearische Fair Value Gaps, malt sie auf dem Chart als farbige Rechtecke und berechnet den prozentualen Anteil des Volumens der Käufer gegenüber den Verkäufern (oder umgekehrt) innerhalb der Ausbruchskerze, die das Ungleich

Callous EA – Regelbasiertes automatisiertes Handelssystem für Metatrader4
Callous EA ist ein regelbasierter Expert Advisor, der für vollautomatisierte Transaktionen an den Finanzmärkten entwickelt wurde. Das System analysiert Marktdaten in Echtzeit und eröffnet, verwaltet und schließt Positionen automatisch gemäß vordefinierten algorithmischen Regeln – ohne menschliches Eingreifen. Für dieses Produkt wird keine Gewinn- oder Renditegarantie gegeben. Die Performance kann je nach Marktbedingung
Aureus Volatilitätsmatrix - Professionelles adaptives Handelssystem Universeller Multi-Asset Expert Advisor für Gold, Indizes & Forex Aureus Volatility Matrix ist ein hochentwickelter, brokerunabhängiger Expert Advisor, der für professionelle Händler entwickelt wurde, die Zuverlässigkeit, Präzision und Anpassungsfähigkeit über mehrere Anlageklassen hinweg verlangen. Dieser EA wurde von Grund auf entwickelt, um die einzigartigen Herausforderungen des modernen algorithmischen Handels zu meistern.

Liquidity Channels Pro MT5 VERSION HIER Liquidity Channels ist ein hochentwickeltes Smart Money Concepts (SMC) Tool, das die Identifizierung von Buy Side Liquidity (BSL) und Sell Side Liquidity (SSL) automatisiert . Im Gegensatz zu Standard-Unterstützungs- und -Widerstandsindikatoren zeichnet dieses Tool nicht nur Linien, sondern projiziert dynamische, sich ausdehnende Kanäle auf der Grundlage der Volatilität (ATR) von wichtigen Pivot-Punkten. Entscheidend ist, dass es der von institutionellen H
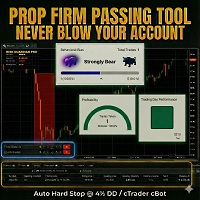
RiskGuardian Pro (MT4 Edition) - Der ultimative Prop-Firm-Kontenschützer
Sind Sie es leid, bei Ihren Prop-Firm-Challenges (FTMO, MFF usw.) aufgrund eines einzigen emotionalen Trades oder eines momentanen Fehlers im Risikomanagement zu scheitern? RiskGuardian Pro ist Ihr Obligatorisches Disziplin-System, das Ihnen hilft, Bewertungen zu bestehen und Ihr finanziertes Konto zu schützen.
Gelöste Kernprobleme:
* Anti-Tilt-Hard-Lock: Schließt sofort alle Trades und sperrt das Terminal in dem Mom
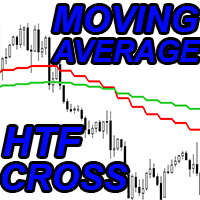
Crypto_Forex-Indikator „HTF Moving Averages Cross“ für MT4.
– Verbessern Sie Ihre Handelsmethoden mit dem leistungsstarken HTF Moving Averages Cross-Indikator für MT4. HTF steht für „höherer Zeitrahmen“. – Dieser Indikator eignet sich hervorragend für Trendtrader mit Price-Action-Einträgen. – Er ermöglicht Ihnen, schnelle und langsame gleitende Durchschnitte aus einem höheren Zeitrahmen an Ihren aktuellen Chart anzuhängen – eine professionelle Methode. – HTF MAs Cross verfügt über integrierte
Übersicht
Alpha Price Trap Support Resistance EA ist ein automatisierter Expert Advisor für MetaTrader 4.
Er wurde mit einem Break-and-Retest-Ansatz für Unterstützungs- und Widerstandszonen entwickelt.
Der EA erkennt die Zonen anhand der Preisstruktur, wartet auf einen bestätigten Bruch bei Kerzenschluss und platziert dann eine Limit-Order im Retest-Bereich.
Zu den Risikokontrollen gehören eine prozentuale Größenbestimmung (falls verfügbar), eine strukturelle Stop-Loss-Platzierung und konfigurie
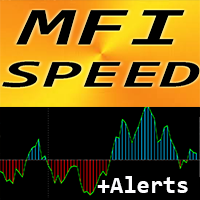
Crypto_Forex-Indikator „MFI Speed“ für MT4, kein Repaint.
– Die Berechnung dieses Indikators basiert auf physikalischen Gleichungen. MFI Speed ist die erste Ableitung von MFI selbst. – Money_Flow_Index (MFI) ist ein technischer Oszillator, der Preis- und Volumendaten zur Identifizierung überverkaufter und überkaufter Zonen nutzt. – MFI Speed eignet sich gut zum Scalping von Momentum-Einstiegen in Richtung des Haupttrends. – Verwenden Sie ihn in Kombination mit einem geeigneten Trendindikat

**GOLD Animal** ist ein Expert Advisor (EA), der speziell für den Goldhandel entwickelt wurde. Er verwendet keine hochriskanten Strategien wie Martingale oder Grid Trading.
Er verwendet eine fortschrittliche algorithmische Erkennung für den Trendhandel, und jeder Handel verwendet einen Stop-Loss, um das Kapital zu schützen.
Der EA beinhaltet ein Geldmanagement zur automatischen Berechnung der Positionsgrößen.
Das Verhältnis von Gewinnmitnahme zu Stop-Loss ist größer als 1:3, was selbst bei e

ScalperTrailingEA - Hochfrequenz Scalping Expert Advisor ScalperTrailingEA ist ein robuster, vollautomatischer Scalping-Roboter für den kurzfristigen Handel auf den Zeitrahmen M1-H1 unter Verwendung von Pending Orders (BuyStop/SellStop). Der EA kombiniert ATR-basierte Volatilitätsfilterung , Spread-Kontrolle , dynamische Positionsgröße und Trailing-Stop-Management , um sich an wechselnde Marktbedingungen anzupassen und gleichzeitig eine strikte Risikodisziplin zu wahren. Der EA wurde für ECN/

Buy & Sell Levels with Alerts ist ein umfassender Trading-Indikator, der Stochastik, Vortages-Level, Multi-Timeframe-Trendmeter (MTF) und Rejection-Erkennung in einem einzigen leistungsstarken Tool kombiniert.
Er hilft Tradern, wichtige Unterstützungs- und Widerstandsbereiche, Trendrichtungen und hochwahrscheinliche Umkehrsignale schnell zu erkennen – mit visuellen Pfeilen und automatischen Alerts. Hauptfunktionen: Stochastischer Oszillator: Zeigt schnelle (%K) und langsame (%D) Linien in einem
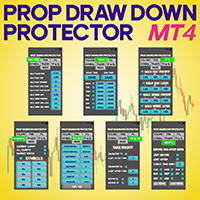
Prop Drawdown Protector Expert Advisor für MetaTrader 4 Der Prop Drawdown Protector Expert Advisor für MetaTrader 4 ist ein spezielles Risikomanagement-Tool, das für Prop-Trading-Profis entwickelt wurde, die die MT4-Plattform nutzen. Dieser fortschrittliche EA ermöglicht es Händlern, das Handelsverhalten zu kontrollieren, indem sie vordefinierte Bedingungen anwenden, die Verletzungen von Gewinn- und Verlustlimits verhindern. Mit sieben speziellen Konfigurationsmodulen stärkt der EA die psycholog

Mirathor - Intelligentes Handelssystem der nächsten Generation Mirathor ist ein vollautomatischer Expert Advisor, der für stabilen algorithmischen Handel unter dynamischen Marktbedingungen entwickelt wurde.
Er kombiniert Preisaktionsmodelle , dynamische Niveaus , Marktstrukturanalysen und adaptives Risikomanagement und schafft so ein robustes System, das auf allen Kontotypen mit minimalen Benutzereingriffen reibungslos funktioniert. Die Standardoptimierung wird für GBPUSD, M30 durchgeführt, abe

Position Size Calculator PRO MT4 V2.0 – Lot-Berechnung + visuelle SL/TP-Zonen (Drag & Drop) für schnelleres und präziseres Risikomanagement Position Size Calculator PRO MT4 V2.0 ist ein Position-Sizing - (Money-Management-) Indikator für MetaTrader 4. Er berechnet automatisch die optimale Lotgröße basierend auf Ihrem Risiko pro Trade , der Stop-Loss -Distanz und den Symbol-Eigenschaften (Tick Value, Tick Size, Margin, Hebel usw.). Version 2.0 ist ein großes Upgrade: Statt nur ein Panel abzulesen
Dies ist nur die MT4-Version. Für MT5 besuchen Sie: https://www.mql5.com/en/market/product/156005/
Ausführlicher Blog-Beitrag mit Bildschirmabbildungen: https://www.mql5.com/en/blogs/post/765529
Funktionen im Überblick Bull und Bear Power Visualisierung: Histogramme, Linien oder Bänder Kombinierter Bull/Bear Power (BBP) Modus: Zur Anzeige der Netto-Power-Balance Farben anpassen: für sofortige Mustererkennung Glättung (optional): reduziert das Rauschen für sauberere Signale Zusätzliche Filtero

Baba Vanga Smart Scalper – Expert Advisor
Empfohlenes Paar: XAUUSD
Empfohlener Zeitrahmen: M5 / M15
Allgemeine Merkmale:
Dieser EA ist ein intelligenter Scalping-Roboter, der automatisierten Handel durchführt. Mit seiner benutzerfreundlichen Oberfläche zeigt er Ihre Kontoinformationen und Rentabilitätsdaten in Echtzeit auf dem Chart an.
Wichtigste Merkmale:
Risikomanagement: Automatische Lot-Berechnung basierend auf Ihrem Kontostand
Zeitsteuerung: Handelt nur während der von Ihnen

ForExMachina 2 - Die Quantitative Volatilitätsmaschine Automatisiertes Price Action Trading | Trendfolgende Ausbrüche | Smart Recovery (Präzisionsentwickelt für XAUUSD & volatile Devisenpaare)
Handeln mit maschineller Präzision Hören Sie auf, sich auf nachlaufende Indikatoren zu verlassen. ForExMachina 2 ist ein Handelsroboter der nächsten Generation, der entwickelt wurde, um die einzige Konstante auf den Finanzmärkten auszunutzen: Die Volatilität . Speziell für die MetaTrader 4-Plattform entwi
Simple Symbol Switcher ist ein leistungsstarker, aber intuitiver MT4-Indikator, der entwickelt wurde, um Ihren Trading-Workflow zu optimieren. Wechseln Sie sofort zwischen Symbolen und Zeitrahmen mit anpassbaren Tastaturkürzeln für blitzschnelle Chart-Navigation. Zu den Funktionen gehören eine saubere, minimalistische Spaltenoberfläche mit Ein-/Ausblenden-Funktionalität zur Maximierung des Bildschirmplatzes, Zoom-In/Out-Steuerungen für präzise Chart-Analysen und flexible Symbolverwaltung durch m
Smart Symbol Switcher - Fortschrittliches Chart-Navigationstool Optimieren Sie Ihren Trading-Workflow mit Smart Symbol Switcher, einem leistungsstarken MT4-Indikator, der für effizientes Multi-Symbol- und Multi-Timeframe-Management entwickelt wurde. Navigieren Sie nahtlos zwischen Instrumenten und Chart-Perioden mit anpassbaren Tastenkombinationen für blitzschnelle Ausführung. Zu den Funktionen gehören flexible Anzeigeoptionen mit farbigen oder einfachen Spaltenlayouts, einstellbare Zoom-Funktio
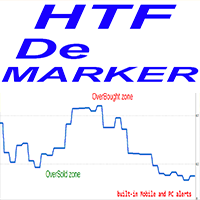
Crypto_Forex-Indikator HTF DeMarker für MT4.
- Dieser Indikator ist ein nützliches Tool, das von technischen Händlern verwendet wird, um Einstiegs- und Ausstiegspunkte zu finden. HTF steht für „Higher Time Frame“. - Die DeMarker-Oszillatorlinie zeigt die aktuelle Preisposition im Verhältnis zu vorherigen Hochs und Tiefs an. - DeMarker bietet die effizientesten regulären Divergenzsignale unter anderen Oszillatoren. - Die Überkaufszone liegt vor, wenn der DeMarker über 0,7 liegt, und die Überver

Dies ist mein zweiter Expert Advisor, der entwickelt wurde, um stetige monatliche Renditen im Bereich von 2-3% zu erzielen, mit einer glatten Aktienkurve und einem sehr geringen Drawdown . Er wurde über mehrere Jahre backgetestet, wobei jedes getestete Jahr konsistente Rentabilität zeigte. Der EA ist für EURUSD bei Brokern gedacht, die sehr niedrige Spreads anbieten, idealerweise ein ECN-Konto , und ist für den H1-Zeitrahmen optimiert. Die Strategie hinter diesem EA basiert auf einem Handelsansa
Dynamic Range Breaker EA: Präzisions-Goldhandel Erschließen Sie das volle Potenzial des Goldmarktes mit dem Dynamic Range Breaker EA . Dieser auf Präzision und Sicherheit ausgelegte Expert Advisor ist das ultimative Werkzeug für Trader, die konsistente Ergebnisse ohne den Stress risikoreicher Strategien wünschen. Dieses System ist vollständig für Gold (XAUUSD) auf dem M5-Zeitrahmen optimiert . Es handelt sich um eine komplette "Plug-and-Play"-Lösung - schließen Sie es einfach an Ihren Chart an u
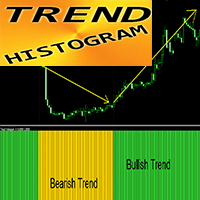
Crypto_Forex-Indikator „TREND-Histogramm“ für MT4, kein Repainting erforderlich.
– Das TREND-Histogramm ist deutlich sensitiver und effizienter als herkömmliche gleitende Durchschnitte. – Der Indikator kann in zwei Farben dargestellt werden: Gelb (Gold) für einen rückläufigen Trend und Grün für einen Aufwärtstrend (Farben können in den Einstellungen geändert werden). – Das TREND-Histogramm verfügt über integrierte Warnmeldungen für Mobilgeräte und PCs. – Dieser Indikator lässt sich ideal mit a
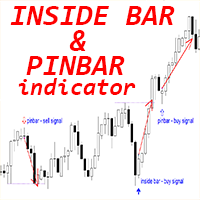
Crypto_Forex-Indikator „Inside Bar & PinBar Patterns“ für MT4 – ohne Neuzeichnung und Verzögerung.
– Der Indikator „Inside Bar & PinBar Patterns“ ist sehr leistungsstark für Price Action Trading. – Der Indikator erkennt Inside Bar- und PinBar-Muster im Chart: – Bullisches Muster – Blauer Pfeil im Chart (siehe Bilder). – Bärisches Muster – Roter Pfeil im Chart (siehe Bilder). – Inside Bar selbst hat ein hohes Risiko-Risiko-Verhältnis. – Mit Benachrichtigungen für PC, Mobilgeräte und E-Mail. – D

Hallo Trader! Ich bin QuEAn (Quantum Expert Advisor Network ), die endgültige automatisierte Handelslösung für Gold (XAUUSD). Entstanden aus der legendären "Quantum"-Volatilitätslogik, wurde ich speziell für MetaTrader 4 überarbeitet, um den modernen Goldmarkt zu dominieren. Während andere die Richtung erraten, berechnet QuEAn sie. Mit fortschrittlichen "Quantum Volatility"-Algorithmen erkenne ich genau den Moment, wenn der Markt aus dem Gleichgewicht gerät. Ich handele nicht einfach nur, ich fa
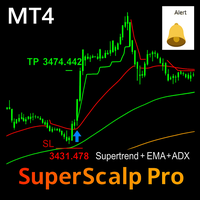
SuperScalp Pro - Supertrend-basierter Multi-Filter Scalping-Indikator (MT4)
SuperScalp Pro ist ein professioneller Scalping-Indikator für MetaTrader 4, der auf dem Supertrend basiert und mit einem mehrschichtigen technischen Filtersystem ausgestattet ist. Er wurde entwickelt, um Händlern dabei zu helfen, qualitativ hochwertige KAUF-/VERKAUFssignale mit klarer visueller Anleitung und reduzierten Fehleinstiegen zu identifizieren, insbesondere auf niedrigeren Zeitskalen.
MT5 Version verfügbar : E
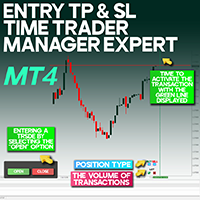
Entry TP und SL Time Trader Manager Experte für MetaTrader 4 Der Entry TP und SL Time Trader Manager ist ein leistungsstarkes, halbautomatisches Trading-Tool für MetaTrader 4, das die Einrichtung von Trades vereinfacht, Ausstiege verwaltet und Aufträge mit präzisem Timing ausführt. Mit diesem Expert Advisor können Händler ihre Handelsstrategie optimieren, indem sie Schlüsselparameter wie Einstiegsniveaus, Handelsvolumen und geplante Ausführungszeiten für maximale Effizienz definieren. Spezifikat

Automatisierter Confluence-Handel mit zweistufiger Verifizierung Hören Sie auf, auf Charts zu starren und auf den perfekten Moment zu warten. Der Bullet Proof Strategy EA nutzt die bewährte Logik des "Buy Sell"-Pfeilsystems und kombiniert sie mit einem robusten "Final Confirmation"-Filter, um eine disziplinierte, vollautomatische Handelsmaschine zu schaffen. Dieser EA rät nicht einfach nur; er wartet auf den Zusammenfluss . Er führt nur dann einen Handel aus, wenn die Preisaktionssignale (Pfeile

**Zonar** ist ein professioneller Handelsassistent, der entwickelt wurde, um die **Opening Range Breakout (ORB)** Strategie zu automatisieren. Im Gegensatz zu Standardindikatoren verwendet Zonar eine "Smart-Align"-Engine, die automatisch die wahre Markteröffnung für **jedes Instrument** (Gold, US30, NASDAQ, Forex oder Aktien) ohne manuelle Zeitzonenanpassung erkennt. Es kombiniert Volatilitätsanalyse (ATR), Smart Money Concepts (FVG/OB) und Daily Sentiment Levels, um ein komplettes, datengesteue

Sie können die tatsächliche Leistung Ihres Kontos auch hier verfolgen:
https://www.mql5.com/en/signals/2346679
Ich habe dieses Konto am 2. Dezember 2025 eröffnet.
Bitte verfolgen Sie, wie es sich von hier aus entwickelt -
Ich freue mich darauf, seine Fortschritte mit Ihnen zu teilen.
Produktbeschreibung Dieser EA ist nicht übermäßig auf Backtests ausgerichtet .
Es ist mit einem starken Fokus auf langfristige Stabilität und realistische, praktische Betrieb , anstatt jagen perfekte historisch

SUPER IA SNIPER - VOLUMEN PRO (MT4) Super IA Sniper - Volume PRO ist ein fortschrittlicher Indikator zur Analyse des Volumens und des Kursverhaltens , der entwickelt wurde, um kurzfristige Umkehrbedingungen mit hoher Wahrscheinlichkeit zu identifizieren, die auf qualifizierten Volumenereignissen basieren und nur geschlossene Kerzen verwenden (KEIN REPAINT) . Er wurde für Händler entwickelt, die Präzision, Transparenz und eine echte statistische Validierung verlangen, die zufällige Signale und re

Super IA Channel Creator PRO Intelligente adaptive Kanäle und intelligenter Handelskontext Super IA Channel Creator PRO ist ein fortschrittlicher Marktstruktur- und Entscheidungshilfe-Indikator für MetaTrader 4 , der Händlern dabei hilft, hochwahrscheinliche Handelszonen , Kontextstärke und Preisreaktionsverhalten in Echtzeit klar zu erkennen. Es handelt sich nicht um ein Repainting-Tool und nicht um einen einfachen Channel-Indikator.
Es handelt sich um einen kompletten Entscheidungsrahmen , der

Entdecken Sie den Goldmarkt mit Golden Dome, einem Expert Advisor für MT4! Sonderangebot für die ersten 10 Käufer! Nächster Preis: $1,495 Die vollständige Liste finden Sie unter https://www.mql5.com/ru/users/pants-dmi/seller
Wir stellen Ihnen Golden Dome vor - Ihren persönlichen automatisierten Trader, der speziell für die MetaTrader 4 Plattform entwickelt wurde. Golden Dome nutzt bewährte Standardindikatoren und klassische Preismuster, die eine solide Grundlage für den erfolgreichen Handel b

Indikator: Currency Strength Meter Pro Visualisierung der Marktbreite Vorteile: Zeigt Daten in einem sauberen "Dashboard"-Format anstatt unübersichtlicher Charts. Händler erkennen sofort die stärksten/schwächsten Paare. Nutzen: Spart Zeit und beschleunigt Handelsentscheidungen. Automatisches Ranking & Sortierung Vorteile: Sortiert Paare im "Horizontal Ranking"-Modus automatisch von "Stark" nach "Schwach". Nutzen: Identifiziert sofort die Gewinner und Verlierer (Daily/Weekly/Monthly). Intelligent

Automatisierte Leerverkaufsstrategie auf der Basis von gleitenden Durchschnitten und RSI mit mehreren Zeitfenstern. Beschreibung: Der H1Bert Forex EA ist ein regelbasierter Handelsalgorithmus, der für die MetaTrader 4 Plattform entwickelt wurde. Er wurde entwickelt, um Short-Positionen auszuführen, indem er die Marktbedingungen über zwei verschiedene Zeitrahmen (täglich und stündlich) in Kombination mit einem Momentum-Filter analysiert. Handelslogik & Strategie: Der EA arbeitet mit einer "Trend-

LAUNCH PROMO – LIMITED TIME OFFER% Preis: 99 $ WICHTIG! Schicken Sie mir nach dem Kauf eine private Nachricht, um das Installationshandbuch und eine ausführliche Installationsanleitung zu erhalten. SETFILES - HIER HERUNTERLADEN! HAPPY NATION EA ist ein automatisiertes System der nächsten Generation, das für alle AUD-Paare entwickelt wurde und eine intelligente, kontrollierte Gitterstruktur mit fortschrittlichen, marktadaptiven Filtern kombiniert.
Es bietet einen extrem niedrigen Drawdown (1-

Entfesseln Sie das volle Potenzial des Goldmarktes. Gold Rain EA ist ein professioneller, vollautomatischer Handelsroboter, der speziell für die hohe Volatilität des XAUUSD entwickelt wurde. Durch die Kombination von Multi-Timeframe-Trendanalysen mit dynamischen Volatilitätsanpassungen versucht dieser EA, profitable Bewegungen bei striktem Risikomanagement zu erfassen. Warum Goldregen? Um auf dem Goldmarkt zu überleben, müssen Sie mit dem Trend handeln, aber zum perfekten Zeitpunkt einsteigen. G

Gold Pattern Scanner Pro Gold Pattern Scanner Pro erkennt automatisch Trendkanäle und steigende/fallende Keile direkt auf Ihrem Chart und verwendet dabei einen Ansatz im Stil eines Autochartisten. Es zeichnet saubere obere/untere Trendlinien, berechnet die aktuelle Kursposition innerhalb des Musters und sendet intelligente Alarme (einschließlich Push-Benachrichtigungen), wenn der Kurs die Kanalgrenzen berührt. Speziell für GOLD (XAUUSD) entwickelt.
Es kann auch auf andere Symbole wie Forex-Paare
Hey, endlich ist es da: Der One-Way-Hedge-Objektkopierer! Kopiere problemlos deine Zeichenobjekte über mehrere Charts und Timeframes. Jetzt neu auf dem Markt!
Einfach in die Charts legen und die Objekte einzeichnen und zurecht bewegen, dann werden sie 1:1 in die anderen Charts hinein Kopiert und man kann sich auf das Wesentliche Konzentrieren. :)
Happy Trading Leute !

EA Waddah GOLD D1 ist ein leistungsstarker, vollautomatischer Expert Advisor für den Handel mit Gold (XAUUSD) im täglichen Zeitrahmen (D1). Er kombiniert vier unabhängige, erprobte Strategien, die ein stabiles Kapitalwachstum bei geringem Risiko ermöglichen. Wenn Sie diesen EA kaufen, erhalten Sie JEDEN unserer anderen EAs kostenlos! Ergebnisse und KPIs (Backtest 2006-2025)
Der Expert Advisor wurde auf historischen XAUUSD-Daten für 19 Jahre (von 2006 bis November 2025) mit echten Ticks backge

ZRP TFMS Gold - EMA200 RSI ATR Trend EA ZRP TFMS Gold ist ein vollautomatischer trendfolgender Expert Advisor, der hauptsächlich für XAUUSD (Gold) entwickelt wurde, aber auch für die wichtigsten Forex-Paare und BTC-Symbole verwendet werden kann.
Der EA kombiniert einen klassischen Moving-Average-Trendfilter mit schnellen RSI-Signalen, ATR-Volatilitätsfiltern, Multi-Timeframe-Bestätigung, Nachrichtenschutz und intelligentem Money-Management. Kern-Handelslogik Haupttrendfilter - EMA200
Der EA han

EA Beschreibung (Englisch) Candle XENV TPSL Marti ist ein automatisiertes Handelssystem, das auf der Grundlage von Ausbrüchen aus der Kerzenstruktur in Kombination mit einer Trendfilterlogik handelt.
Der EA verwaltet auf intelligente Weise die Positionsgröße mit Hilfe von dynamischer Losgröße, Martingale Recovery und adaptiver Risikokontrolle.
Er ist für den mittelfristigen Swing-Trading auf H1-Zeitfenstern für die wichtigsten Währungspaare optimiert. Der Algorithmus wurde entwickelt, um Over
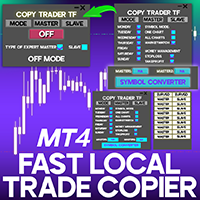
Fast Local Trade Copier Einzel-Multi TF-Experte MT4 Der Fast Local Trade Copier Expert ist ein robustes und effizientes Tool zur sofortigen Replikation von Trades über mehrere MetaTrader 4-Konten. Ausgestattet mit einem umfassenden Floating-Control-Panel, rationalisiert es die Synchronisation und ermöglicht die Ausführung von Trades in Echtzeit zwischen verbundenen Terminals. Mit diesem Dienstprogramm können Benutzer Handelseinträge, Stop-Loss- und Take-Profit-Niveaus sowie allgemeine Handelspar

Meistern Sie die Herausforderungen der Prop-Firmen, bevor Sie echtes Geld riskieren ! Unser fortschrittlicher Simulator stellt authentische Handelsumgebungen der Prop-Firmen nach und hilft Ihnen dabei, zu üben, Strategien zu entwickeln und die Herausforderungen mit Zuversicht zu bestehen. Mit unserem Simulator können Sie jede Herausforderung der Prop-Firmen simulieren, indem Sie Demo- oder Live-Konten verwenden, sowohl manuelle Handelsstrategien als auch den automatisierten Handel über EAs unter
ADX-Skalierer XAU/USD Überblick ADX Scalper XAU/USD ist ein professioneller Expert Advisor, der speziell für den Handel mit dem Goldpaar (XAU/USD) entwickelt wurde und den ADX-Indikator als primären Trendfilter verwendet. Dieser EA kombiniert Scalping-Strategien mit fortschrittlichem Risikomanagement und ist damit ideal für persönliche und eigene Handelskonten.
Hauptmerkmale Handelsstrategie Hauptindikator: ADX (Durchschnittlicher direktionaler Index) Trend-Filter: Verwendet +DI und -D
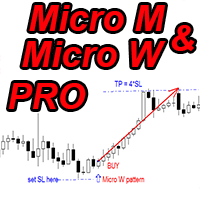
Crypto_Forex Indikator „Micro M und Micro W Muster Pro“ für MT4, kein Nachzeichnen, keine Verzögerung.
- Der Indikator „Micro M und Micro W Muster Pro“ ist ein sehr leistungsstarker Indikator für Price-Action-Trading. - Der Indikator erkennt Micro-M- und Micro-W-Muster im Chart: - Bullisches Micro-W-Muster: Blauer Pfeil im Chart (siehe Abbildungen). - Bärisches Micro-M-Muster: Roter Pfeil im Chart (siehe Abbildungen). - Mit integrierten PC- und Mobilbenachrichtigungen. - Der Indikator „Micro M

MasterUS30 - Automatisiertes Handelssystem für US30 MasterUS30 ist ein professioneller Trading Advisor, der speziell für den Handel mit dem US30 Index (Dow Jones Industrial Average) entwickelt wurde. Das System verwendet einen umfassenden technischen Analysealgorithmus, um Handelsmöglichkeiten zu identifizieren und Positionen zu verwalten. Niedriger Preis, hohe Qualität! Schneller Code! Keine Chart-Dekorationen, da sie die Leistung verlangsamen! Check the advisor's performance on real ticks in M
Commodity Channel Index. Nicht-zeichnender Indikator für die Anzeige des älteren Zeitrahmens (im Folgenden TF) auf dem aktuellen Chart. Er kann auf dem aktuellen TF verwendet werden. Mehrere Berechnungsoptionen für verschiedene Preise und verwendete Muwings. Parameter: TimeFrame - muss größer als der aktuelle sein. Periode - muss größer als 1 sein. Preistyp - Optionen: Close, High, Low, Median, Typical, Weighted, Average, Body, Median, Trend Biased. MA Metod - Berechnungsmethode basierend auf MA

Evoque Global - Zuverlässiges automatisiertes Hedging Der Preis steigt mit jedem einzelnen Kauf um $100, also kommen Sie nicht zu spät. Evoque Global bietet eine freihändige, adaptive Handelslösung, die darauf ausgelegt ist, konstante Gewinne bei kontrolliertem Risiko zu erzielen. Mithilfe eines intelligenten Hedging-Ansatzes werden Trades ausgeglichen, um Drawdowns zu reduzieren und ein gleichmäßiges Aktienwachstum zu maximieren. Dieser fachkundige Berater arbeitet nahtlos unter allen Marktbed

Order Blocks SMT ist nicht "nur ein weiterer Indikator".
Es ist das Tool, mit dem Sie den institutionellen Orderflow lesen und Entscheidungen mit der gleichen Logik treffen können, die von Banken und Fonds verwendet wird - direkt im MetaTrader 5 (MT5 ). Was dieser MT5 Order Blocks-Indikator für Sie tut Mit Order Blocks SMT ( ein fortschrittlicher Smart Money / ICT Order Blocks Indikator für MT5) können Sie: Hören Sie auf, Angebot und Nachfrage zu erraten und beginnen Sie mit dem Handel auf klare

Gonzonator Pro - Smart Fibonacci Trend EA - Es ist nicht nur ein EA - es ist ein komplettes Handelssystem Gonzonator Pro ist ein vollautomatisches Handelssystem, das auf der Grundlage von Fibonacci-Level-Reaktionen , Trendfiltern und Volatilitätsfiltern entwickelt wurde. Es wurde für eine stabile Ausführung, ATR-Volatilitätsanalyse und Multi-MA-Filterung entwickelt. Gonzonator Pro enthält einen leistungsstarken integrierten Dashboard-Scanner, der Trend- und Volatilitätsbedingungen über MarketWat

Leistungsstarker MACD-Indikator für MT4 mit den Funktionen: 1. MACD-Berechnung: Fast EMA (Voreinstellung: 12) Slow EMA (Voreinstellung: 26) Signallinie SMA (Voreinstellung: 9) Histogramm mit farbcodierten Balken (grün aufwärts, rot abwärts) 2. Mehrere Signaltypen (können aktiviert/deaktiviert werden): Nulllinienkreuzung : Signalisiert, wenn der MACD über/unter der Nulllinie kreuzt MACD/Signal-Kreuzung : Signalisiert, wenn der MACD die Signallinie kreuzt Histogramm-Änderung : Signale, wenn das Hi
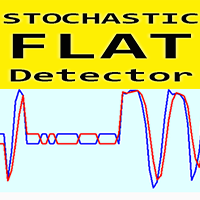
Crypto_Forex Indikator STOCHASTIC FLAT Detector – ein effizientes Hilfsmittel für den Handel! Kein Repainting. Ich biete Ihnen die Möglichkeit, Ihre Handelsmethoden mit diesem großartigen Indikator für MT4 zu verbessern.
– Der Indikator zeigt flache Bereiche im Chart an. Er verfügt über den Parameter „Flat Sensitivity“, der für die Erkennung von Flats zuständig ist. – Der STOCHASTIC FLAT Detector kann zur Bestätigung von Price Action-Einträgen, Divergenz- oder Überverkauft/Überkauft-Signalen v
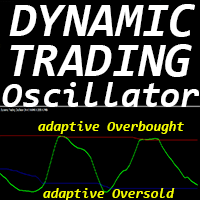
„Dynamischer Handelsoszillator“ – ein fortschrittlicher, benutzerdefinierter Krypto-Forex-Indikator – ein effizientes Handelstool für MT4!
– Neue Oszillatorengeneration – siehe Bilder zur Anwendung. – Der dynamische Handelsoszillator verfügt über adaptive Überverkauft-/Überkauft-Zonen. – Der Oszillator ist ein Hilfsmittel, um genaue Einstiegspunkte in dynamischen Überverkauft-/Überkauft-Bereichen zu finden. – Überverkauft: unterhalb der blauen Linie, Überkauft: oberhalb der roten Linie. – Dies

Der für den XAUUSD entwickelte Voyageur EA ist die Quintessenz der Innovation in der Welt des automatisierten Handels. Dieser Expert Advisor ist mehr als nur ein Werkzeug, sondern ein sorgfältig kalibrierter Mechanismus, der darauf ausgelegt ist, von jeder Mikro-Welle des dynamischen Goldmarktes zu profitieren.
Die vollständige Liste finden Sie unter https://www.mql5.com/ru/users/pants-dmi/seller .
Diese Scalping-Strategie kann mit einem Mindestguthaben von 300 $ operieren und gleichzeitig extr

Der Genesis VIP Expert Advisor wurde für den automatisierten Goldhandel (XAU/USD) auf der MetaTrader 4 (MT4) Plattform entwickelt. Ziel ist es, Gewinne zu maximieren und gleichzeitig Risiken zu minimieren. Hierfür kombiniert er technische Indikatoren mit Strategien für das Risikomanagement. Der Expert Advisor ist flexibel, individuell anpassbar und eignet sich für unterschiedliche Marktbedingungen. Die vollständige Liste finden Sie unter https://www.mql5.com/ru/users/pants-dmi/seller
Genesis V

Quantum Empire GRID PRO - Handelssystem der nächsten Generation Revolutionäre Handelstechnologie Quantum Empire GRID PRO stellt einen Durchbruch im automatisierten Handel dar und kombiniert eine intelligente Grid-Strategie mit einem Mittelwertbildungssystem und Signalfilterung. Nach über 2 Jahren realer Markttests hat dieser EA seine Stabilität und Rentabilität in verschiedenen Anlageklassen bewiesen. Hauptmerkmale: Smart Averaging System : Beim Schließen einer Reihe von Trades werden
Killer Scalper XAUUSD MT4 Professioneller Scalping Expert Advisor für den Goldhandel Überblick Killer Scalper XAUUSD ist ein hochpräzises automatisches Handelssystem, das speziell für das Scalping von Gold (XAU/USD) entwickelt wurde. Mit fortschrittlichen RSI- und Stochastik-Filtern identifiziert dieser EA optimale Einstiegspunkte bei hoher Volatilität und maximiert das Gewinnpotenzial bei gleichzeitiger Einhaltung strenger Risikomanagement-Protokolle.
️ Technische Spezifikationen Spezi

Hallo Trader! Gehören Sie zu den Tradern, die zwar von ihrem Einstieg überzeugt sind, aber ständig Stop-Loss-Aufträge auslösen? Ihre Analysen sind zu über 70 % korrekt, aber Ihre Trades treffen aufgrund von Stop-Loss-Jagden oder Marktmanipulationen immer wieder den Stop-Loss? Dann ist es Zeit, die Kontrolle zu übernehmen! Mit diesem Tool können Sie all Ihre korrekten Trades sorgenfrei gewinnen. Es hilft Ihnen außerdem, Ihre Positionen nachzuziehen und Ihre Gewinne zu sichern, bis der Markt dreh
Sniper Scalper XAUUSD Professioneller Expert Advisor für MetaTrader 4 ÜBERBLICK Sniper Scalper XAUUSD ist ein automatisierter Expert Advisor, der speziell für den Handel des Paares XAU/USD (Gold vs. Dollar) auf dem M5-Zeitrahmen entwickelt wurde. Dieser EA verwendet eine hochpräzise Scalping-Strategie, die auf der Analyse von Candlestick-Mustern, der Körpergröße und der Erkennung von Signalen in aufeinanderfolgenden Reihen basiert, um Einstiegsmöglichkeiten mit einem hervorragenden Risiko-Er

Ultimate Daily Zone Arrow — Indikatorbeschreibung (Deutsch) Ultimate Daily Zone Arrow ist ein intelligenter Handelsindikator, der automatisch die obere tägliche Zone (Upper Daily Zone) und die untere tägliche Zone (Lower Daily Zone) erkennt und an diesen wichtigen Bereichen präzise Kauf- und Verkaufssignale mittels Pfeilen ausgibt.
Der Indikator eignet sich für alle Märkte, einschließlich Forex, Gold, Indizes und Kryptowährungen. Hauptfunktionen des Indikators Automatische Erkennung der tägli

Breakout Expert Advisor für XAUUSD (Gold) - platziert ATR-gefilterte schwebende Kauf-/Verkaufsaufträge auf der Grundlage der jüngsten Hoch-/Tiefstände (empfohlen H1). Kurzübersicht:
Gold Highest BreakOut ist ein automatisierter Expert Advisor für den Handel mit XAUUSD . Er platziert schwebende Kauf-/Verkaufs-Stopp-Aufträge auf Ausbruchsniveaus, die von den jüngsten Hoch-/Tiefspannen abgeleitet sind, und verwendet ATR- und Bereichsfilter, um Fehleinstiege zu reduzieren. Wichtige Punkte: Strateg
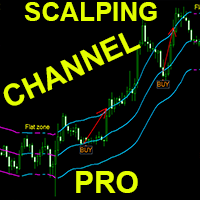
Crypto_Forex Indikator „Scalping Channel Pro“ für MT4.
- Scalping Channel Pro verwendet ATR-basierte Volatilitätsgrenzen. - Ideal für Scalping-Trading: - Positionieren Sie über eine Pending-Limit-Order auf der Mittellinie. - Kaufen Sie bullische Positionen, wenn ein stetiger blauer Aufwärtskanal sichtbar ist und mindestens eine Kerze über der oberen Grenze geschlossen hat (siehe Abbildungen). - Kaufen Sie bärische Positionen, wenn ein stetiger roter Abwärtskanal sichtbar ist und mindestens ein

BVG Algo Trader BVG Algo Trader ist ein vollautomatisches Handelssystem, das für einen stabilen Langzeitbetrieb unter verschiedenen Marktbedingungen konzipiert wurde.
Der EA verwendet einen dynamischen Mittelwertbildungsalgorithmus mit intelligentem Positionsmanagement, Volatilitätsfiltern, Trenderkennung und integrierten Schutzschichten.
Es werden keine riskanten Strategien wie Tick-Scalping, Arbitrage oder Hochfrequenzhandel eingesetzt. Hauptmerkmale Intelligentes Positionsmanagement Der EA

DAX Highest BreakOut MT4 - Flexibler EA für DAX mit optionalem Risikomanagement Dieser Expert Advisor für MetaTrader 5 wurde für den Handel mit dem DAX-Index (DE40) auf dem H1-Chart entwickelt und bietet die Wahl zwischen dynamischem und festem Money Management, um das Risiko nach den Präferenzen des Nutzers anzupassen. Der EA kombiniert drei Strategien, die auf den Indikatoren SRPercentRank, SuperTrend und DeMarker basieren und sich auf Ausbrüche und Umkehrsignale konzentrieren, um die Abhängig
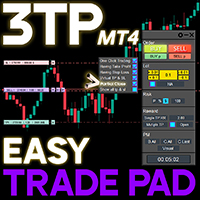
Drei 3TP Easy Trade Pad Expert für MT4 - Herunterladen Der 3TP Easy Trade Pad Expert ist ein fortschrittliches Tool, das für das Kapitalmanagement, die Risikokontrolle und den rationalisierten Handel innerhalb der MetaTrader 4 (MT4) Plattform entwickelt wurde. Mit seiner funktionalen und spezialisierten Schnittstelle ermöglicht dieser Expert Advisor Händlern, mühelos Stop Loss (SL) und Take Profit (TP) Levels zu setzen und zu verwalten. Zusätzlich zur Vereinfachung der Handelsausführung bietet d
Performance Analytics 1.4 ist ein fortschrittlicher Echtzeit-Performance-Tracking- und Risikomanagement-Indikator, der für Trader entwickelt wurde, die mit mehreren EAs oder gleichzeitigen Setups arbeiten und genaue, dauerhafte, instanzgetrennte Metriken benötigen.
Er zeigt auf dem Bildschirm die wichtigsten Statistiken für das gesamte Konto und den aktuellen EA an, einschließlich Gewinne, maximale Verluste, professionelle Leistungskennzahlen und intelligente Warnmeldungen. Der Indikator unterte

Eine legendäre Strategie für GOLD, CRYPTO, INDEXES von renommierten FX-Marketmakern jetzt auch für Retail-Trader verfügbar. Einer der effektivsten "Set and Forget" EAs mit langfristig positiven Ergebnissen. PROMO! Die ersten Käufer erhalten kostenlos 'Quantum Incinerator ' und ' Reverence EA '. Occult-black Gold Strategy EA für diejenigen, die Gewinne aus langfristigen Märkten wie Metalle, Krypto, Indizes maximieren wollen. Der EA arbeitet mit den fortschrittlichen mathematischen Algorithmen der

Torso EA ist ein vollautomatisches Trendfolgesystem, das entwickelt wurde, um mit Hilfe der Heiken Ashi-Struktur, der MA-Richtung und der Slope-Bestätigung saubere Marktimpulse zu handeln.
Es passt sich dynamisch an die Volatilität an, indem es ATR-basierte Stop-Loss-, Trailing-Stop- und Risiko-Skalierung verwendet, wodurch es für Scalping, Intraday- und Swing-Trading auf Forex, Metalle, Indizes und Krypto-Paare geeignet ist. Torso konzentriert sich auf hochwertige Einstiege, wenn der Preis von
Dieser Indikator ist eine Art Strategie, die mit Hilfe von Linien diese oder andere Indikationen von Kerzen aufbaut, die dem Händler bei seinen Berechnungen und dem Handel helfen werden.
Der Indikator selbst ist ein normaler Moving Average, der in zwei Farben gefärbt ist: hell und dunkel, und damit dem Händler das Verhalten des Marktes in der aktuellen Situation zu einem bestimmten Zeitpunkt anzeigt und je nach Farbwert anzeigt, welche Trades zu diesem Zeitpunkt am besten geöffnet werden: entw
MetaTrader Market - der einzige Shop, in dem man Handelsroboter als Demoversion herunterladen und testen sowie anhand historischer Daten optimieren kann.
Lesen Sie die Beschreibung und Bewertungen anderer Kunden über das gewünschte Produkt, laden Sie es direkt ins Terminal herunter und erfahren Sie, wie man einen Handelsroboter vor dem Kauf testet. Nur bei uns können Sie ein Programm testen, ohne dafür zu bezahlen.
Sie verpassen Handelsmöglichkeiten:
- Freie Handelsapplikationen
- Über 8.000 Signale zum Kopieren
- Wirtschaftsnachrichten für die Lage an den Finanzmärkte
Registrierung
Einloggen
Wenn Sie kein Benutzerkonto haben, registrieren Sie sich
Erlauben Sie die Verwendung von Cookies, um sich auf der Website MQL5.com anzumelden.
Bitte aktivieren Sie die notwendige Einstellung in Ihrem Browser, da Sie sich sonst nicht einloggen können.