在Facebook查找我们! 加入我们的粉丝群
使用MetaTrader 5新的可能性
最受欢迎的EA交易和技术指标、新闻信号、代码库中常规传入的现有的MQL5程序和热门讨论的论坛主题。
该 瞬时捕手 EA 可与众多货币对工作,并产生大量盈利。 特价促销!限时销售 EA 的价格低至 1000 信用点。限期终止后, 价格将会回到 3000 信用点。 它有不同参数 (手数大小 - 固定或相对净值, 止损和止盈位, 移动止损, 反向下单和阀值,如最小余额和净值变量), 并且它没有绑定到特殊时间帧。 它使用独特技术来识别小趋势,并从趋势和非趋势行情中盈利。 您可以降低手数大小 (即 FixedLot = 0.01 对于实盘账户) 直到您从测试参数的结果中得到更多信心。 在版本 4.0 里, "Signal Filter" 和 "Signal Strength" 已被加入,过滤造成账户极高波动的随机价格行为 - 非趋势周期。 我将发布各种不同参数的信号,以便您能够看到每种设置达到的最好结果。 我可以应要求提供一个完整的工作演示(只在模拟账户工作)。 任何我的客户,可以用 EA 创建实盘信号 (即使是收费的),但要首先与我联系,并征得我的同意之后。 请随时向我提问。 不多说了,看看截图吧。
Trajecta Labs - Fast Robot Strategy What about a fast detection of market changes? As the name indicates, the main idea of this strategy is to quickly seek the market changes. The Fast Robot Strategy was created using Parabolic SAR Indicator for fast market movement and changes detection. This Expert Advisor was build using Trajecta Labs Strategy Builder technology, developed to facilitate the rapid construction of new strategies by any investor. The main idea of this Expert Advisor is demonstra
ROMAN5 Bollinger Bands TrailingStop includes BreakEven facility. TrailingStop automatically moves the Stop Loss with the Bollinger Bands level. You can place ROMAN5 Bollinger Bands TrailingStop in any chart. It comes with an alert that will sound whenever a new signal appears. It also features an email facility. Your email address and SMTP Server settings should be specified in the settings window of the "Mailbox" tab in your MetaTrader 5. Bollinger Bands Parameters: BB Period - The averaging pe
这是一款基于市场深度的可视化指标,它可工作于所有提供市场深度的品种。它显示每笔卖价/出价的交易量与总卖价/出价的交易量的比值,这样用户可以直观地判断买卖方向的瞬时强度。你可以同时在几个图表上应用这个指标,观察不同品种的买卖队列。 购买前请确认你的交易商有提供市场深度这个功能。 。。。。。。。。。。。。。。。。。。。。。。。。。。。。。。。。。。。。。。。。。。。。。。。。。。。。。。。。。。。。。。。。。。。。。。。。 。。。。。。。。。。。。。。。。。。。。。。。。。。。。。。。。。。。。。。。。。。。。。。。。。。。。。。。。。。。。。。。。。。。。。。。。。 。。。。。。。。。。。。。。。。。。。。。。。。。。。。。。。。。。。。。。。。。。。。。。。。。。。
通用多货币交易系统 多货币交易系统,基于标准指标。在此 EA 中应用了 12 个标准指标,可达 3 个信号。所有指标有可定制外部参数。 亲爱的用户, 您可以通过给作者写 私信 订购此 EA 的源代码。 主要优势 自动手数 (根据当前余额计算交易量), 资金管理; 依时间工作 (限制 EA 的交易时间); 尾随止损 (标准 "仅当盈利" 算法); 市场观察 ECN (与 ECN, NDD 账户工作); 实盘出错处理功能; 根据总盈亏整体平仓,并禁用账户内所有EA。 盈亏平衡 (移动止损到开仓位); 马丁格尔 (若有亏损,则开仓手数递增); 只配合指标信号工作 (开仓信号, 反向平仓并开新仓信号); 当信号改变,平反向持仓; 该 "反转" 功能能够将您的策略信号反转。 指标和信号 移动均线 (MA) (信号 1) 信号的计算使用两条均线的相对位置,一条周期较小 (快速 MA) ,另一条周期较大 (慢速 MA)。它们的参数可在以下变量中指定: 当快速 MA 位于慢速 MA之上,买信号出现,当慢速 MA 位于快速 MA之上,卖信号出现。"无信号" 状态未使用。 移动均线收敛发散 (MACD)
The price channel is a main tool used by traders for analyzing the current situation on the market. Using it you are able to successfully predict the future price behavior. However a major factor that effects the profit you earn is a decision made on time. Often it appears to be a problem, because it is impossible to look at monitor all the time. This indicator will allow you to always be aware of the current situation, during a lunch time and at night time. Based on trend lines that you can adj
This indicator shows Pin Bar candlestick pattern on the chart. The bearish pin bars have red color, the bullish pin bars have blue color. The indicator shows alert when Pin Bar candlestick pattern is formed. It's recommended to use it at timeframes H1 and higher. The best moment (strong signal) is when Pin Bar is formed close to the support/resistance level.
用于 MetaTrader 5 的 Ilan 由于使用虚拟交易,同时并发双向交易 (买与卖) 成为可能。 这样,允许用户在 MetaTrader 5 的单向持仓规则下,采用流行策略。 EA 设置 该 EA 的设置很简单。不过,策略的所有重要设置均可调整。可用工具: 单一 MagicNumber 用于识别交易; 交易方向选项 ( Trade direction ): 仅买入, 仅卖出或者并发双向; 开仓步长 ( Step ) 和盈利距离 ( TakeProfit ) 可自动适应 4 或 5-位的报价; 起始手数 ( Start lot ) 和增量系数 ( Lot coefficient ) 用来指定本金使用大小; 最后, 交易数量限制 ( Max trades in one direction ) 和最终一系列交易的止损 ( Max loss of last trade ) 用于风险管理。 您可以根据需要在单一账户里使用多个 Ilan EA (即便是单一金融品种)。它们之中的每一个都仅处理自己的虚拟交易,不会与其它实例交互。手工交易加上 EA - 这不会影响交易策略。即使有
本指标的目的是判断点差和利率大小,以及按照存款货币每一个点的风险,设置从当前价位计算的止损距离。 本指标告知交易者有关金融工具在每个时段之间转换时可能的额外费用和利润。它还告知有关的点差和挂单的距离,从当前价位的尾随止损位。此外,指标告知交易者有关存款货币每一个点的风险。 信息被显示在图表下方的单独子窗口里。它可以避免图表被不同的信息塞满。点差和利率监控指标适合任何自定义模板。
This indicator is based on a classic Moving Average indicator. Moving averages help us to first define the trend and second, to recognize changes in the trend. Multi TimeFrame indicator MTF-MA shows MA data from the 4 timeframes by your choice. By default this indicator has external parameters: TF1 = 1; TimeFrame2b = true; TF2 = 5; TimeFrame3b = true; TF3 = 15; TimeFrame4b = true; TF4 = 60; InpPSARStep = 0.02; InpPSARMaximum = 0.2; You can change TF1-TF4 in the next limits: TF1 from M1 (1) to H4
This is an easy-to-use tool for implementing Support Vector Machine Learning in your Expert Advisors, Indicators and other MetaTrader 5 projects. Until now, the use of support vector machine classification has been limited only by advanced coders via external java and c++ dll libraries. This tool has been developed using only the standard MetaTrader 5 tools and provides advanced support vector machine functionality using a very simple interface. Please note: this product is not an Expert Advisor
Introduction The EASuperSTAR Expert Advisor is developed on the conception that market always changes its behavior. There is no specific kind of the Expert Advisor settings that will be profitable for a long period of time because trade type profitable in the trend market can be dangerous in the range-bound market, so the EASuperSTAR Expert Advisor is designed to easily change the way of trading, i.e. using the signal, the volume, the trailing stop. The EASuperSTAR Expert Advisor is unique as ea
AABB - Active Analyzer Bulls and Bears is created to indicate the state to what extent a candlestick is bullish or bearish. The indicator shows good results on EURUSD H4 chart with default settings. The Strategy of the Indicator When the indicator line crosses 80% level upwards, we buy. When the indicator line crosses 20% level downwards, we sell. It is important to buy or sell when a signal candlestick is formed. You should buy or sell on the first signal. It is not recommended to buy more as w
ZoneSession allows you to visually show various trading zones on your chart. Excellent for live trading, but also at a glance you can review history for optimum trading sessions to analyse your trade setups. Zone Session shades the chart into sessions of your choice in any combination of colors.
Whatever you are expert class Forex trader or not, you must know how to make correlation analysis between different timeframes of the same symbol, and furthermore between different symbol. Now, open one or several symbols with different timeframes, apply this smart multi-timeframe mapping tool, drag and move the vertical anchor line to the destination bar position. Then you will see the correlation of Forex market clearly. Supports multiple timeframes synchronization and multiple symbols synchro
This indicator is based on the trend line and breakthrough. Pair: EURUSD, GBPUSD. Timeframe: M15 Or H1. Input Parameters AlertsOn - alert on or off. TrendLine - show trend line. TrendLineStyle - style of trend line. UpTrendColor - color of up trend. DownTrendColor - color of down trend. ShowTakeprofit - show take profits. ShowTakeprofitStyle - style of take profit. UpperTakeprofitColor - color of up take profit. LowerTakeprofitColor - color of down take profit.
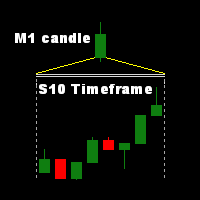
Indicator with second-timeframe in a separate window with separator line. Very useful for day traders to analyze the quick motion. Input parameters: TimeFrame - used time frame: S1 - one candle contains 1 second (max. 60 candle/sec); S2 - one candle contains 2 second (max. 30 candle/sec); S3 - one candle contains 3 second (max. 20 candle/sec); S4 - one candle contains 4 second (max. 15 candle/sec); S5 - one candle contains 5 second (max. 12 candle/sec); S6 - one candle contains
FXG_Info – the most important data in one place. MetaTrader 5 Indicator FXG_Info provides basic statistical information about a particular currency pair. So that in combination with a chart representing currency price it is easy to determine whether the current situation is good for trading. And when you open a position it will clearly show you the current data such as SL, TP, RR. You are not limited to currency. You can use any market which is provided by you broker. The following information i
TTMM – "Time To Make Money" – Time When Traders Makes Money on the Stock Exchanges The ТТММ trade sessions indicator displays the following information: Trade sessions: American, European, Asian and Pacific. (Note: Sessions are displayed on the previous five days and the current day only. The number of days may change depending on the holidays - they are not displayed in the terminals. The sessions are also not displayed on Saturday and Sunday). The main trading hours of the stock exchanges (tim
Features The Expert Advisor's conditions for entering and exiting the market are based on the MultiSignals_PCH indicator, which can be downloaded for free from Code Base . The Expert Advisor can be used for trading in the manual, semi-automatic or automatic mode. Multi-currency trading. This version supports 3 symbols. Multi-system trading. In this version, you can set up 4 strategies for each symbol. The Expert Advisor sets a unique magic number for each strategy. Multi-timeframe trading. You
脉冲系统在“进入我的交易室”一书中首次描述。 它使用 MACD 直方图和价格指数移动平均线 (EMA) 的方向来定义冲量。 规则是永远不要与冲动交易。 它的颜色代码为您提供了几个信号: 当 EMA 和 MACD 直方图都在上升时,脉冲系统将条形颜色标记为绿色(不允许做空)。 当 EMA 和 MACD 直方图都在下降时,Impulse 系统会将条形颜色标记为红色(不允许购买)。 当 EMA 和 MACD 直方图指向不同的方向时,Impulse 系统会将条形颜色标记为青色(您可以做多或做空)。 参数: MACD_Short_Length (12) – MACD 计算的空头 EMA; MACD_Long_Length (26) – 用于 MACD 计算的多头 EMA; MACD_Smoothing_Length (9) – 信号线的平滑值; Short_EMA_Length (13) – 短期价格 EMA。
本 EA 是 MetaQuant-ATC10 的版本, 修改为用于一个货币对, 所有参数可调以及优化。 当然, 可以加挂到更多/若干货币对上,得到的结果就像 自动交易大赛 2010 。 此 EA 基于 "均匀网格"。如果持仓亏损, 按照不同步长加仓。这样做的目的是将持仓成本摊薄到市价附近,当调整时会转为利润并平仓。 输入参数的含义和操作方法: StartType - 在开始时识别首单的类型 (买或卖)。 Lot - 初始和后继交易量。 MaxLot - 最大可达的交易量 (所有订单总合)。 Trailing - 盈利尾随终止百分比 (0.7=70%)。 最小盈利等于所赢仓位交易量 = Lot 和价差 = Step 。 Step - 此参数有两个含义: 作为止盈 - 尾随终止的初始位; 作为开第二单的举例, 如果价格走向亏损方向 第二单之后的后续订单将使用变化的步长。如何根据 " Agres " 比例修改这个步长。 对于次要货币 JPY (USDJPY, EURJPY, ...) Step 参数值必须乘以 100。 Agres - 主动因子判断算法计算下一笔订单的步长。 合理的数值是从
Ilan trailing for MetaTrader 5 Determines the direction of trading according to candlestick patterns. Settings: Initial volume. Lot increasing exponent. Density of averaging (step of bends opening). Maximum amount of averaging (the maximum number of bends). Take Profit in points. Selecting the volume accuracy (number of digits after a decimal point in the volume). Magic number of the Expert Advisor. Slippage. Trailing Stop. Maximum possible loss as a percentage of the deposit.
This is an interpretation of classic MACD, but without lags. The indicator allows entering a trend on an early stage. The indicator histogram allows understanding the balance between the bulls and bears clearer than using classic MACD. Using this indicator you can find out who is stronger - buyers or sellers, the strength tendency, the speed and pattern of changing of the overbalance. The histogram slope tells about the strength balance changes, but not about the overbalance of buyers or sellers
EasyPen is designed as beautiful and innovative way to create and manage all your chart analysis, scribbles, notes and more. The app takes advantage of new MQL5 technology to offer an experience unseen in the other apps or in older MQL versions. An App That Changes Everything There is no existing drawing app that allows the level of customization that EasyPen offers. Change color of your pen, choose brush size, save drawings, keep drawings attached to specific position in chart, and more. With o
MARVI Power Multi is a multi-currency EA developed on the basis of MARVI Power . Trading Strategy: MARVI Power Multi Expert Advisor trades on 12 currency pairs (EURUSD, GBPUSD, USDCHF, USDJPY, USDCAD, AUDUSD, EURGBP, EURAUD, EURCHF, EURJPY, GBPCHF and GBPJPY) that can be selected in the parameters with time frame M15. The Strategy is almost the same as the one used in MARVI Power . During this back test, the maximum drawdown reached about 3.3%, while the absolute drawdown equal to zero. Input pa
A Gold Trend Story is a multi-currency Expert Advisor developed on the basis of two Moving Average indicators: LWMA and SMA. Trading Strategy: A Gold Trend Story Expert Advisor trades on 8 currency pairs (EURUSD, GBPUSD, USDCHF, USDJPY, AUDUSD, EURJPY, AUDJPY and GBPJPY) that can be selected in the parameters and timeframe H1. When a signal generated by LWMA and SMA appears, it places a position with Take Profit and Stop Loss. Position are closed by Take Profit, Stop Loss or according to opposit
MetaTrader 5 专业交易面板 —— 图表与键盘一键交易的高效控制中心 一款面向主动交易者的专业 Trading Panel,可让您比标准 MetaTrader 操作方式更快、更直观地完成开仓、平仓、修改、管理与控制。 这不是一个普通的小工具,而是一个为高频手动操作、仓位管理、挂单控制与利润管理而设计的完整交易工作台。 通过这套面板,您可以直接在图表上一键执行交易,通过键盘快速触发核心操作,并借助自动参数计算、图形提示、信息标签以及可视化管理功能,大幅减少重复性操作,让整个交易流程更加流畅、高效且专业。 使用我们的交易面板,您可以直接从图表上一键下单,执行交易操作的速度可比标准 MetaTrader 控件快约 30 倍。 全新高级版本现已推出: 使用 VirtualTradePad PRO SE 升级您的交易流程 — 适用于 MetaTrader 5 和 MetaTrader 4 的新一代专业交易面板。 MT4 版本 | 完整说明 + DEMO + PDF | 如何购买 | 如何安装 | 如何获取日志文件 | 如何测试与优化 | Expforex 的所有产品 为什么交易者会
Our strategy relies on a choppy movement on most Forex pairs during the Asian session. Most traders in London sleep when the Sun shines over the Pacific and this results to a very slow movement of GBPUSD pair between 9:00 PM GMT and 7:00 AM GMT. Buy order: Place a buy-stop order just five pip above the upper band. Place a stop loss just one pip below the lower band. Place a profit target at the upper LawnGreen Arrow. Sell order: Place a sell-stop order just five pip below the lower band. Place
Help scalper placing his manual orders faster so he can repeat his orders without worrying make a mistake when calculate their Stop Loss/Take Profit. Example: The price has a strong movement and breaks the upper Fractals at M5 chart. You want to open a long position to get small pips profits (scalping). On this stage you will you will feel confused to put your SL/TP while prices continue to soar up and you do not want to lose this opportunity but you need to prepare your values of SL/TP. In this
iRangeBarsChart indicator allows you to create custom Range Bars charts. Open history file format and history quality control are used. This indicator is based on iCustomChart and represents its particular implementation. The demo version of iCustomChart can be downloaded for free . Contents: Advantages and Features Input Parameters Indicator Buffer Data Window History Files History Quality Control Time Scale Graphical Objects for Technical Analysis Indicators and Expert Advisors 1. Advanta
How important is the trend discovery in stock and Forex market! Are you still confusing how to find the inflection point of trend? Are you still worrying about how to draw long-term and short-term trend lines? Fortunately, since now, you don't need to sit in front of your computer and wait next inflection point to appear whole day and whole night. Relax yourself, open your interested symbol, apply this smart tool, then you can see inflection point in different strength, as well as long-term and
这款剥头皮指标为您显示可以安全赚取 10 个点,且风险仅有 2 个点的那一刻。如果使用正确的资金管理,它可以极大地增加您的资产。 此指标只有一个输入参数 - 柱线数量, 用于趋势计算。 当信号出现, 在高于当前价位 2 点的上方放置挂单 (买单) 或低当前价位 2 点的下方放置卖单。 止损 - 2-3 点; 止盈 - 从 10 点起; 建议时间帧 - M1。 品种高波动且低点差 - EURUSD, AUDUSD, GBPUSD, EURJPY 等等。 如果仓位已开, 但价格未到达止盈价, 修改止损到盈亏平衡点, 并依据前一根柱线的最低价设置多单尾随停止, 或前一根柱线的最高位设置空单尾随停止。 FYI :如果您購買此指示器而不是租用它,您可以通過向我們發送您的付款證明來免費索取其源代碼。
The Red Green Trade Signals indicator just gives you the direct signal to open and close your positions, just like traffic signals. When the signal turns to red, the market goes to short position, while the signal turns to green, the market goes to long position. This indicator also provides the precise time and price to open/close your positions with the 'buy' (green) and 'sell' (red) arrows. It's easy to use, and it's ready to go without any parameter to set. This indicator is implemented by c
Multi-currency virtual Take Profit and Stop Loss. Virtual stops work as usual SL/TP on a server/broker side, but are not visible to your broker and are kept only within EA "memory". Allows flexible positions filtering and processing by: Pair Magic Position ID Position Type The Expert Advisor can be placed on any chart. You can use Virtual Stops simultaneously with any other trading Expert Advisor. The Expert Advisor also features: on screen display extended logging separate EA log file standa
US Dollar Index (USDX) is an index (or measure) of US dollar value comparing to a basket of foreign currencies. It is a weighted geometrical average of the dollar value calculated as a share of each currency in the basket: Euro (EUR), 57,6% share Japanese Yen (JPY), 13,6% share Pound sterling (GBP), 11,9% share Canadian Dollar (CAD), 9,1% share Swedish krona (SEK), 4,2% share Swiss Franc (CHF), 3,6% share USDX goes up when the US dollar is gaining "strength" (value) comparing to other currencies
MACD 技术在日常交易中经常使用。对于寻找当前行情趋势,和行情发散/收敛它很有用。 这个版本的 MACD,可以更快、更好地帮助现实世界里的人们做出交易决策。它基于省缺的 MACD, 加上行情力量的强度功能 (绿色柱线代表作多强度, 红色代表做空强度), 且箭头指示开/平仓的方向。通过比较强度柱线, 您可以更容易地预测趋势。 总而言之,利用这个指标,人们可以更快地做出决策,并最终领先行情。