在Facebook查找我们! 加入我们的粉丝群
使用MetaTrader 5新的可能性
最受欢迎的EA交易和技术指标、新闻信号、代码库中常规传入的现有的MQL5程序和热门讨论的论坛主题。
用于 MetaTrader 5 的 Ilan 由于使用虚拟交易,同时并发双向交易 (买与卖) 成为可能。 这样,允许用户在 MetaTrader 5 的单向持仓规则下,采用流行策略。 EA 设置 该 EA 的设置很简单。不过,策略的所有重要设置均可调整。可用工具: 单一 MagicNumber 用于识别交易; 交易方向选项 ( Trade direction ): 仅买入, 仅卖出或者并发双向; 开仓步长 ( Step ) 和盈利距离 ( TakeProfit ) 可自动适应 4 或 5-位的报价; 起始手数 ( Start lot ) 和增量系数 ( Lot coefficient ) 用来指定本金使用大小; 最后, 交易数量限制 ( Max trades in one direction ) 和最终一系列交易的止损 ( Max loss of last trade ) 用于风险管理。 您可以根据需要在单一账户里使用多个 Ilan EA (即便是单一金融品种)。它们之中的每一个都仅处理自己的虚拟交易,不会与其它实例交互。手工交易加上 EA - 这不会影响交易策略。即使有
What is Center of Gravity? The Center of Gravity indicator allows you to get an instantly strong sentiment of where any market is going. It works with any kind of market: Forex, Stocks, Metals... The extreme ease of reading is the real power of this indicator. The basics behind Center of Gravity is a physics law: barycentre. When the market price deviates strongly from this centre of gravity, the probability is considered high that the market price will evolve back towards the centre of gravity.
脉冲系统在“进入我的交易室”一书中首次描述。 它使用 MACD 直方图和价格指数移动平均线 (EMA) 的方向来定义冲量。 规则是永远不要与冲动交易。 它的颜色代码为您提供了几个信号: 当 EMA 和 MACD 直方图都在上升时,脉冲系统将条形颜色标记为绿色(不允许做空)。 当 EMA 和 MACD 直方图都在下降时,Impulse 系统会将条形颜色标记为红色(不允许购买)。 当 EMA 和 MACD 直方图指向不同的方向时,Impulse 系统会将条形颜色标记为青色(您可以做多或做空)。 参数: MACD_Short_Length (12) – MACD 计算的空头 EMA; MACD_Long_Length (26) – 用于 MACD 计算的多头 EMA; MACD_Smoothing_Length (9) – 信号线的平滑值; Short_EMA_Length (13) – 短期价格 EMA。
包络线或通道线设置为平行于移动平均线(如果您使用两个均线,则为慢速均线)。两条通道线必须包含日线图上过去两三个月所有价格的大约 95%,只有极值突出在外面。通道线提供了有吸引力的利润目标——在上线附近卖出多头,在下线附近做空。 AutoEnvelope 是一个自定义指标 - 一个原始工具,通过计算最后 100 根柱线的标准偏差来自动选择通道宽度。它被设计为使用固定通道大小或最多每周更改一次值(在每周图表上每月一次),使其甚至适用于日内数据(使用“固定通道大小”参数从一种模式到另一种模式)。 除了 AutoEnvelope 之外,还绘制了 EMA。这种组合允许您更改 EMA 并使包络跟随它,而无需调整两个单独的指标。如果您不想看到移动平均线,请进入 AutoEnvelope 属性并将平均线(第二行)的颜色更改为“无”。 参数: EMA_长度 (22) – 这是绘制在通道中心的指数移动平均线的条数。 因素 (27) – 这是用于创建通道的标准偏差数(以十分之一表示)。 从统计上讲,2.7 是适合使用的大小,但它假定标准分布,这并不总是存在于市场中。 我们发现 27 适用于大多数使用
本指标的主要目的是根据 "混沌交易, 第二版" 策略,在图表里检测并标记交易信号。 带有角度的多头和空头背离柱线 (包括下蹲)。 柱线位于红色或绿色区域,是根据动量振荡器的直方条颜色。 图表上的下蹲柱线颜色独立于动量振荡器直方条。 "important" 级别的分形与鳄鱼指标的 "Teeth line" 相关。 绘制角度射线,是从平衡线至反转柱线。 第二智者和蓝光信号。 动量振荡器指标的 "区域里随后的第五根柱线" 信号。 本指标包括 新交易维度图表 指标的基本功能, 即以下: 检测并指示当直方条线穿越零轴时在图表上生成信号,以及相同方向上形成的蓝光特殊信号。 彩色柱线有三个区域 (红, 绿, 灰), 检测下蹲柱线。 为了切换 新交易维度图表 的功能, 将输入参数 Use new trading dimensions colors 设为 TRUE 值。 本指标根据 B. Williams 描述的策略专为 MetaTrader 5 开发。 图例: 蓝色柱线 - 下蹲柱线。 柱线之上的红星或绿星 - 柱线含有 "反向" 背离信号 (BDB)。 红色菱形或绿色菱形 - "第二智者" 信号。
世界上没有本软件的同等产品,它代表一个覆盖交易信号的通用交易 "控制台",自动入场,设置止损和止盈,还有在单一窗口里同时进行多交易尾随终止。EA 的 "三次点击" 直观控制,确保在不同计算机上全方位使用所有功能,包括平板电脑。 与附加的信号指标交互来标记图标,给出实际市场的全貌,EA 令您做出正确的选择,以及在大多数情况下成为胜者一方。内置资金管理算法, 还有自动计算手数, 虚拟订单交易, 以及一些其它从崩溃账户里挽救交易者的 "诀窍"。它不是一个 "黑盒子"。而是一个深思熟虑的交易员的不可或缺的助理, 至少要尝试一次它的动作。 注,在面板上形成的 EA 不能在策略测试员中测试。可以在您的模拟账户里以实时模式检查它, 您可以下载本 EA 的免费版 - 混沌交易 EA 演示 。 EA 表现为一个面板,带有内置功能的交易机器人的,自动基于交易者可直观检查的交易信号入场,完全按照比尔·威廉姆斯的策略“混沌交易:第二版”和“新贸易维度”。在单独的窗口里,EA 识别价格走势的导向,用于指定品种和时间帧的全自动交易模式,也可以多品种并发。 它同时分析 MetaTrader 5“市场观察”窗口中显示
Scalper Pad Scalper Pad panel is designed for scalping and has only the basic commands for scalping: BUY, SELL, CLOSE, REVERSE, and the choice of LOTS. Others versions: VirtualTradePad PositionsStyle VirtualTradePad Ordersstyle VirtualTradePad SignalsStyle VirtualTradePad "One Click Trading Panel" Important Features When a position is successfully opened, you will hear a sound similar to the same action in the terminal; If there is an error, you will hear the error sound; On the the BUY and SELL
This indicator shows Pin Bar candlestick pattern on the chart. The bearish pin bars have red color, the bullish pin bars have blue color. The indicator shows alert when Pin Bar candlestick pattern is formed. It's recommended to use it at timeframes H1 and higher. The best moment (strong signal) is when Pin Bar is formed close to the support/resistance level.
指标-预测员。作为助理十分有用, 作为一个关键点来预测未来价格走势。 采用搜索历史中最相似的部分 (形态) 做出预测。 指标以绘制线条形式显示柱线收盘价的变化结果。历史深度, 预测柱线的数量, 形态大小和搜索品质可通过指标设置调整。 设置: PATTERN_Accuracy_ - 搜索品质。 PATTERN_Size_ - 形态大小 (柱线)。 PROGNOSIS_Bars_ - 预测柱线数量。 SEARCH_Deep_ - 搜索历史的深度 (柱线)。若设为零, 则搜索整个可用历史。 PROGNOSIS_Start_Bar_Shift_ - 开始预测的柱线数量。数量是在旧的柱线方向。0 是最新的柱线。
MetaTrader 5 专业交易面板 —— 图表与键盘一键交易的高效控制中心 一款面向主动交易者的专业 Trading Panel,可让您比标准 MetaTrader 操作方式更快、更直观地完成开仓、平仓、修改、管理与控制。 这不是一个普通的小工具,而是一个为高频手动操作、仓位管理、挂单控制与利润管理而设计的完整交易工作台。 通过这套面板,您可以直接在图表上一键执行交易,通过键盘快速触发核心操作,并借助自动参数计算、图形提示、信息标签以及可视化管理功能,大幅减少重复性操作,让整个交易流程更加流畅、高效且专业。 使用我们的交易面板,您可以直接从图表上一键下单,执行交易操作的速度可比标准 MetaTrader 控件快约 30 倍。 全新高级版本现已推出: 使用 VirtualTradePad PRO SE 升级您的交易流程 — 适用于 MetaTrader 5 和 MetaTrader 4 的新一代专业交易面板。 MT4 版本 | 完整说明 + DEMO + PDF | 如何购买 | 如何安装 | 如何获取日志文件 | 如何测试与优化 | Expforex 的所有产品 为什么交易者会
通用多货币交易系统 多货币交易系统,基于标准指标。在此 EA 中应用了 12 个标准指标,可达 3 个信号。所有指标有可定制外部参数。 亲爱的用户, 您可以通过给作者写 私信 订购此 EA 的源代码。 主要优势 自动手数 (根据当前余额计算交易量), 资金管理; 依时间工作 (限制 EA 的交易时间); 尾随止损 (标准 "仅当盈利" 算法); 市场观察 ECN (与 ECN, NDD 账户工作); 实盘出错处理功能; 根据总盈亏整体平仓,并禁用账户内所有EA。 盈亏平衡 (移动止损到开仓位); 马丁格尔 (若有亏损,则开仓手数递增); 只配合指标信号工作 (开仓信号, 反向平仓并开新仓信号); 当信号改变,平反向持仓; 该 "反转" 功能能够将您的策略信号反转。 指标和信号 移动均线 (MA) (信号 1) 信号的计算使用两条均线的相对位置,一条周期较小 (快速 MA) ,另一条周期较大 (慢速 MA)。它们的参数可在以下变量中指定: 当快速 MA 位于慢速 MA之上,买信号出现,当慢速 MA 位于快速 MA之上,卖信号出现。"无信号" 状态未使用。 移动均线收敛发散 (MACD)
这是一款实用程序,用于图表的自动缩放,可使至少 140 根柱线可见。根据 Bill Williams 的 "混沌交易法" 策略,这是正确分析波浪所必需的。此实用程序可用于 МetaТrader 5 上的所有时间帧。 它在计算开始的第一根柱线位置绘制一条垂线。这条线可以让您看到在图表上充足的柱线,以及波浪序列的可能起始点。它也使得在选定时间帧内显示金融工具的历史价格波浪的标签更加容易。 指标可以自动选择能够容纳 140-150 根柱线所需要的较低时间帧。为此,在图表上使用矩形选择图上所需要的区域,然后鼠标双击矩形边框。该指标会自动选择波浪分析所需的适合时间帧。要返回到初始时间帧,点击 MetaTrader 5 界面上的相应按钮,并使用 "删除" 来删除对象。 建议保存指标至模板,以及 MetaTrader 5 中包含的其它标准 Bill Williams 指标,或在 MQL5 市场里提供的它们的模拟品。亦即以下产品: 混沌交易图表 改编的动量指标 改编的加速振荡器 混沌交易法 EA
本指标的目的是判断点差和利率大小,以及按照存款货币每一个点的风险,设置从当前价位计算的止损距离。 本指标告知交易者有关金融工具在每个时段之间转换时可能的额外费用和利润。它还告知有关的点差和挂单的距离,从当前价位的尾随止损位。此外,指标告知交易者有关存款货币每一个点的风险。 信息被显示在图表下方的单独子窗口里。它可以避免图表被不同的信息塞满。点差和利率监控指标适合任何自定义模板。
本指标的主要目的是根据 "混沌交易, 第二版" 和 "新交易维度" 策略,在动量振荡器的直方图里检测并标记交易信号。 本指标检测并标记以下交易信号: "双峰" - 背离。 信号 "第二智者" - 动量振荡器连续三根柱线之后颜色改变。 直方条与零轴交叉。 信号 "飞碟"。 指标包括一个信号块,用来方便地通知交易者任何新信号的形成。 本指标是基于 "混沌交易" 策略的复杂交易系统的一部分。本指标是形态的一部分。建议指标与以下产品配合使用: 混沌交易法 EA 混沌交易图表 新交易维度图表 改编的加速振荡器 识别 1 2 3 形态 波浪制造者 点差和利息监控 虚拟挂单突破做空 (EA 的简化版本) 虚拟挂单突破做多 (EA 的简化版本)
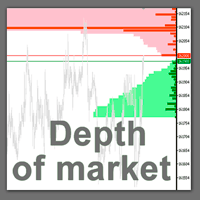
股票交易者的专业工具现已登陆 MetaTrader 5 。 真实市场深度图表 指标在图表上以直方条的形式显示可视化的市场深度,并在实时模式下刷新。 根据用户需要提供更新! 现在真实市场深度指标显示买卖交易请求的交易量比率 (B/S 率)。它显示每种请求类型占全部请求流的份额,以及绝对交易量。 怎么使用它?一般高频交易者的观点, 当某种请求占显著支配地位, 价格趋势将往请求方向倾斜, 即交易量大的。观察并使用我们的真实市场深度指标! 利用 真实市场深度图表 指标您可以正确评估市场请求并从图表上看到大的市场。这可以 100% 的精确剥头皮和设置持仓止损。 指标以两种相应颜色的水平直方条形式显示买和卖的请求 (买-卖)。价格图表上给定级别的显示条和它们的长度与请求的交易量相应。此外, 它指示买卖请求的最大交易量。 反危机出售。今日低价。赶紧! 此指标显示买卖请求总数量作为堆积面积图。这可以评估当经过下一价位时将会执行的请求总量。买卖请求总数量也显示在图表上。 省缺, 指标显示在图表背景上, 且它不会干扰任何其它指标。当使用指标交易时, 建议使用实际交易量。 本指标仅与提供市场深度的品种工作
This is an original trend indicator. Its values vary from -1 to +1. The closer the indicator is to +1, the stronger is the ascending trend. The closer it is to -1, the stronger is the descending trend. The indicator can be also used as an oscillator for determining the overbought/oversold state of the market. The indicator has one input parameter Period for specifying the number of bars to be used for calculations. Version 2.0: Added the signal line calculated as a moving average of the main lin
成交量加权 MACD 成交量加权 MACD (VW-MACD) 由 Buff Dormeier 创建,并在他的《使用成交量分析投资》一书中进行了描述。它代表了成交量加权价格趋势的收敛和发散。 包含成交量允许 VW-MACD 通常比传统 MACD 更具响应性和可靠性。 什么是 MACD(移动平均收敛散度)? 移动平均收敛发散由 Gerald Appel 在 1979 年创建。标准 MACD 绘制短期指数平均值和长期指数平均值之间的差异。当差值(MACD 线)为正且上升时,表明价格趋势向上。当 MACD 线为负时,表明价格趋势向下。 计算此差异的平滑指数平均值以形成 MACD 信号线。当MACD线高于MACD信号线时,说明MACD的动能正在上升。同样,当 MACD 低于 MACD 信号线时,MACD 的动能下降。 MACD 线和 MACD 信号线之间的这种差异经常被绘制为直方图,以突出两条线之间的价差。 MACD和大众MACD有什么区别? 成交量加权 MACD 是用两条指数移动平均线来计算 MACD 与两条相应的成交量加权移动平均线的差值。因此,VW-MACD 对
EAmicroMoney Bet Expert Advisor works on 1 currency pair - EURUSD. Lots are set up manually in the Lots parameter. Optimization of the Lots parameter makes this Expert Advisor powerful. It is based on filtered-MACD & CCI to trigger the BUY or SELL signals. Open positions are closed by Take Profit, Stop Loss or according to opposite signals. Maximum value of the Lots parameter is 0.09 and minimum value is 0.01. If you have enough money you can use 0.09. For more details please see the screensho
Virtual Multi-currency Trailing Stop. It works exactly as the "regular" Trailing Stop, but it does not send trading orders to change the existing Stop Loss. It only changes Virtual Stop Loss level when the current price reaches Trailing Stop Start pips of profit, securing/"locking" more profit as the price moves in favor of a trade. When the price turns back and becomes equal to the Virtual Stop Loss level, the position is closed at the market price. It allows flexible positions filtering and pr
Pearson linear correlation. The indicator shows statistical correlations between symbols, selected by user. Input parameters: Time frame - timeframe for analysis (Current, 1 Minute, 2 Minutes, 3 Minutes, 4 Minutes, 5 Minutes, 6 Minutes, M10 Minutes, M12 Minutes, M15 Minutes, M20 Minutes, M30 Minutes, 1 Hour, 2 Hours, 3 Hours, 4 Hours, 6 Hours, 8 Hours, 12 Hours, 1 Day, 1 Week, 1 Month).; Prices - price type, used in analysis (Close price, Open price, High price, Low price); Limit analysis - Numb
The new product Time IV (2013) is an updated version of Time III introduced earlier in the Market. The indicator displays the work time of world marketplaces in a separate window in a convenient way. The indicator is based on the TIME II (VBO) indicator rewritten in MQL5 from a scratch by fyords . The new version Time IV is a higher quality level product. Comparing to Time III it consumes less resources and has optimized code. The indicator works on Н1 and lower timeframes. At the moment, the pr
An audio signal is activated when candle patterns appear. The corresponding candle is marked on the chart and signed by the candlestick pattern's code. Comparing the code with the list in the upper left corner of the screen and knowing how the pattern operates, you can check the overall trend and make your decision to buy or sell. If your broker uses five-digit quotes, change UseExtraDigit parameter to true.
This indicator draws color bars on the basis of the ADX Wilder indicator helping you to find trends. Color of Bars: Blue - the main signal is going up and DI+ > DI-, the market is bullish; Red - the main signal is going up and DI- > DI+, the market is bearish; White - the main signal is going down, no trend is detected. Input Parameters: Period - the period of the ADXWilder indicator.
The indicator displays entry points on the chart using arrows. Three exponential moving averages (EMA) are used: The fast one (red) with the parameter of averaging MaPeriod; The medium one (green) with the parameter of averaging equal to MaPeriod * 2; The slow one (black) with the parameter of averaging equal to MaPeriod * 4. Condition for Opening a Long Position: The fast EMA crosses the medium one upwards; The medium EMA is above slow one. Condition for Opening a Short Position: The fast EMA
For opening positions, the Expert Advisor uses the signals of the Three Moving Averages Signal indicator. Input Parameters: Period of fast ma - period of the Three Moving Averages Signal indicator; Take in atr, 0 - do not use a take profit - take profit size calculated using ATR (50) applied to the current timeframe; If the parameter value is 0, it is not used; Stop in atr, 0 - do not use a stop - stop loss size. If the parameter value is 0, it is not used; Trailing in atr, 0 - do not use a tr
Equity ProfitLoss Control is an Expert Advisor that controls equity considering the initial balance. The Expert Advisor closes all positions when an equity value specified in percentage or deposit currency is reached. Equity is calculated as a difference between the current equity and the initial balance fixed when there are no positions or the balance at the very first start of the Expert Advisor. There are notification functions: Alert, Mail, Sound, Mobile, display of information (the current
Rich Monster is a new Trajecta research based on the reverse engineering of some of our trading signals (Trajecta Labs Trading Ecosystem). The idea here is fit some of the best strategies and setups inside the Ecosystem and transform it into a highly profitable Expert Advisor. Our goal: build an innovative Expert Advisor based on our Ecosystem where thousands of proprietary and new strategies are tested in real time to discover new trading opportunities for our customers. Our trading signals ma
这是一款基于市场深度的可视化指标,它可工作于所有提供市场深度的品种。它显示每笔卖价/出价的交易量与总卖价/出价的交易量的比值,这样用户可以直观地判断买卖方向的瞬时强度。你可以同时在几个图表上应用这个指标,观察不同品种的买卖队列。 购买前请确认你的交易商有提供市场深度这个功能。 。。。。。。。。。。。。。。。。。。。。。。。。。。。。。。。。。。。。。。。。。。。。。。。。。。。。。。。。。。。。。。。。。。。。。。。。 。。。。。。。。。。。。。。。。。。。。。。。。。。。。。。。。。。。。。。。。。。。。。。。。。。。。。。。。。。。。。。。。。。。。。。。。。 。。。。。。。。。。。。。。。。。。。。。。。。。。。。。。。。。。。。。。。。。。。。。。。。。。。
This EA learns from its own mistakes. Each unsuccessful trade is thoroughly analyzed and turned into a future success. The Expert Advisor uses the time efficiently working 24/7. When the market is closed, the trading robot is especially productive, as it analyzes its own mistakes and makes a better trading plan for the coming week. This has been achieved thanks to its self-learning intelligent system. Full description: https://www.mql5.com/ru/blogs/post/688857 Free version: https://www.mql5.com/
Features The Expert Advisor's conditions for entering and exiting the market are based on the MultiSignals_PCH indicator, which can be downloaded for free from Code Base . The Expert Advisor can be used for trading in the manual, semi-automatic or automatic mode. Multi-currency trading. This version supports 3 symbols. Multi-system trading. In this version, you can set up 4 strategies for each symbol. The Expert Advisor sets a unique magic number for each strategy. Multi-timeframe trading. You
DiTrade Expert Advisor is based on the custom indicator DiTrend . Entry points are determined using values of the DiTrend indicator. Positions are closed when reaching specified profit and loss levels. Input Parameters Period Main - Period Main input parameter of the DiTrend indicator; Period Signal - Period Signal input parameter of the DiTrend indicator; Stop Loss - loss fixing level in points; Take Profit - profit fixing level in points; Fixed Lot - fixed lot value; Variable Lot - variable lo
Easy Order is an Expert Advisor allowing you to enter any type of trade with one click based on your RISK preferences. You can choose to enter a trade and automatically calculate your lot size based on how much of your account you want to risk. Risk is calculated based on your Stop Loss placement. You can use a fixed lot size if you don't want to use risk based calculation of lot size. Your previous setting of risk based or fixed lot size remains saved for your next use of this Expert Advisor. T
Simple indicator to show the candlestick opening time below each bar or below the bars of the higher period. Includes: Font customisation Color customisation Date / Time / Both modes Parameters: Font Size: 8 Font Color: White Font Name: Consolas Time Method: Time Only Time Frame: Current - when current, display label at each bar, higher timeframe will place label on opening bar of specified timeframe
ROMAN5 Time Breakout EA with Advanced TrailingStop includes the BreakEven feature. It automatically draws the boxes for daily support and resistance breakouts. When the price is below the support line, it is a sell signal; and when the price is above the resistance line, it is a buy signal. Advanced TrailingStop comes with 6 indicators: Fractals, Parabolic SAR, Bollinger Bands, Heiken Ashi, Moving Average and a combination of Fractals+Parabolic SAR. Advanced TrailingStop automatically moves the
If you want something as below: Sell FOREX trading signal. Manage multiple accounts. Follow somebody's trading. "TradeCopier_source" and "TradeCopier_follow" can help you! Features: Copying from one source (master) account to multiple follower (slave) accounts. Allow investor (read only) password for the source (master) account. There are no complicated settings and input parameters, everything is easy. Works with different Brokers. Works with different symbols (EURUSD_FX, eurusd_m, etc.). Can c
Brief Description ElliottWaveMaker 5 Offers: control of manual labeling of Elliott Waves in real time mode (you will always know, if there are labeling errors); view wave rules in Russian or in English language in the terminal window (the wave inspector), edit the wave labeling rules; automatic calculation of price and time targets; fast removal of any part of the wave labeling; assessment of waves according to Fibonacci ratio, internal structure, rules compliance and their sorting in the wave i
The Heiken Ashi indicator drawn using a tick chart. It draws synthetic candlesticks that contain a definite number of ticks. Parameters: option prices - price option. It can be Bid, Ask or (Ask+Bid)/2. the number of ticks to identify Bar - number of ticks that form candlesticks. price levels count - number of displayed price levels (no levels are displayed if set to 0 or a lower value). calculated bar - number of bars on the chart. Buffer indexes: 0 - OPEN, 1 - HIGH, 2 - LOW, 3 - CLOSE.
About Live Pivot Point Indicator The "Live Pivot Point" indicator is market movement indicator that calculates the "Pivot Point" value and the associated support and resistance levels. A pivot point is calculated as an average of significant prices (high, low, close) from the performance of a market in the prior trading period. If the market in the following period trades above the pivot point it is usually evaluated as a bullish sentiment, whereas trading below the pivot point is seen as bearis
The EAmicroMoney Expert Advisor works on EURUSD. It has the following parameters: maximum step price, moving average period and moving average shift. It is not bound to any specific timeframe. It uses a unique technology to identify small trends and make large volume deals. Default input parameters: StepPrice=0.00031, moving average period=12, moving average shit=9. Nothing more to say, just look at the screenshots.
.................................. This script is intended to help users to get information about ticks and spreads (e.g. ticks count, minimum/maximum/average spread). It can export reports in the CSV format with this information. Traders can see spread statistics in real time in the chart window It is useful for comparing spreads of different brokers. --------------------------------------------------------------------------
A stable gold mine from developers who trade their own Expert Advisors on real accounts is here! We are introducing Gold Mine, the crowing result of our many years of experience in active trading. We regularly update, test and improve all our products so as to meet the high standard of the St.Traders team and bring the users an advantage in the game. Gold Mine is also available in MetaTrader 4 version. Input Parameters: MagicNumber – it's necessary to set the identification number of the Expert
Swing 介绍 Swing 是一款漂亮的自动适应 EA。请在任意经纪商平台上,选择 "市场观察里的所有品种",测试 Swing 的省缺设置。然后去寻找另一个声称自适应的 EA,在任意经纪商平台上,选择 "市场观察里的所有品种",测试它们的省缺设置,来验证 Swing 的能力。不用光听我说的。请充分发掘这个完美的交易系统! 大多数 Swing 设置在测试大多数品种时,有相近的盈利能力。如果 "Flux" 参数设置大于零,EA 自动适应范围从小到大增长的入场和盈利目标,直到策略到达平衡,即在大多数常规盈利周期中每个品种每月 3 至 5 次交易交易结果。 以前来自测试的合适设置不能保留,现在版本 10 可以了,当您首次启动 Swing 时,会有一轮交易狂潮,可能令您兴奋或恐惧。初始交易周期对于 Swing 是危险时刻,因为它要开始自适应处理,不过,如果您的设置已经工作了一个月,它们会以缓慢地步履继续以后的工作,但与您首次运行 Swing 相比,将赚取更大点数范围的利润。 自从版本 9.0,我已经实现了一个文件保存和恢复系统,以便保留存储在 EA 里的合适设置,来保护因意外重新初始化,而引起
How important is the trend discovery in stock and Forex market! Are you still confusing how to find the inflection point of trend? Are you still worrying about how to draw long-term and short-term trend lines? Fortunately, since now, you don't need to sit in front of your computer and wait next inflection point to appear whole day and whole night. Relax yourself, open your interested symbol, apply this smart tool, then you can see inflection point in different strength, as well as long-term and
The Renko chart is only concerned with price movement. A new brick appears when price surpasses the top or bottom of the previous brick by a predefined amount. Parameters Brick size - size of the bricks; Offset - offset of every added brick, setting this to half the brick size creates so called 'mean Renko bars', such as seen in the second screenshot; Amount shifted - amount of bars shifted left when a new brick appears, and amount of bars shifted right when a new main chart candle appears. Low
本 EA 捕捉货币对的快速价格走势,并与走势同向开仓。 功能上与 MetaTrader 4 版本相同。它包括止损, 止盈和一个 平均系统。 系统工作监控账户 ; 用于 MetaTrader 5 的平均系统 。 此产品的可用于实际图表的演示版本: Exp-TickSniper 演示版 。 此 EA 也不适于在策略测试中测试!出于一些技术原因,它必须运行在实时环境。 主要参数 本系统基于 MetaTrader 4 - MetaTrader 5 接收报价的速度。本系统自动判断下单价位,接收报价的速度和距离用于加仓和盈利的移动止损。 OnlyModify - 该功能允许 EA 工作在持仓跟踪模式,不会开新单。 Timeope - 毫秒间隔,用于 EA 检查信号。数值越大,则产生更多的信号,品质也越低。 DistanceTickSpred - 在 Timeope 时间内,价格变化的差值,用于 EA 生成信号。 TakeProfitTickSpred - 当前货币对的所有仓位放置共同止盈位的差值。 DistanceAverageSpred - 当前货币对,相对于主仓位的加仓位差值。 Trai
ZoneSession allows you to visually show various trading zones on your chart. Excellent for live trading, but also at a glance you can review history for optimum trading sessions to analyse your trade setups. Zone Session shades the chart into sessions of your choice in any combination of colors.
The strategy is based on the DeMarker and MACD indicators. Positions are closed by Stop Loss and Take Profit or according to an opposite signal. To lock account profit or limit account loss, you can activate Target equity and/or Minimum equity in percentage of deposit at the settings. This EA is optimized for EURUSD M1, but you can use it for other instruments by performing optimization first. You can adjust important parameters by performing optimization periodically using "Every tick based on
Multi-currency Trailing Stop. Classic Trailing Stop. It only changes order Stop Loss when the current price reaches Trailing Stop Start pips of profit, securing/"locking" more profit as the price moves in favor of a trade. It allows flexible position filtering and processing by: Pair Magic Position Position Type The Expert Advisor can be placed on any chart. You can use Advanced Trailing Stop simultaneously with any other Expert Advisor. It also features: On Screen Display Extended logging Sep
Advanced new deals notificator. It always keeps you informed about ALL deals from your MetaTrader 5 trading terminal. Being placed on any chart it sends e-mail and Push Notification with all information about the new deal. The user can create his own message type and include only necessary information into the text. The best deal notification solution. It informs you about absolutely all deals, without missing a single one.