Souline Honma Surf
- 指标
-
Xian Kuan Li
 交易軟件唯一的目的在於創造自我而非創造獲利
 - 版本: 4.15
- 更新: 20 一月 2021
- 激活: 5
指標的使用極為簡單,而且不含未來函數。
指標的使用分為以下簡單的幾個部分:
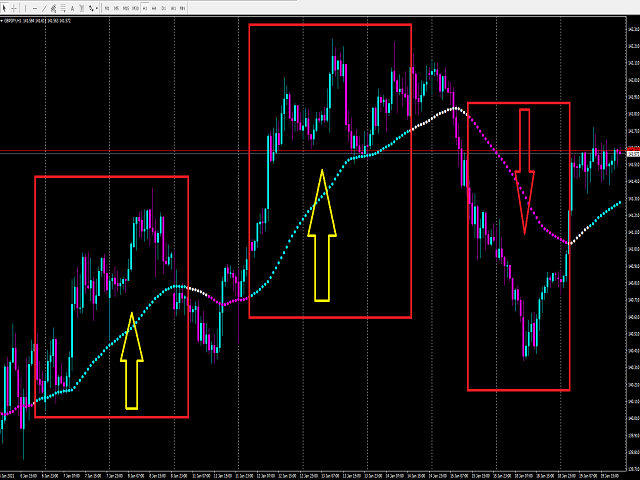
1. 指標呈現藍色(上漲趨勢) -> 只能做多單
2. 指標呈現粉色(下跌趨勢) -> 只能做空單
3. 指標呈現白色(盤整區間) -> 只能觀望不做單
4. 價格在指標上方 -> 只能做多單
5. 價格在指標下方 -> 只能做空單
總結:
1. 指標呈現藍色(上漲趨勢) + 價格在指標上方->做多單
2. 指標呈現粉色(下跌趨勢) + 價格在指標下方->做空單
3. 指標呈現白色(盤整區間) -> 觀望不做單
4. 制定好出場策略
5. 搭配您自己個人的交易模組,並且找到跟我們指標共振的方法去做單,可以讓您的勝率提高到80%-90%
需要觀看更多的操作方法以及我們研發指標的不同搭配作法,請看我的個人資料。
或是到我們的另一個產品"Souline Honma Wave"了解能夠提高更高勝率的做法。
如果有需要更多的指標或是EA信號協助,請在個人聯絡資料裡面聯繫以及留下聯繫方式,我們會盡快聯繫您。