Souline Honma Surf
- 지표
-
Xian Kuan Li
 The only purpose of trading software is to create self rather than create profit
 - 버전: 4.15
- 업데이트됨: 20 1월 2021
- 활성화: 5
The use of indicators is extremely simple and does not contain future functions.
The use of indicators is divided into the following simple parts:
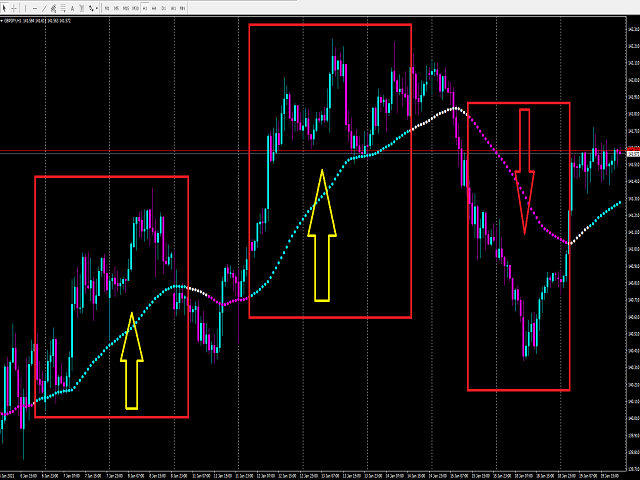
1. The indicator is blue (upward trend) -> only buy orders
2. The indicator is pink (downtrend) -> only sell orders
3. The indicator is white (consolidation trend) -> only wait and see without send orders
4. The price is above the indicator -> Only buy orders can be made
5. The price is below the indicator -> only sell orders
To sum up:
1. The indicator is blue (up trend) + price is above the indicator -> buy order
2. The indicator is pink (down trend) + price is below the indicator -> sell order
3. The indicator is white (Correction) -> wait and see
4. Develop an appearance strategy
5. Match your own personal trading module, and find a way to resonate with our indicators, which can increase your winning rate to 80%-90%
To see more methods of operation and different combinations of our indicators, please see my profile.
Or go to our other product "Souline Honma Wave" to learn about ways to improve your winning rate.
If you need more indicators or EA signal assistance, pleaseleave your contact information , we will contact you as soon as possible.