Trend Screener Pro MT5
- 指标
- STE S.S.COMPANY
- 版本: 21.10
- 更新: 3 六月 2024
- 激活: 10
使用趋势筛选指标释放趋势交易的力量:由模糊逻辑和多货币系统提供支持的终极趋势交易解决方案!
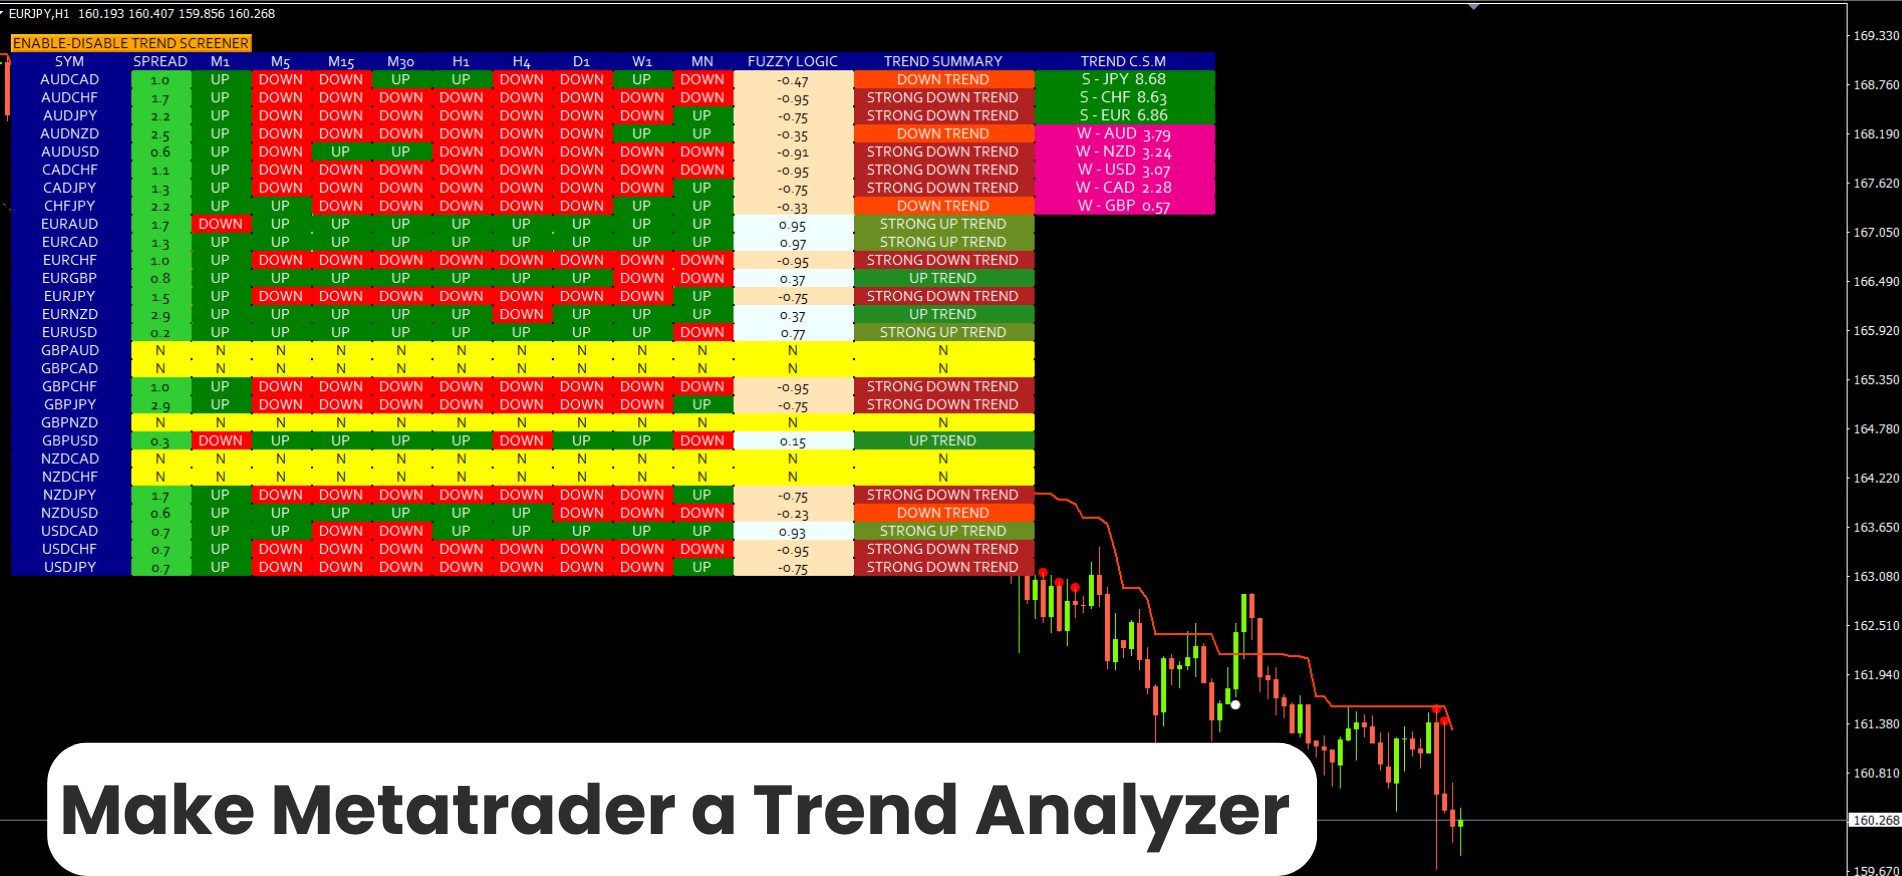
使用趋势筛选器(由模糊逻辑提供支持的革命性趋势指标)提升您的趋势交易。 它是一个强大的趋势跟踪指标,结合了超过 13 种高级工具和功能以及 3 种交易策略,使其成为使您的 Metatrader 成为趋势分析器的多功能选择。
限时优惠:趋势筛选指标终身仅需 50 美元。 ( 原价 250$ ) (优惠延长)
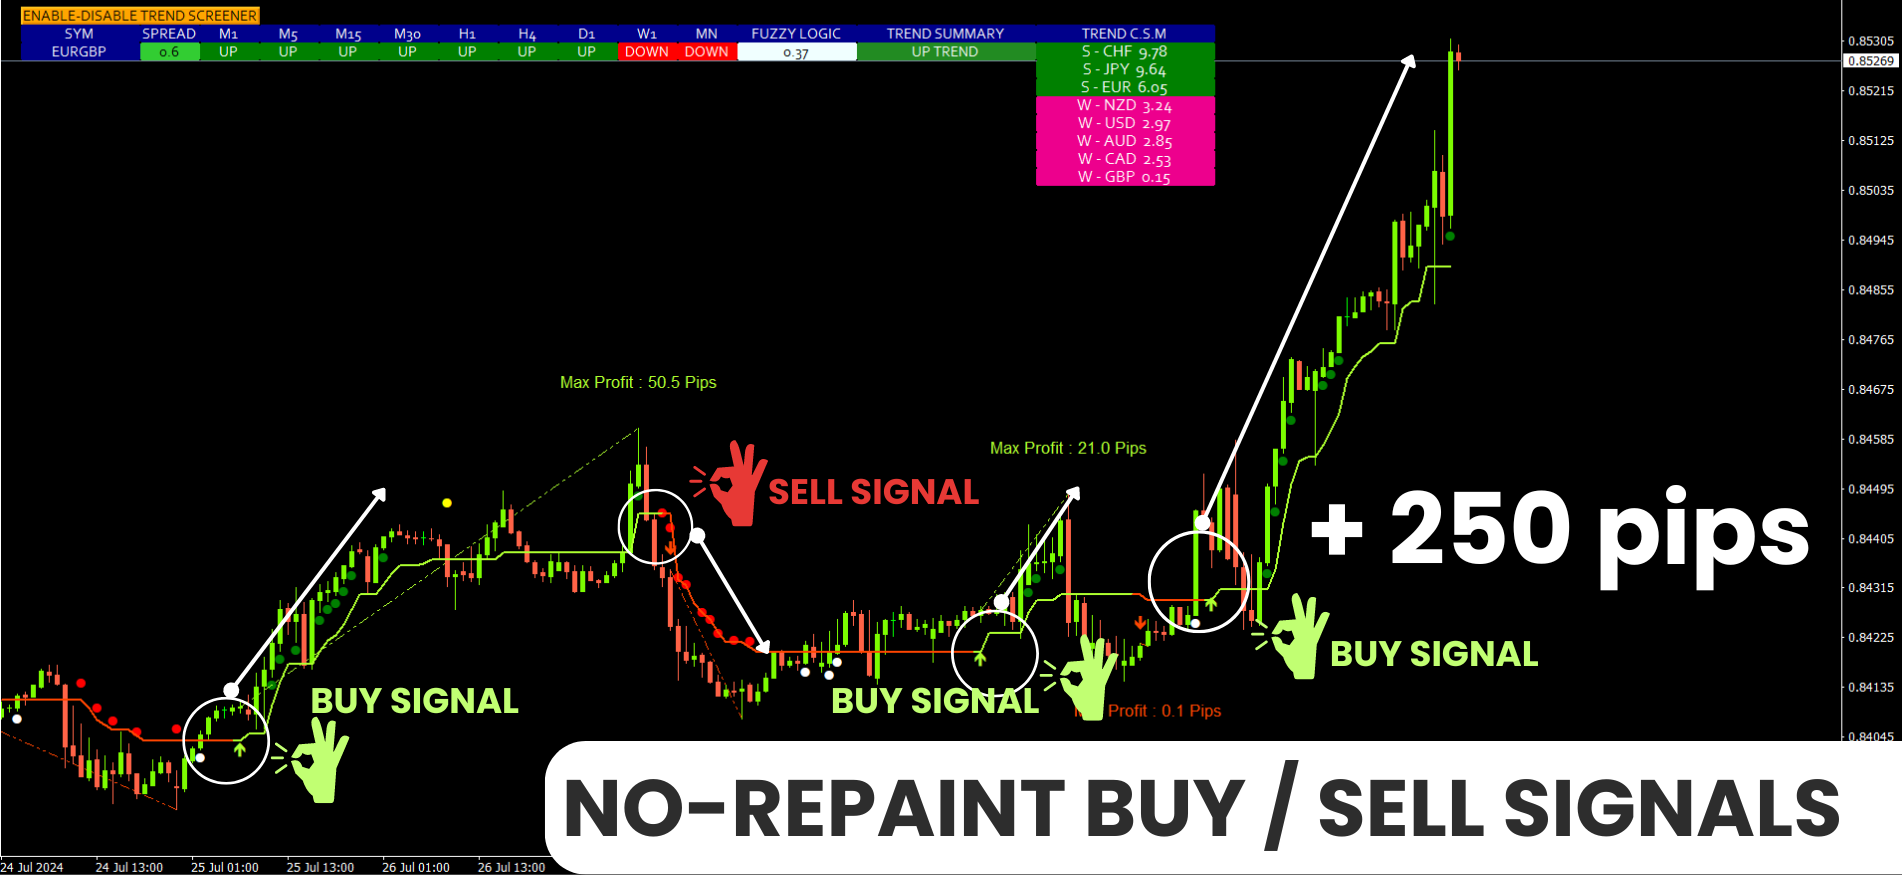
体验趋势筛选器 100% 无需重新绘制的准确性,确保您的交易决策不受过去价格变化的影响。 释放多时间框架和多货币功能的多功能性,使您能够以无与伦比的信心在外汇、商品、加密货币和指数领域进行交易。 利用 Trend Screener 的综合策略套件增强您的交易:
- 趋势跟踪策略和趋势延续策略:趋势筛选器的趋势跟踪策略提供清晰的趋势延续信号,让您有效捕捉趋势走势并管理风险。
- 反转策略和早期入场点策略:趋势筛选器的反转策略可检测市场方向的潜在变化,使您能够预测趋势反转并利用疲弱的市场趋势。通过早期入场点,您可以在潜在的趋势变化之前定位自己 获取可观的利润。
- 倒卖策略:趋势筛选器的倒卖策略专为快节奏的日内交易和短期交易而设计,让您能够利用单个交易日内的小幅价格变动获利。
趋势系统
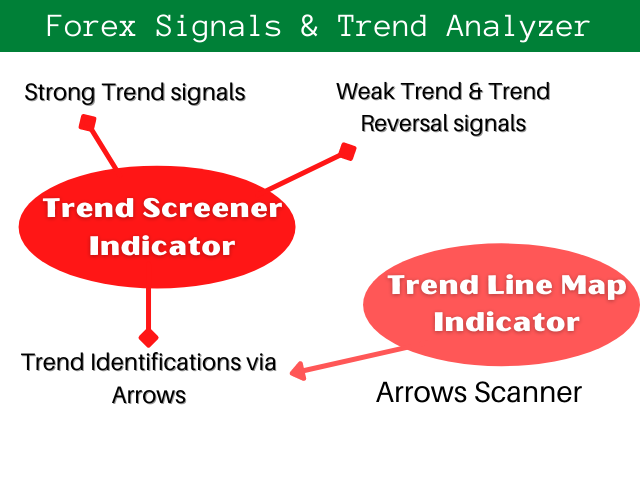
我们的趋势系统由 2 个指标组成:
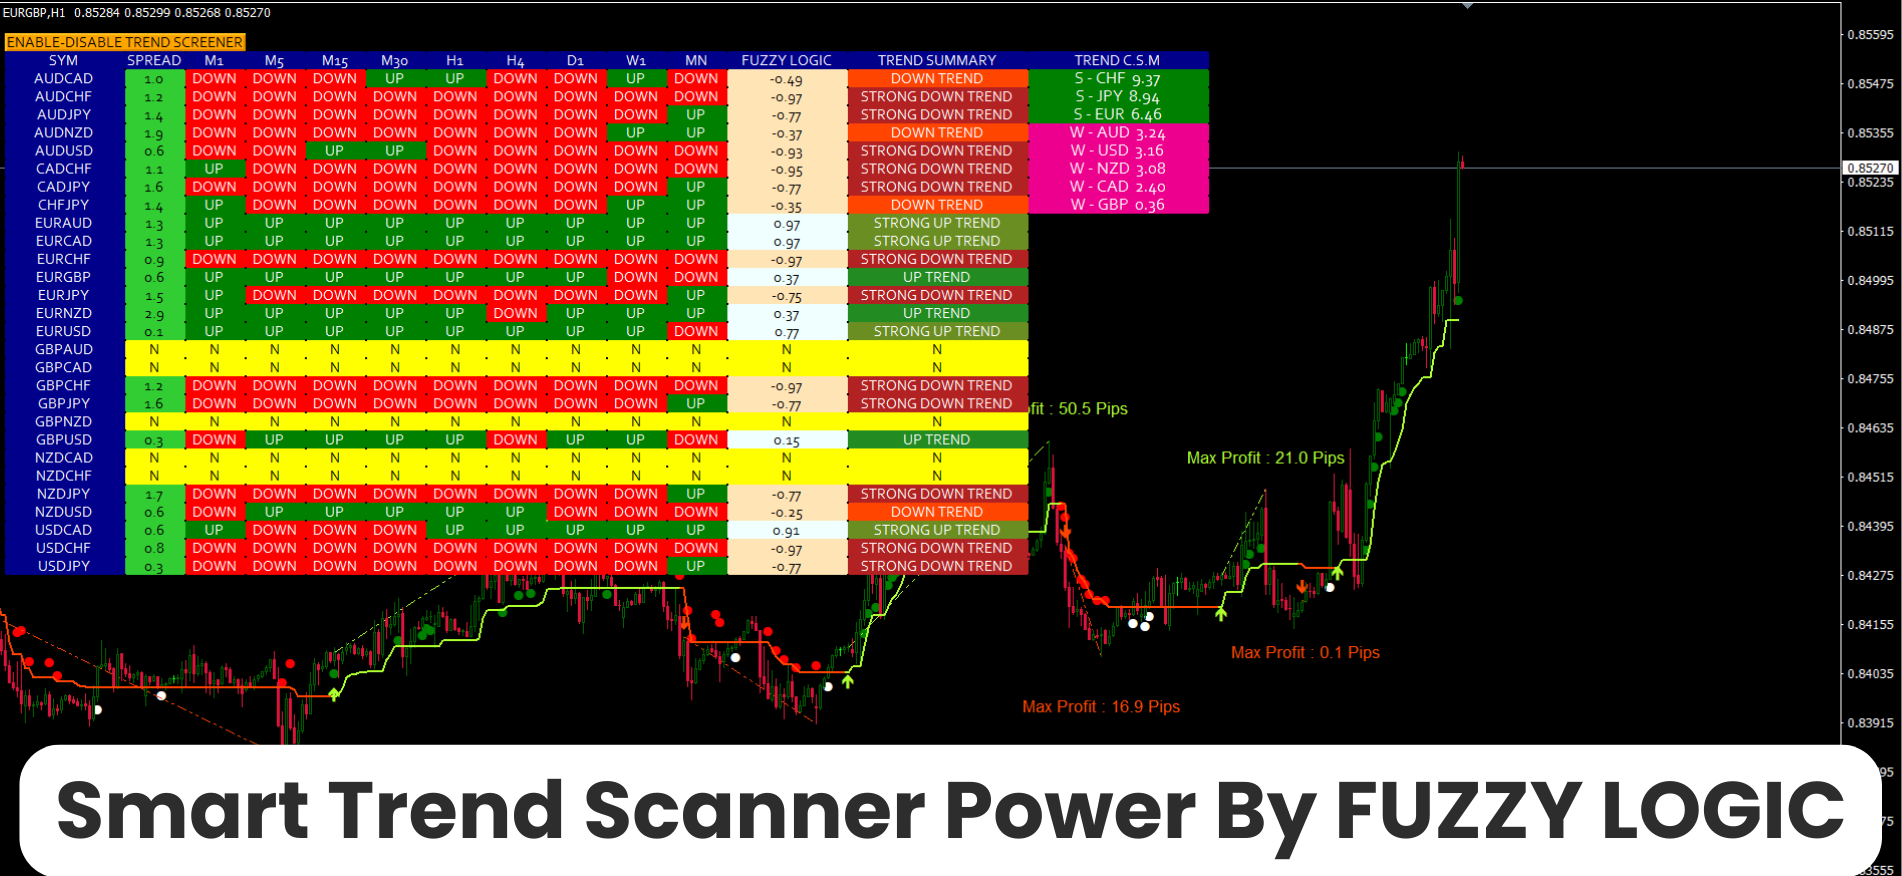
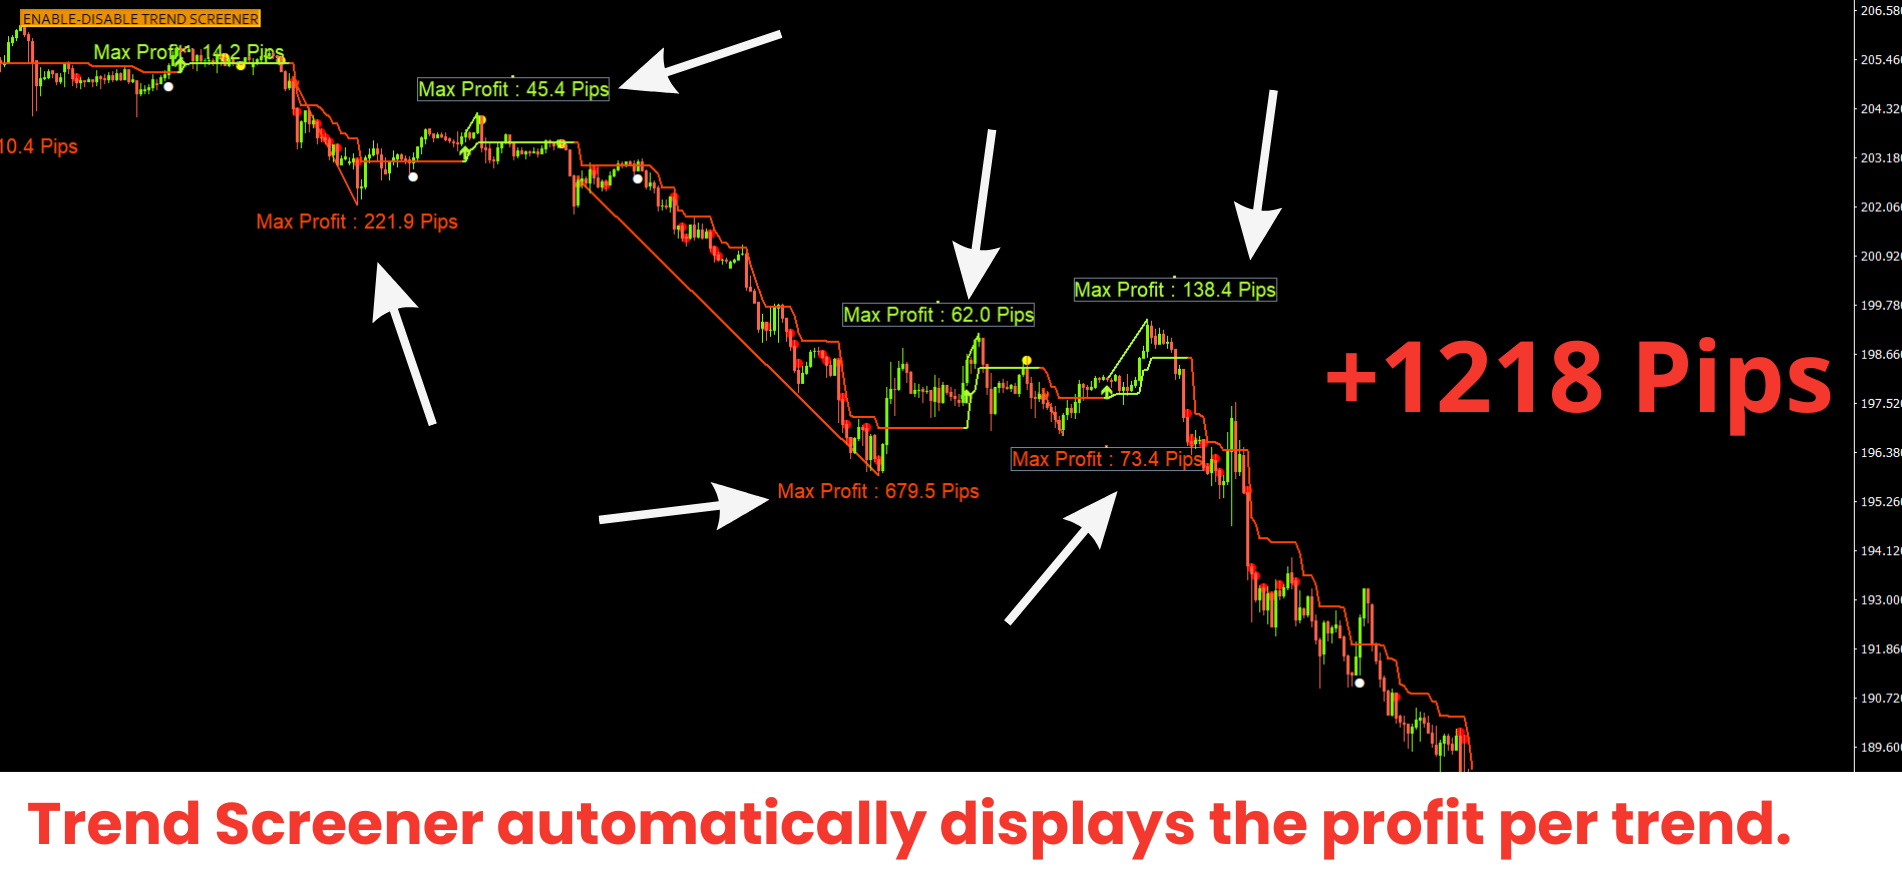
- 趋势筛选指标:显示趋势仪表板、图表中的趋势线、入场点和所有主要功能。
- 趋势线图指示器:将买入和卖出显示为仪表板,生成多货币警报并显示活跃信号盈利/亏损...等。
高级工具和功能
1.智能趋势线工具:根据当前市场情况动态调整。 它比静态趋势线更加复杂,可以用来更准确地识别潜在的趋势变化。 通过动态调整的趋势线可视化当前趋势。
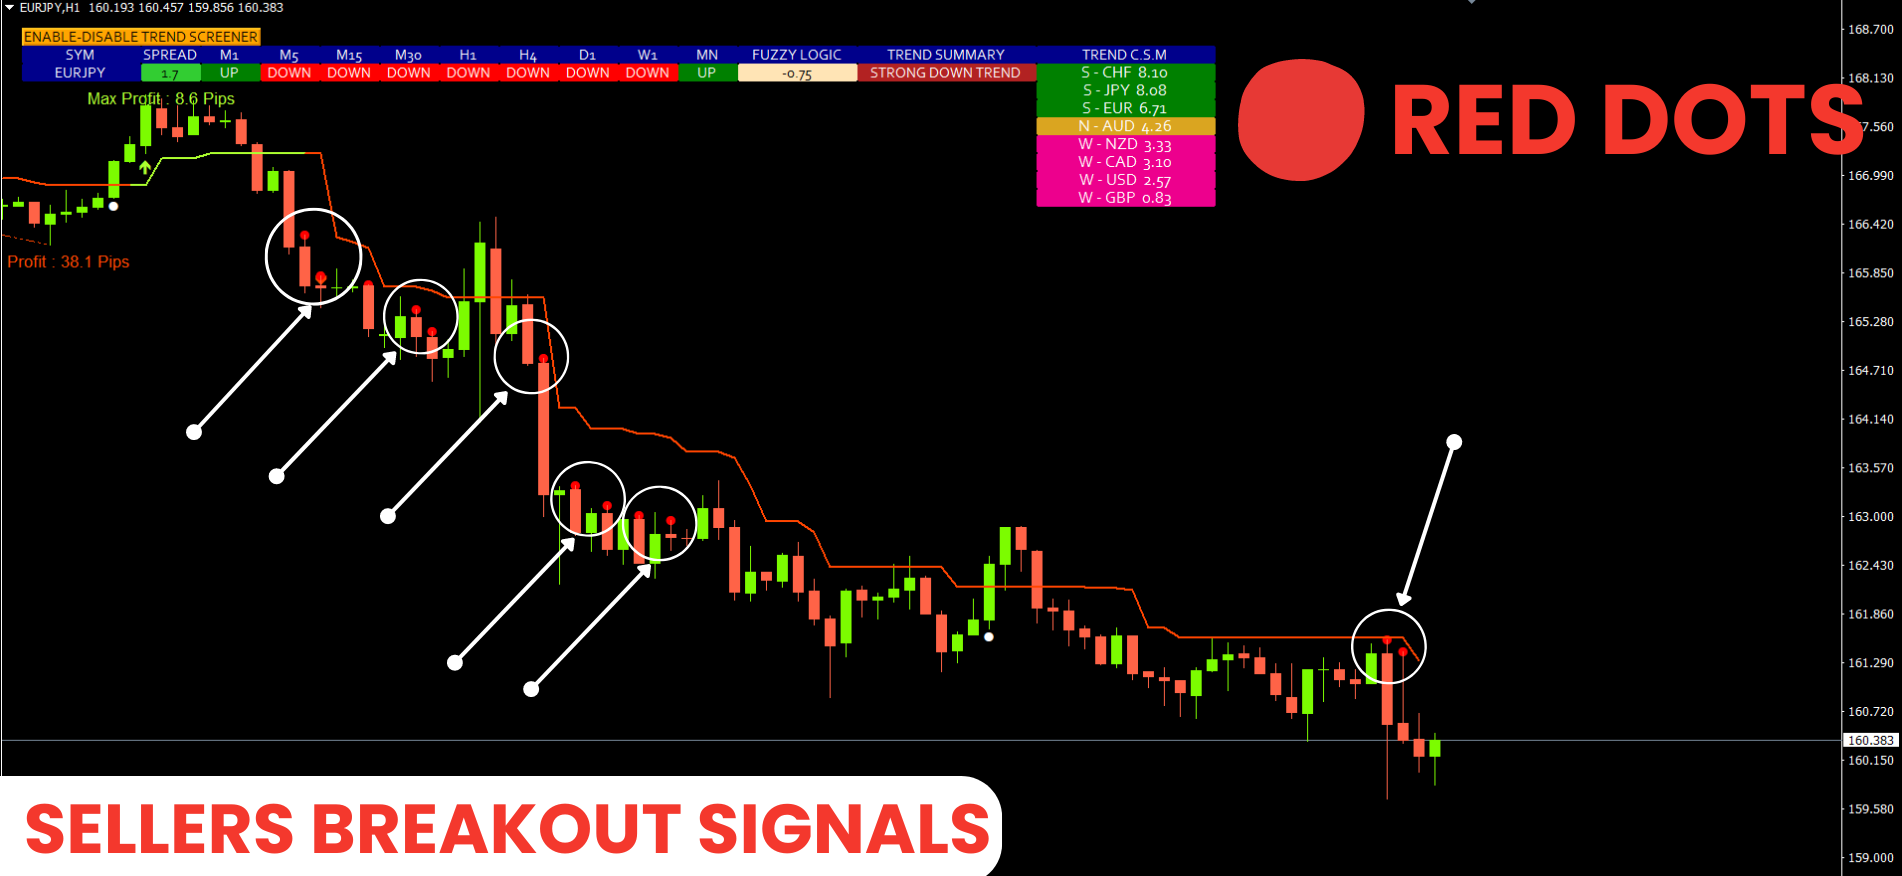
2. 使用反转点的趋势反转工具:帮助交易者识别潜在变化的工具。 反转点是一种使用小点来标记市场潜在转折点和弱势趋势时期的指标。
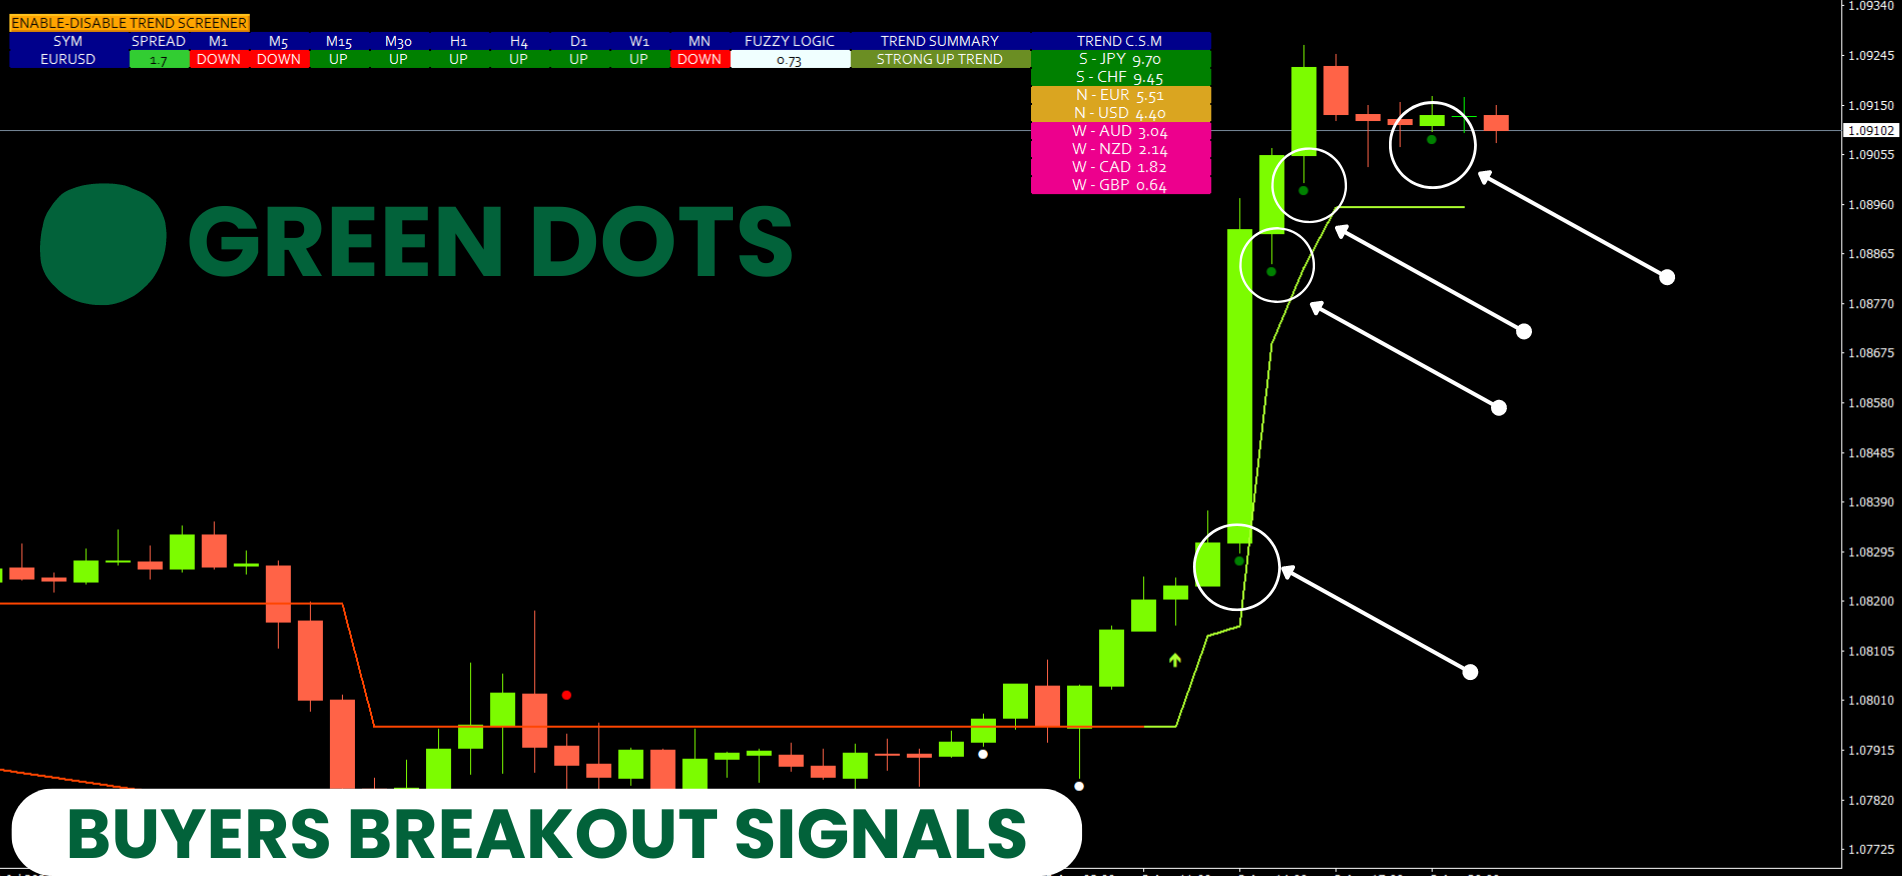
3. 使用强趋势点的趋势动量工具:帮助交易者识别和确认市场强趋势的工具。 它的工作原理是识别价格剧烈波动的时期,并在价格图表上用点标记它们。
4. 使用箭头的趋势确认工具:帮助交易者识别并确认现有趋势延续的工具。 它的工作原理是在价格图表上生成箭头来表示潜在的趋势延续点。
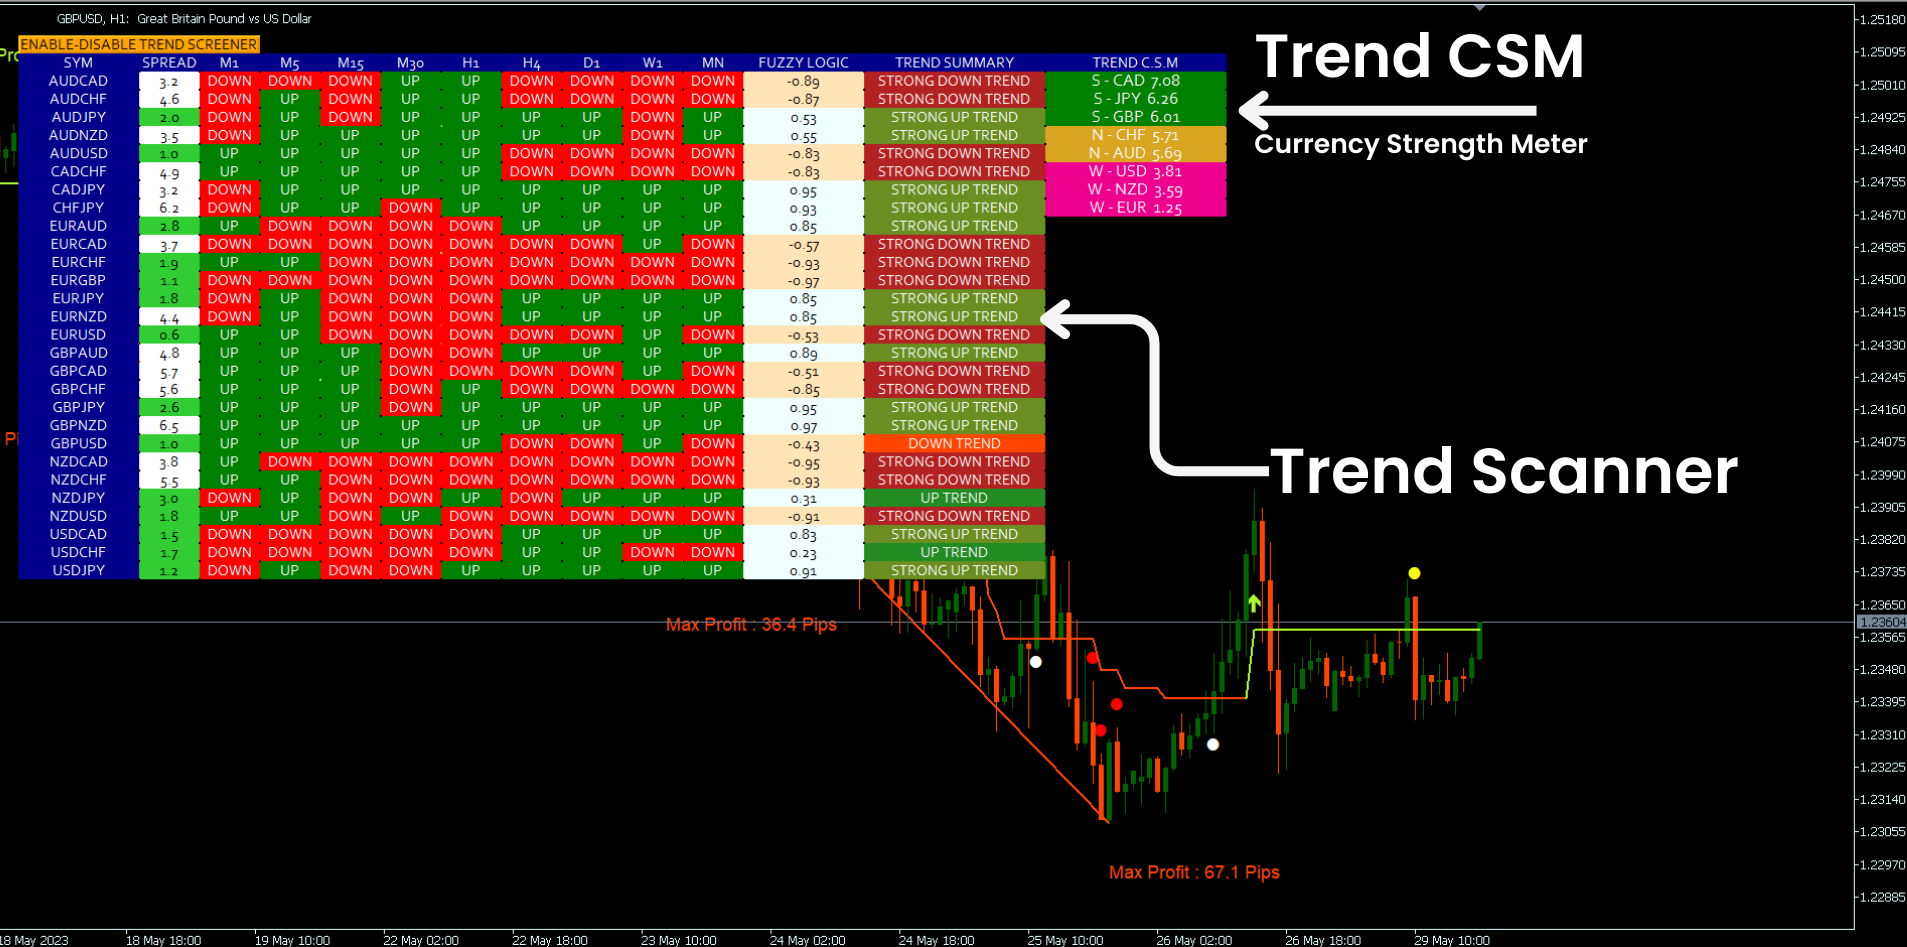
5. 基于趋势的货币强弱工具:衡量货币随时间的相对强弱程度的工具。 它通过分析价格变动和识别货币对的趋势来实现这一点。 然后,该指标根据每种货币在这些趋势中的表现为其分配强度值。
6. Trend CSM 的测距对查找器:一种将测距对的识别与 Trend CSM 工具的应用相结合的技术。 这种方法可能会帮助交易者识别处于盘整阶段的区间货币对。
7. Trending CSM 的趋势对查找器:一种将大多数趋势对的识别与 Trend CSM 工具的应用相结合的技术。 这种方法可能会帮助交易者识别大多数趋势货币对。
8. 多时间范围趋势扫描工具:识别多个时间范围趋势的工具。 这对于想要识别可能长期持续的趋势的交易者来说可能很有帮助。
9. 多货币趋势扫描工具:帮助交易者同时识别多种货币趋势的工具。 它可用于识别货币对、主要货币和交叉货币对的趋势。
10. 基于模糊逻辑 趋势总结:模糊逻辑是一种处理不精确和不确定信息的非传统逻辑。 它基于这样的理念:真理有不同程度,而不仅仅是真与假。 这使得它非常适合分析金融市场的趋势,而金融市场的特点往往是不确定性和噪音。
11. 图表更换工具:使用扫描仪中的按钮在对之间切换的工具。
12. 多货币价差扫描仪工具:通过指标扫描仪监控所有货币对价差的工具。
13. 使用智能趋势线进行动态支撑和阻力检测:一种帮助交易者根据价格行为和图表中的趋势线识别短期支撑和阻力的技术。
14. 基于自定义 TP 的剥头皮模拟器:一种根据之前的价格走势模拟自定义止盈 (TP) 水平并确定剥头皮的最佳 TP 的工具。
15. 支持所有市场:外汇、指数、金属、加密货币...等。
文档
所有趋势筛选器文档(说明)和策略详细信息均可在我们的 MQL5 博客的这篇文章中找到:点击此处
YouTube 视频教程
通过查看我们的 MQL5 博客,您会发现许多 YouTube 视频教程,其中我们解释了如何使用趋势筛选指标以及如何使用趋势筛选指标进行交易。 单击此处查找所有视频。
趋势筛选器MT4版本
MT4 版本可在此处获取,请点击此处。
接触
如果您有任何疑问或需要帮助,请通过私人消息与我联系。
作者
SAYADI ACHREF,金融科技软件工程师和 Finansya 创始人。


I would recommend it to anyone starting trading. It has made 80% my initial deposit in just two days both on demo and real accounts. The function of scalper simulator is really helpful, you can set your own takeprofit. first i was making losses because of trading on low timeframes. to be profitable I don't recommend to use timeframe below 1H Sayadi is wonderful with support!