Trend Screener Pro MT5
- Indikatoren
- STE S.S.COMPANY
- Version: 20.20
- Aktualisiert: 22 Januar 2024
- Aktivierungen: 10
Nutzen Sie die Macht des Trendhandels mit Trend Screener Indicator: Ihrer ultimativen Trendhandelslösung, die auf Fuzzy-Logik und einem System mit mehreren Währungen basiert!
Steigern Sie Ihren Trendhandel mit Trend Screener, dem revolutionären Trendindikator mit Fuzzy-Logik. Es handelt sich um einen leistungsstarken Trendfolgeindikator, der über 13 Premium-Tools und -Funktionen sowie 3 Handelsstrategien kombiniert und ihn zu einer vielseitigen Wahl macht, um Ihren Metatrader in einen Trendanalysator zu verwandeln.
ZEITLICH BEGRENZTES ANGEBOT: Der Trend Screener Indicator ist für nur 50 $ und lebenslang erhältlich. (Originalpreis 125$) (Angebot verlängert)
Erleben Sie die unerschütterliche Präzision der 100 %igen Genauigkeit von Trend Screener, die gewährleistet, dass Ihre Handelsentscheidungen von vergangenen Preisänderungen unbeeinflusst bleiben. Nutzen Sie die Vielseitigkeit der Multi-Timeframe- und Multi-Währungsfunktionen, die es Ihnen ermöglichen, mit beispiellosem Vertrauen in der Welt der Devisen, Rohstoffe, Kryptowährungen und Indizes zu handeln. Verbessern Sie Ihren Handel mit dem umfassenden Strategiepaket von Trend Screener:
- Trendfolgestrategie und Trendfortsetzungsstrategie: Die Trendfolgestrategie von Trend Screener liefert klare Trendfortsetzungssignale, sodass Sie Trendbewegungen effektiv erfassen und Ihr Risiko verwalten können.
- Umkehrstrategie und Strategie für frühe Einstiegspunkte: Die Umkehrstrategie von Trend Screener erkennt potenzielle Veränderungen in der Marktrichtung, sodass Sie Trendumkehrungen antizipieren und von schwachen Markttrends profitieren können. Mit frühen Einstiegspunkten können Sie sich möglicherweise vor möglichen Trendänderungen positionieren erhebliche Gewinne erzielen.
- Scalping-Strategie: Die Scalping-Strategie von Trend Screener ist für schnelles Daytrading und kurzfristige Trades konzipiert und ermöglicht es Ihnen, von kleinen Preisbewegungen innerhalb eines einzigen Handelstages zu profitieren.
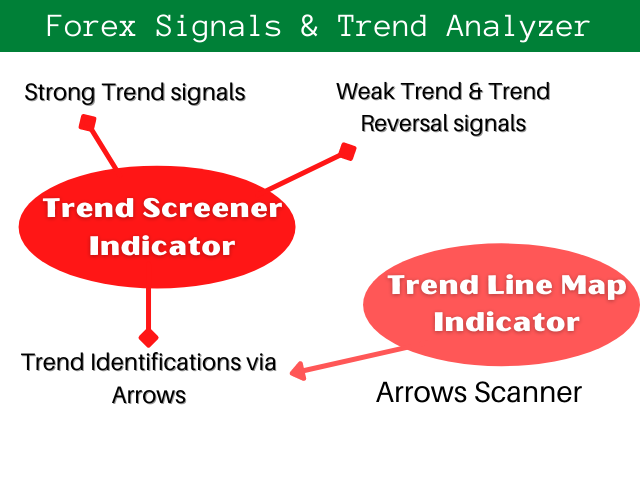
Trendsystem
Unser Trendsystem besteht aus 2 Indikatoren:
- Trend-Screener-Indikator: Anzeige des Trend-Dashboards, der Trendlinie im Diagramm, der Einstiegspunkte und aller Hauptfunktionen.
- Trendlinien-Kartenanzeige: Zeigen Sie Kauf und Verkauf als Dashboard an, generieren Sie Alarme für mehrere Währungen und zeigen Sie die aktiven Gewinn-/Verlustsignale usw. an.
Laden Sie den Trendlinien-Kartenindikator herunter
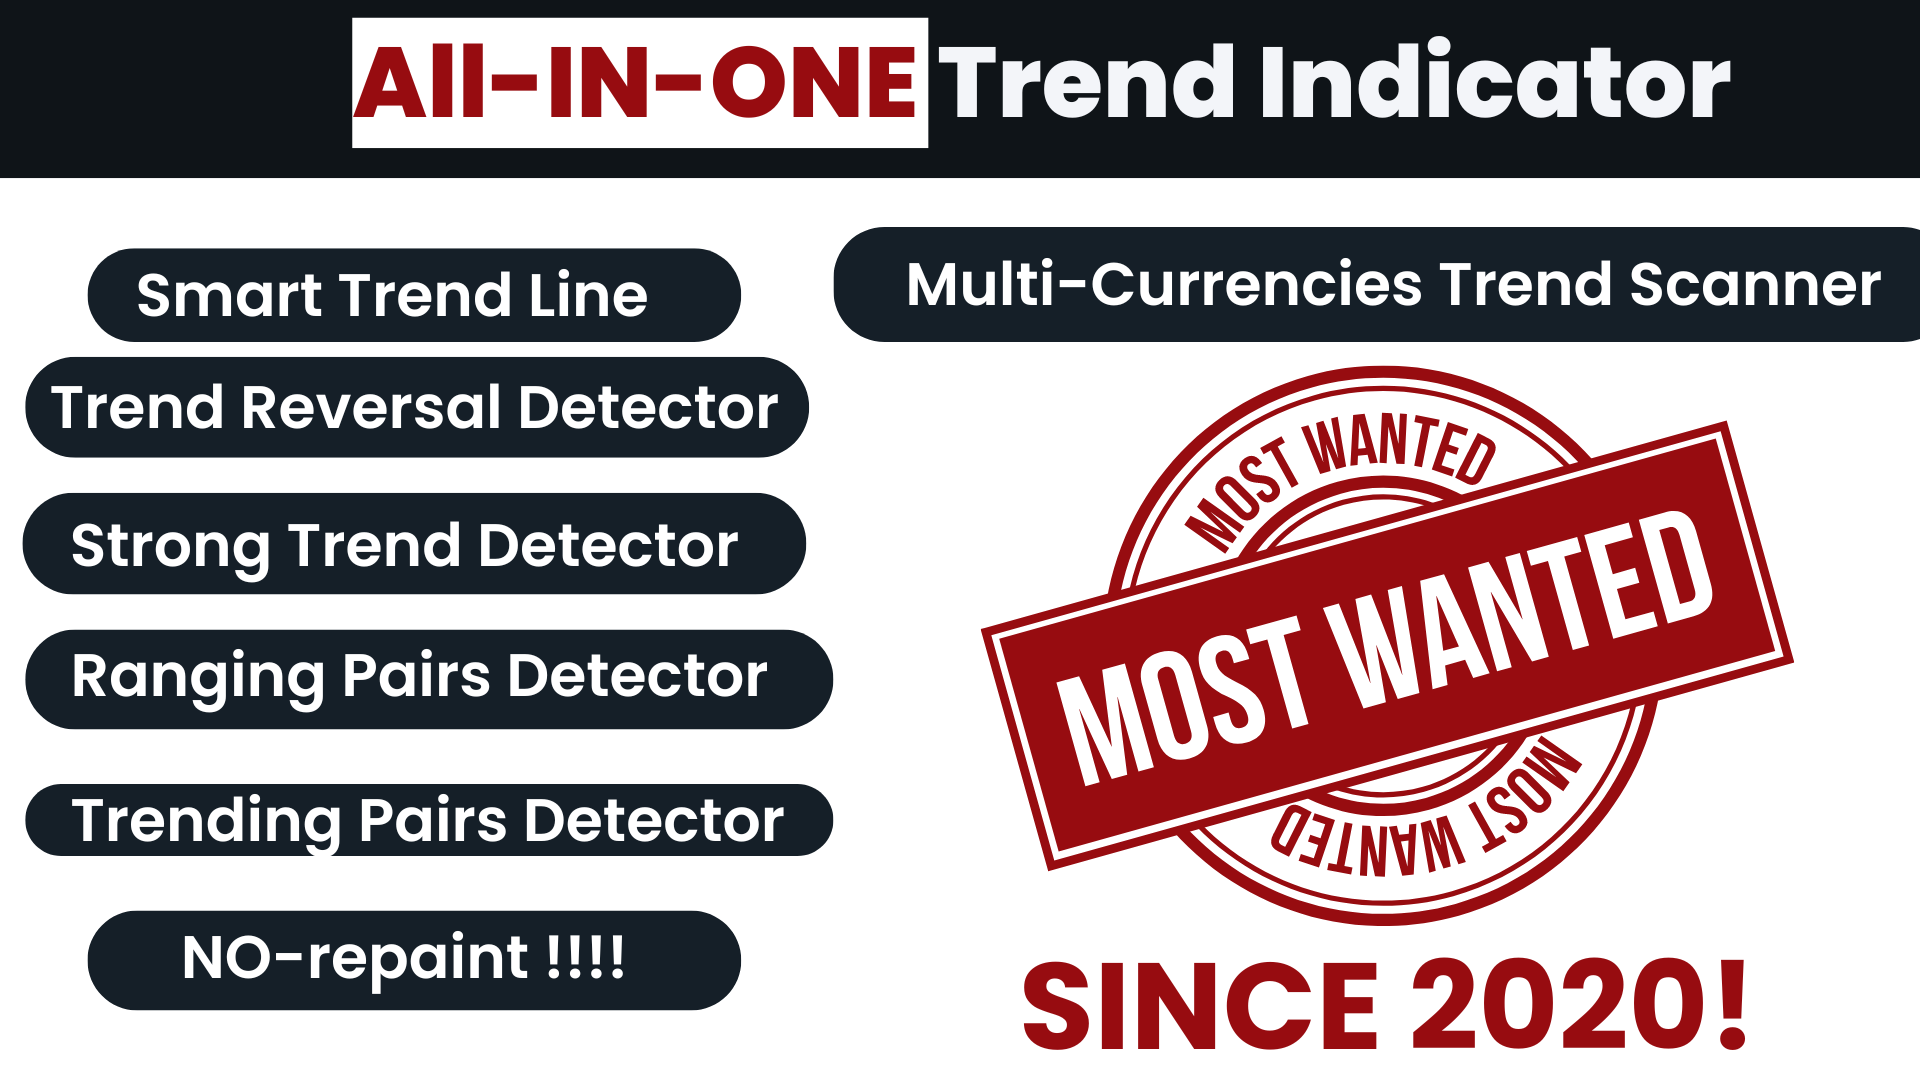
Premium-Tools und -Funktionen
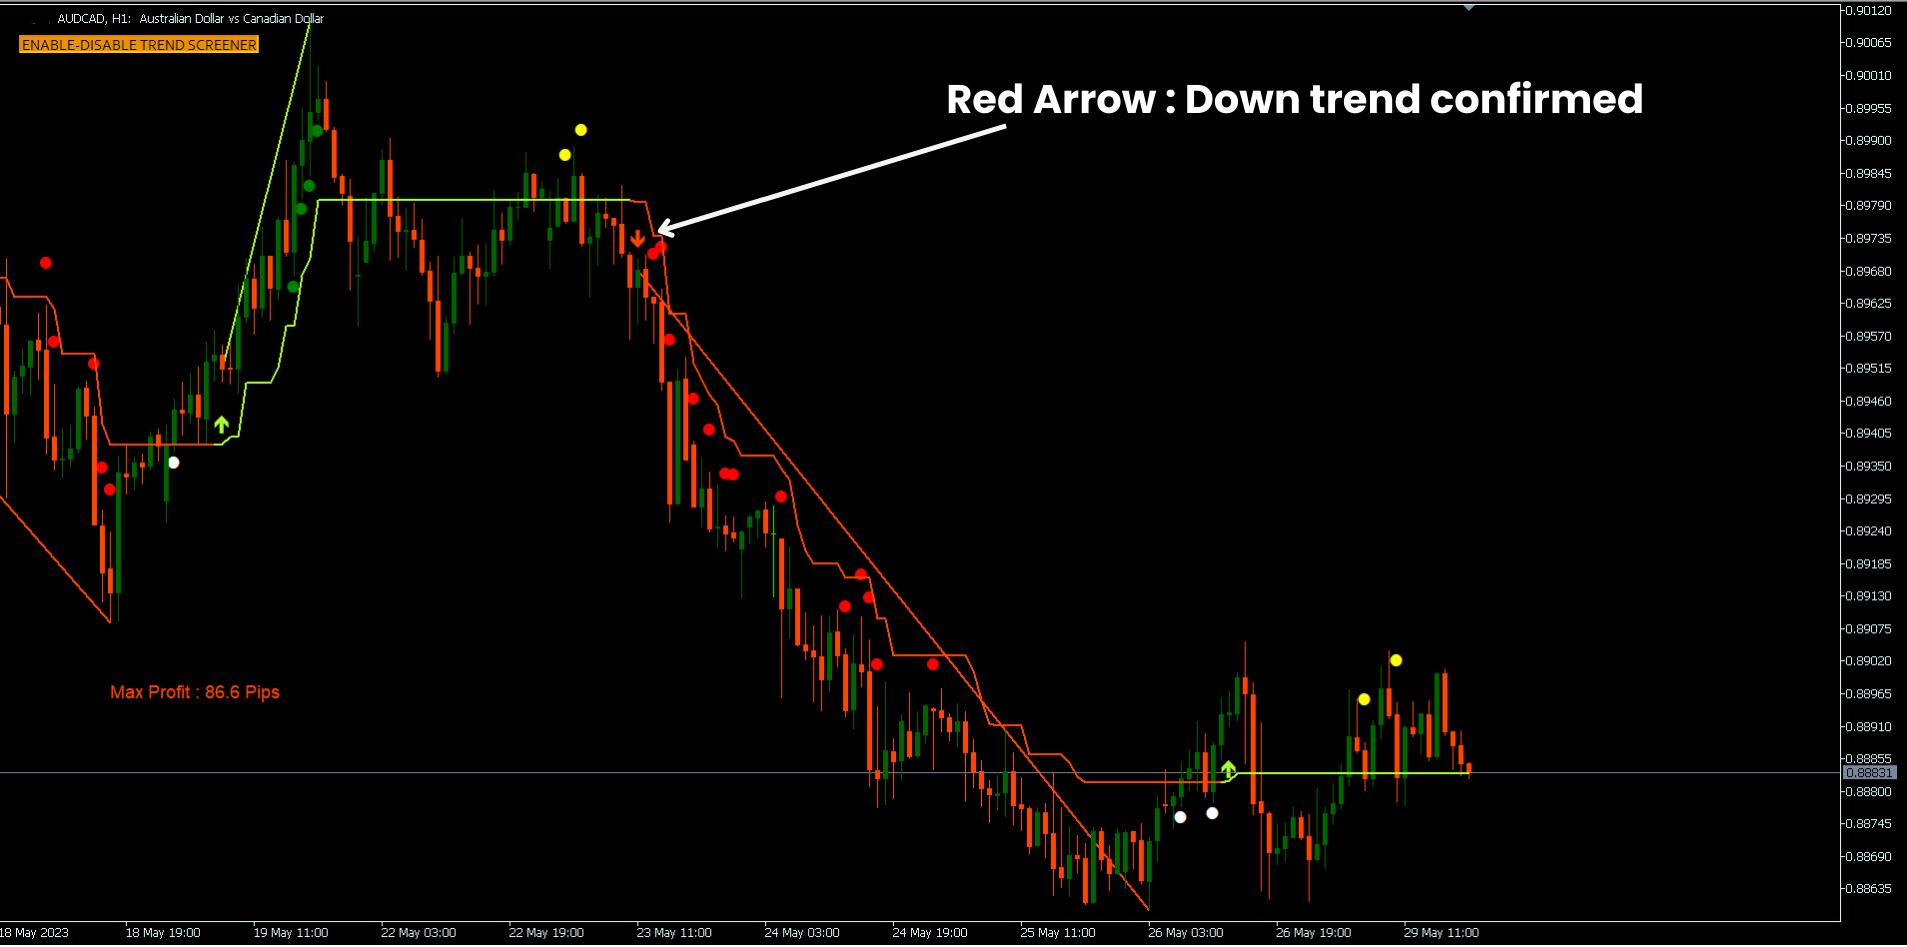
1. Intelligentes Trendlinien-Tool: Dynamisch angepasst an die aktuellen Marktbedingungen. Sie ist komplexer als eine statische Trendlinie und kann zur genaueren Identifizierung potenzieller Trendänderungen verwendet werden. Visualisieren Sie den vorherrschenden Trend mit einer sich dynamisch anpassenden Trendlinie.
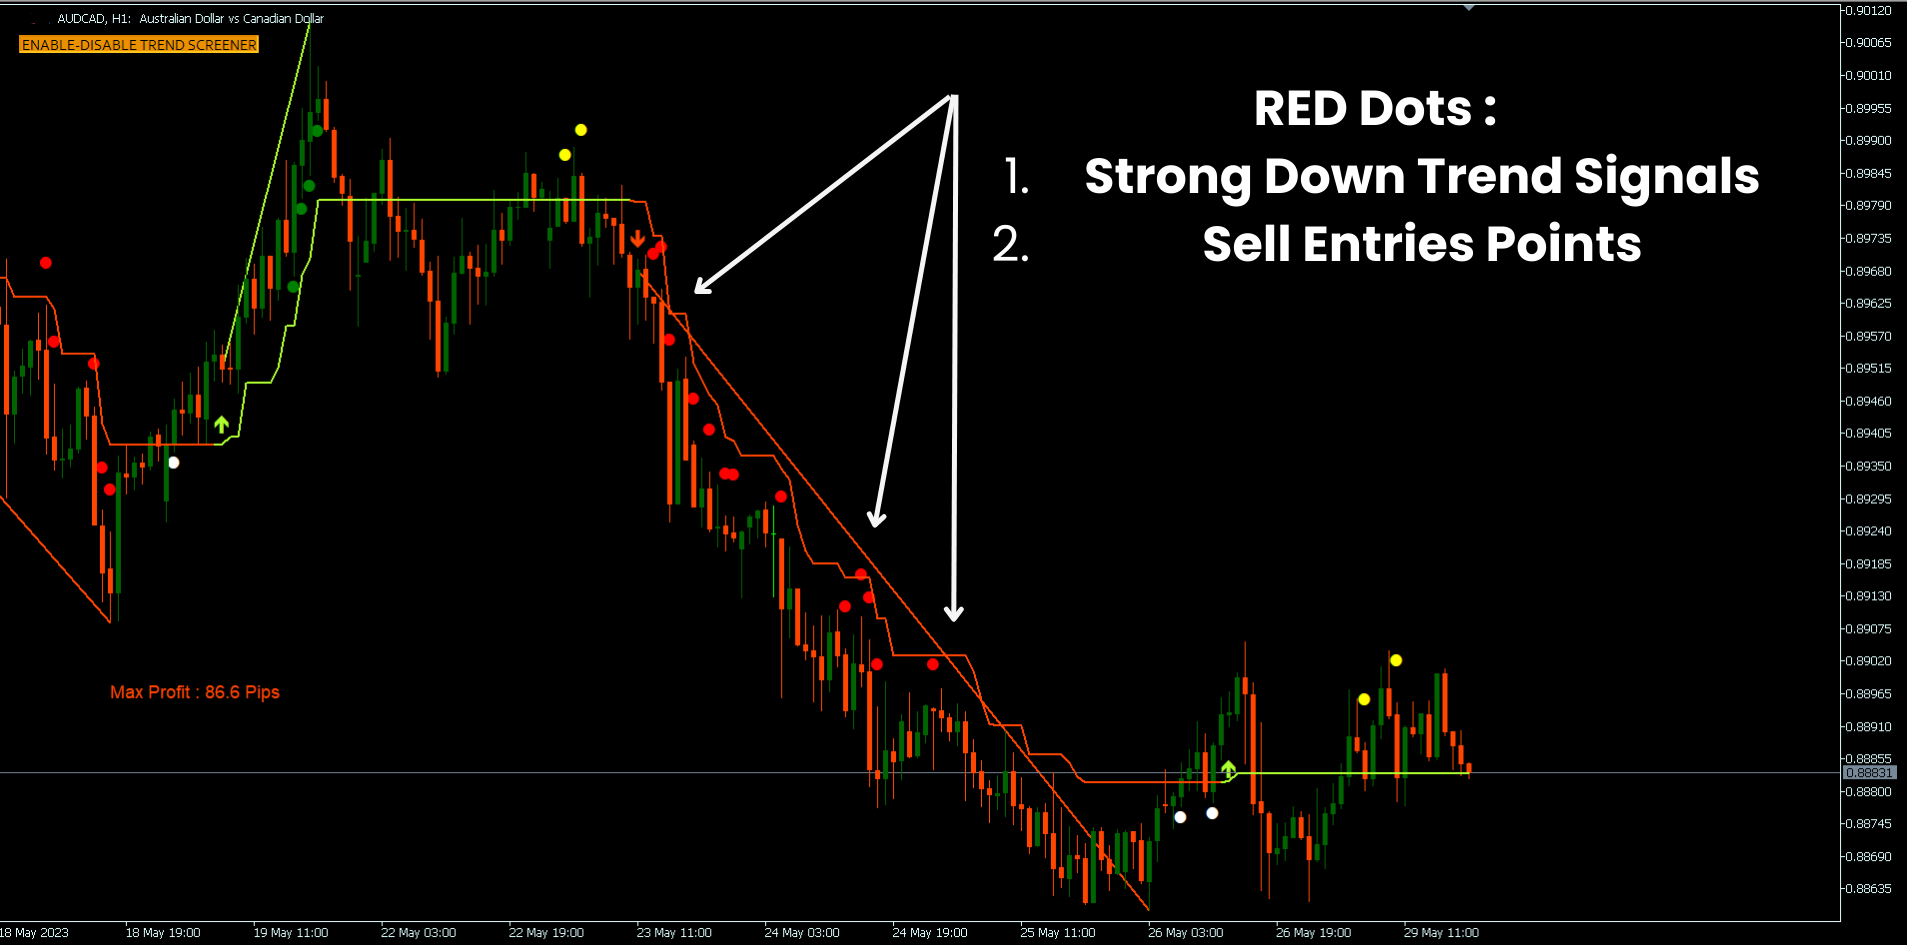
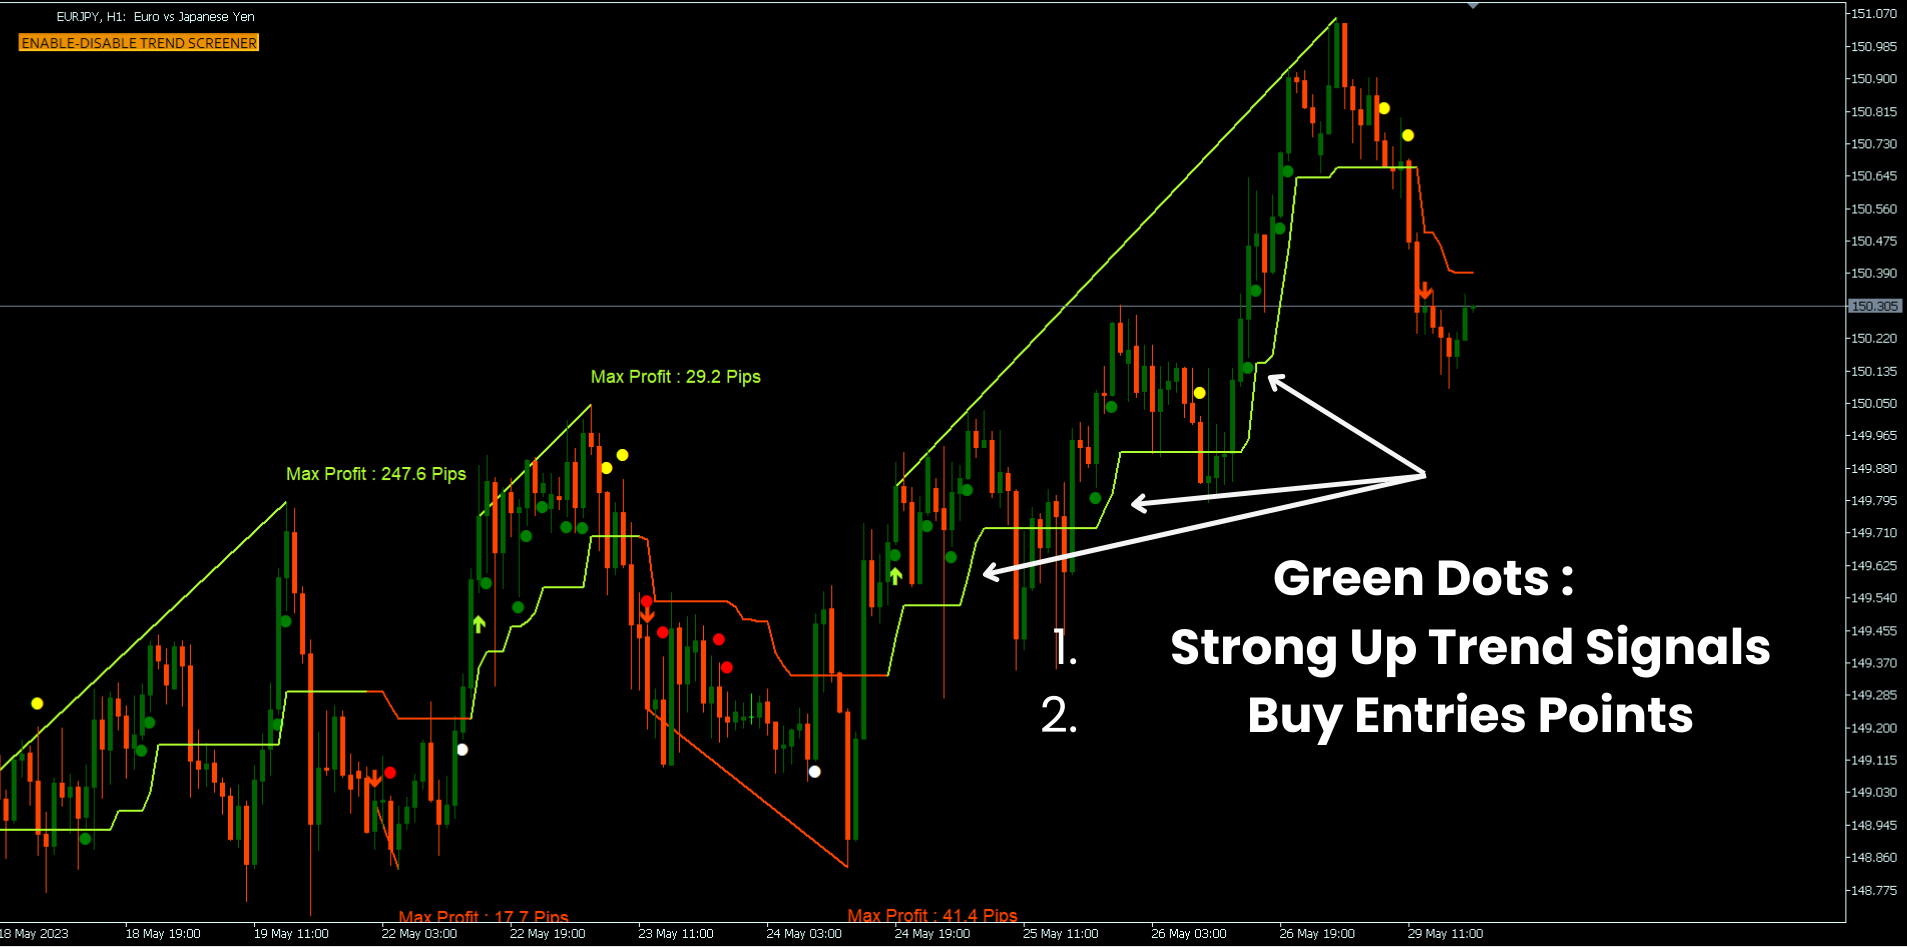
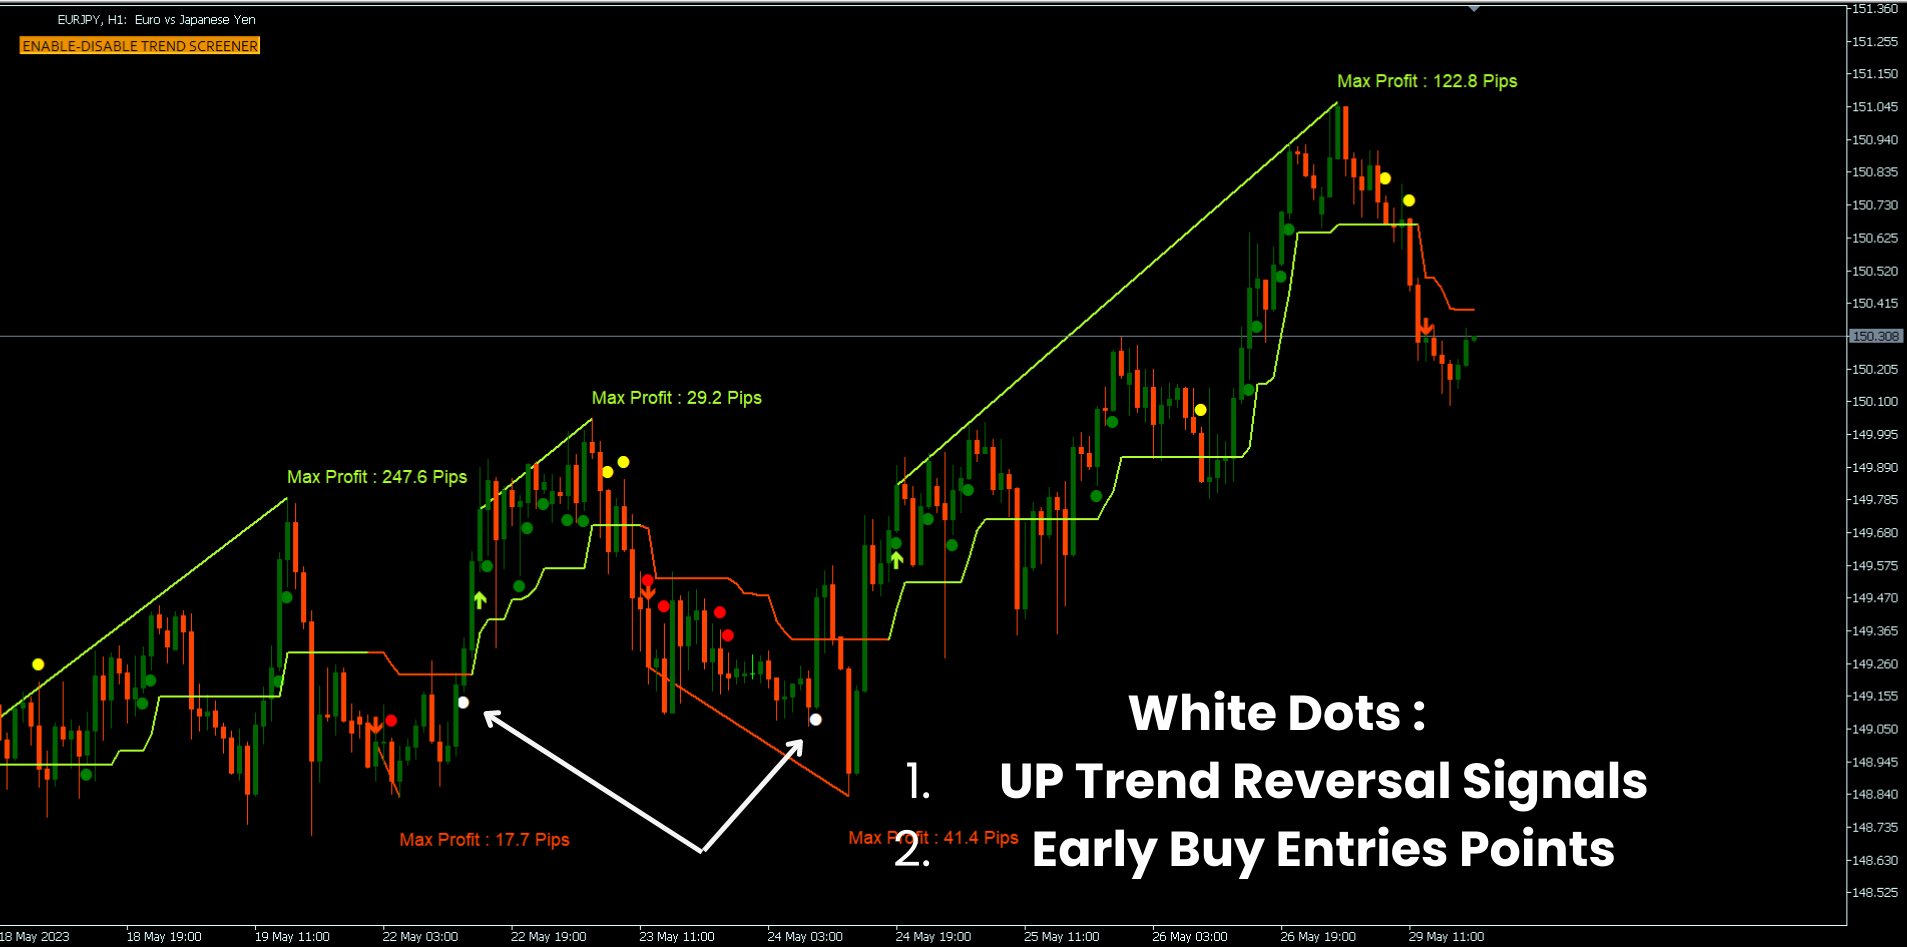
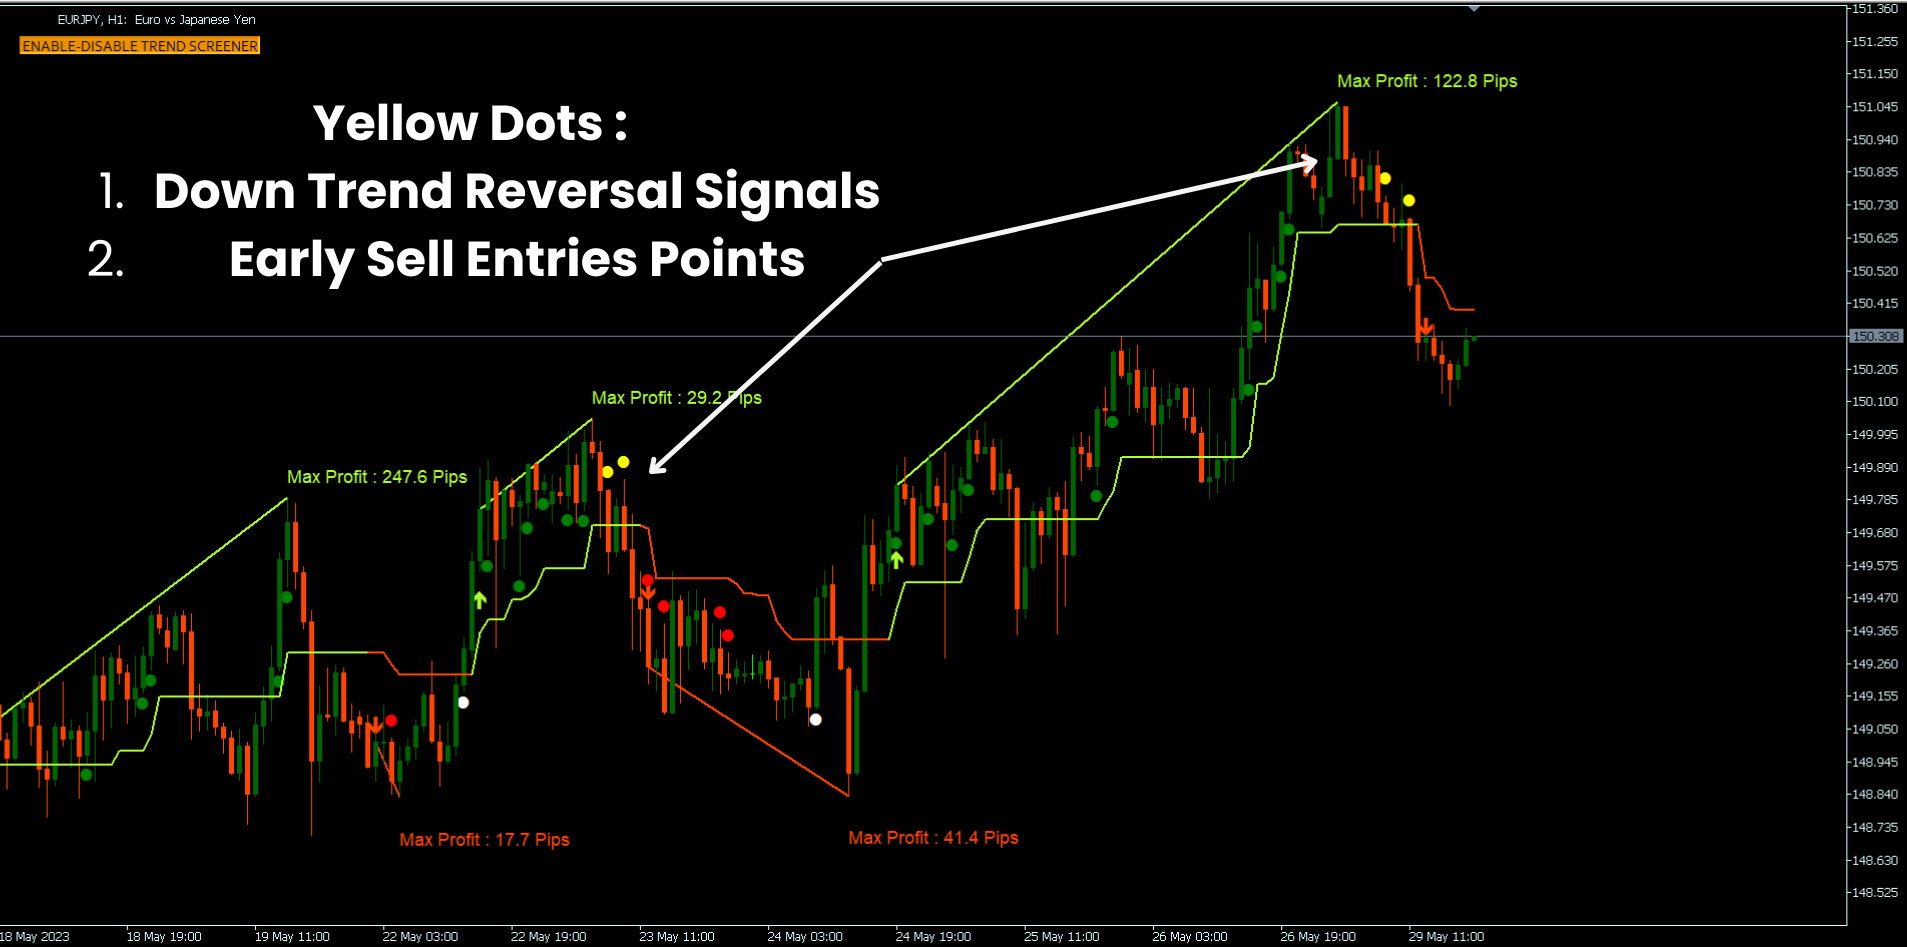
2. Trendumkehr-Tool mit Umkehrpunkten: Ein Tool, das Händlern hilft, potenzielle Änderungen zu erkennen. Umkehrpunkte sind eine Art Indikator, der kleine Punkte verwendet, um potenzielle Wendepunkte im Markt und schwache Trendperioden zu markieren.
3. Trend-Momentum-Tool mit starken Trendpunkten: Ein Tool, das Händlern hilft, starke Trends auf dem Markt zu erkennen und zu bestätigen. Es funktioniert, indem es Perioden starker Preisbewegungen identifiziert und diese mit Punkten auf einem Preisdiagramm markiert.
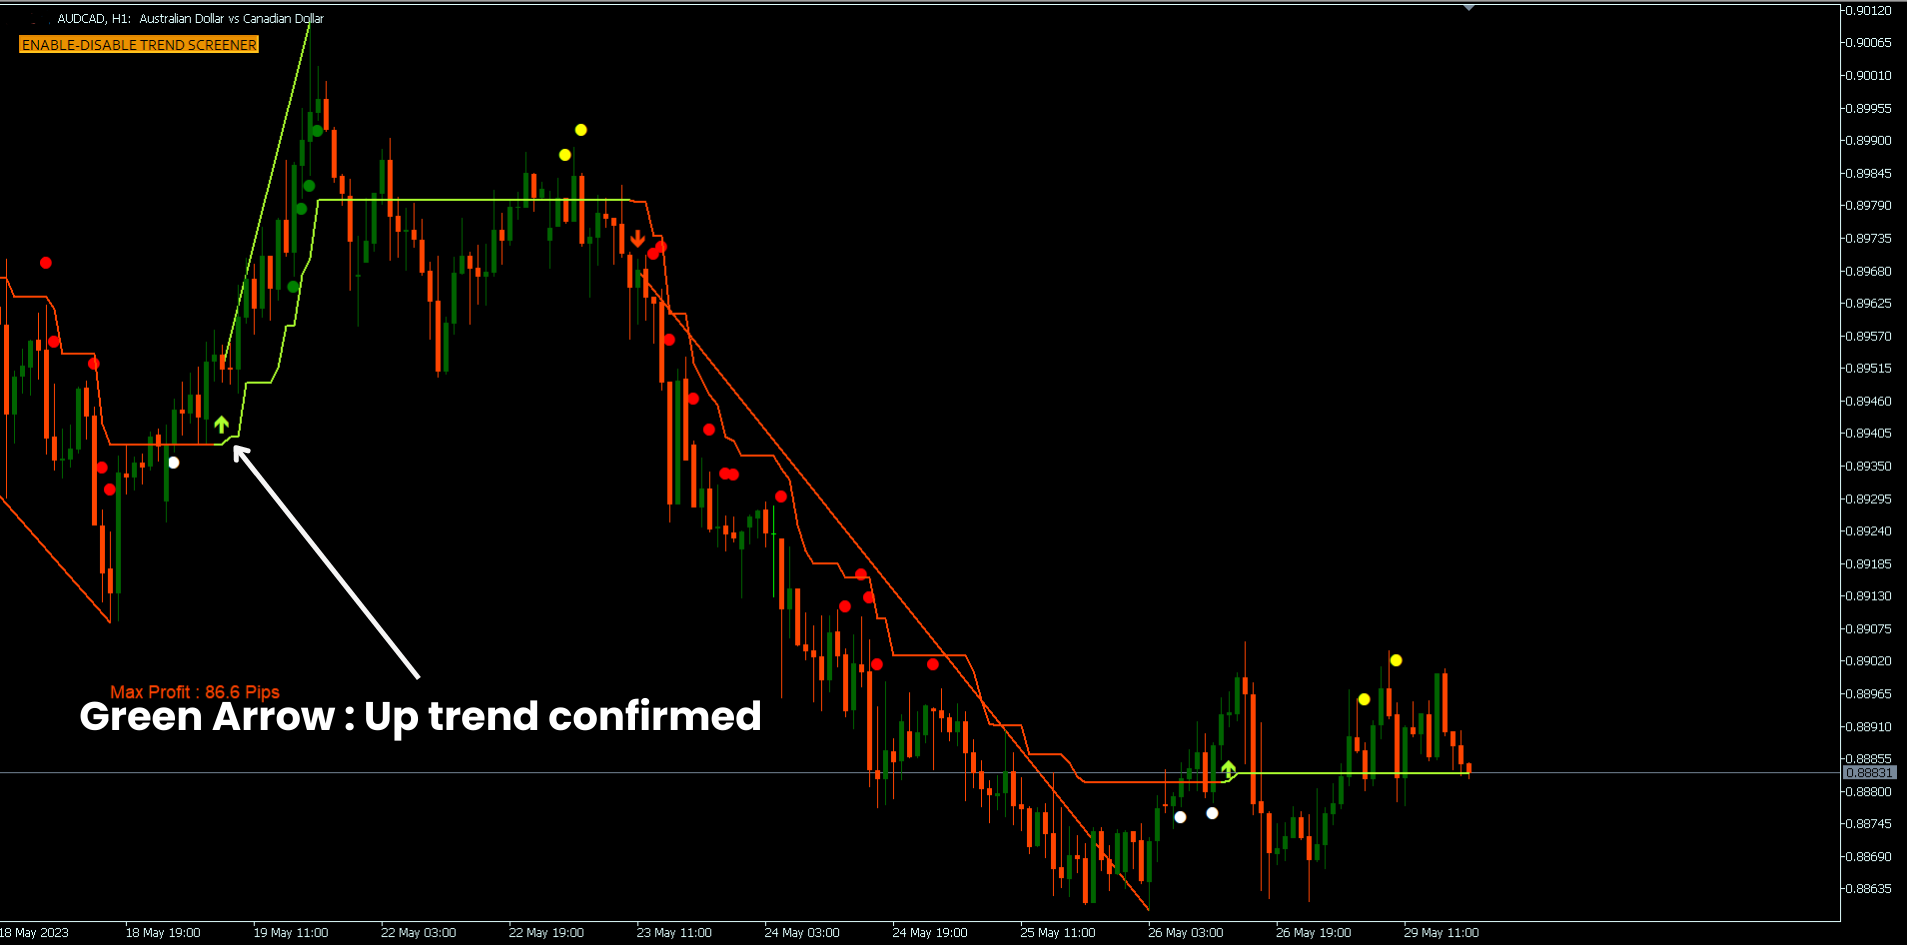
4. Trendbestätigungstool mithilfe von Pfeilen: Ein Tool, das Händlern hilft, die Fortsetzung bestehender Trends zu erkennen und zu bestätigen. Dabei werden Pfeile auf einem Preisdiagramm generiert, um potenzielle Trendfortsetzungspunkte zu signalisieren.
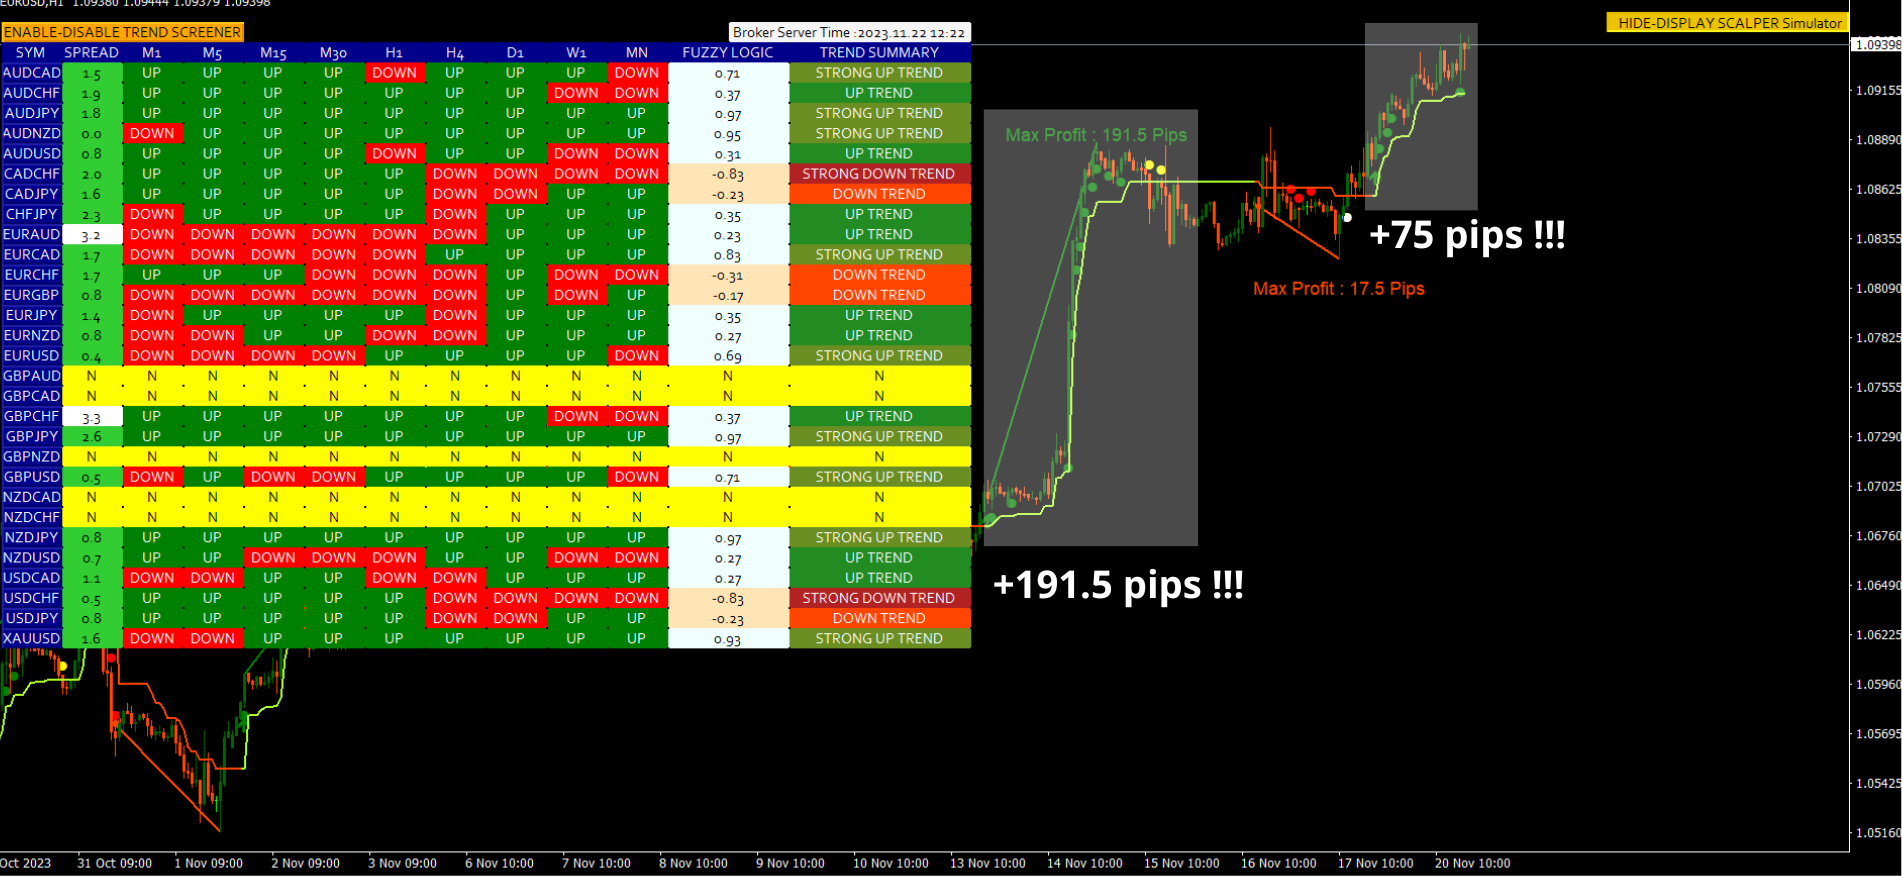
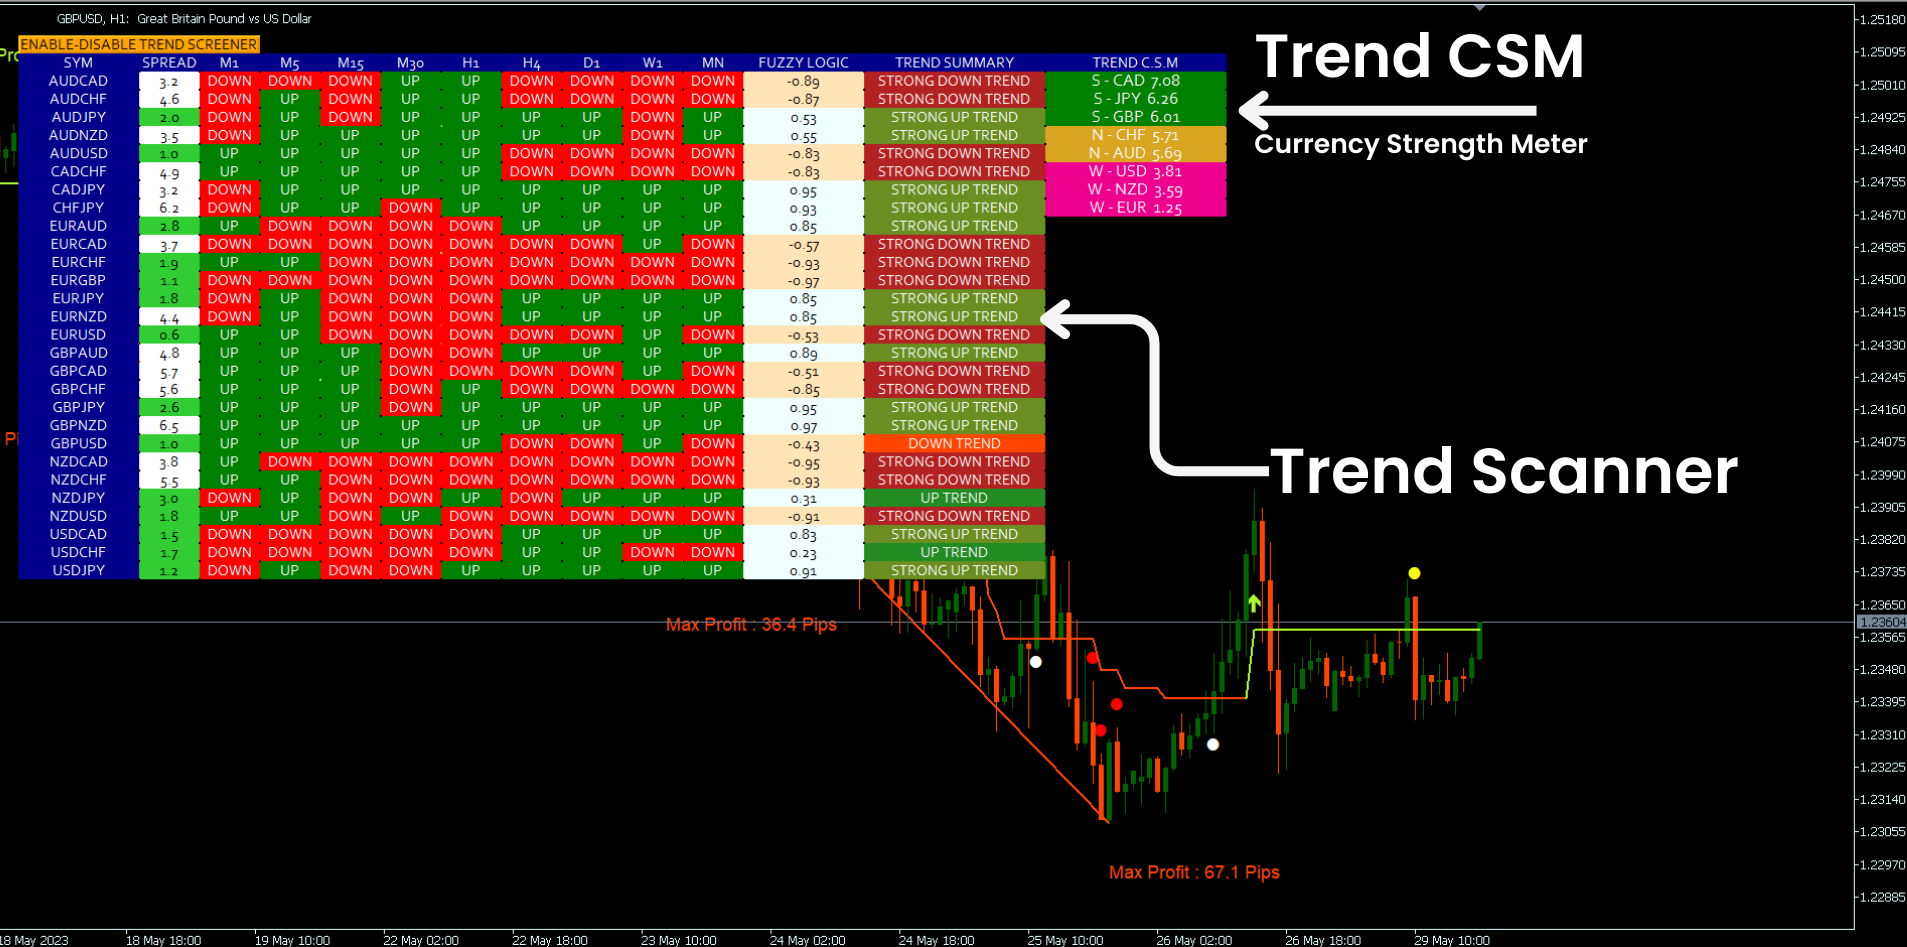
5. Trendbasiertes Währungsstärke-Tool: Ein Tool, das die relative Stärke oder Schwäche von Währungen im Zeitverlauf misst. Dies geschieht durch die Analyse von Preisbewegungen und die Identifizierung von Trends bei Währungspaaren. Der Indikator weist dann jeder Währung basierend auf ihrer Leistung in diesen Trends einen Stärkewert zu.
6. Ranging Pairs Finder von Trend CSM: eine Technik, die die Identifizierung von Ranging-Paaren mit der Anwendung des Trend CSM-Tools kombiniert. Dieser Ansatz könnte Händlern möglicherweise dabei helfen, Ranging-Paare zu identifizieren, die sich in der Konsolidierungsphase befinden.
7. Trending Pairs Finder von Trend CSM: eine Technik, die die Identifizierung der meisten Trendpaare mit der Anwendung des Trend CSM-Tools kombiniert. Dieser Ansatz könnte Händlern möglicherweise dabei helfen, die meisten Trendpaare zu identifizieren.
8. Multi-Timeframe-Trendscanner-Tool: Ein Tool, das Trends über mehrere Zeitrahmen hinweg identifiziert. Dies kann für Händler hilfreich sein, die Trends identifizieren möchten, die wahrscheinlich langfristig anhalten.
9. Trendscanner-Tool für mehrere Währungen: Ein Tool, das Händlern hilft, Trends in mehreren Währungen gleichzeitig zu erkennen. Es kann verwendet werden, um Trends bei Währungspaaren, Hauptwährungen und Währungspaaren zu identifizieren.
10. Fuzzy-Logik-basierte Trendzusammenfassung: Fuzzy-Logik ist eine Art nicht-traditioneller Logik, die sich mit ungenauen und unsicheren Informationen befasst. Es basiert auf der Idee, dass es Wahrheitsgrade gibt und nicht nur wahr und falsch. Dadurch eignet es sich gut für die Analyse von Trends auf den Finanzmärkten, die oft von Unsicherheit und Unruhe geprägt sind.
11. Kartenwechsler-Tool: Ein Tool zum Wechseln zwischen Paaren mithilfe der Taste im Scanner.
12. Multi-Währungs-Spread-Scanner-Tool: Ein Tool zur Überwachung aller Paare, die über den Indikator-Scanner verteilt sind.
13. Dynamische Unterstützungs- und Widerstandserkennung mithilfe der Smart Trend Line: eine Technik, die Händlern hilft, kurzfristige Unterstützungs- und Widerstandsniveaus auf der Grundlage von Preisbewegungen und der Trendlinie im Diagramm zu identifizieren.
14. Scalper-Simulator basierend auf benutzerdefinierten TP: Ein Tool zur Simulation benutzerdefinierter Take-Profit-Niveaus (TP) basierend auf früheren Preisbewegungen und zur Identifizierung der optimalsten TPs für das Scalping.
15. Unterstützung aller Märkte: Forex, Indizes, Metalle, Kryptowährungen usw.
Dokumentationen
Alle Trend-Screener-Dokumentationen (Anleitungen) und Strategiedetails finden Sie in diesem Beitrag in unserem MQL5-Blog: Klicken Sie hier
Youtube-Video-Tutorials
In unserem MQL5-Blog finden Sie viele YouTube-Video-Tutorials, in denen wir erklären, wie Sie den Trend Screener Indicator verwenden und mit ihm handeln. Klicken Sie hier, um alle Videos zu finden.
Trend Screener MT4-Version
Die MT4-Version ist hier verfügbar, klicken Sie hier.
Kontakt
Wenn Sie Fragen haben oder Hilfe benötigen, kontaktieren Sie mich per Privatnachricht.
Autor
SAYADI ACHREF, Fintech-Softwareentwickler und Gründer von Finansya.


The indicator offers clear signals and a user-friendly interface, making it very effective for identifying trend exits and take-profit levels across most timeframes and symbols via its highly useful panel.