• 概述
  • 评论 (97)
  • 评论 (267)
  • 新特性

Trend Screener

4.8

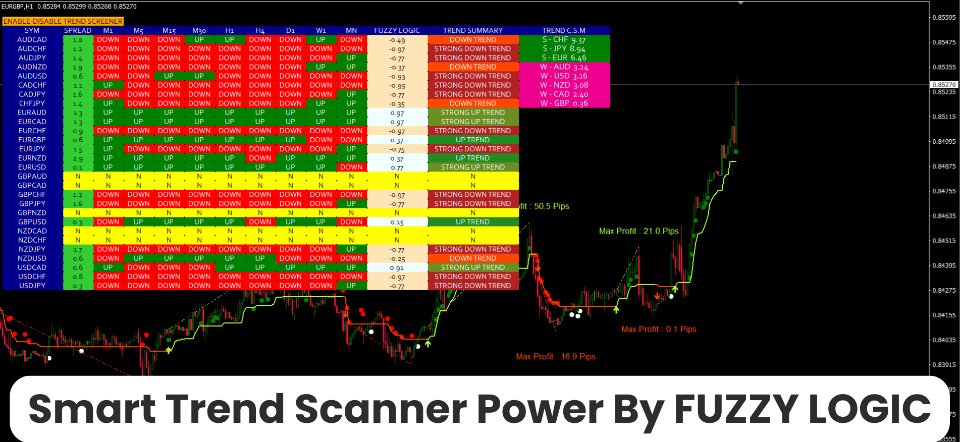
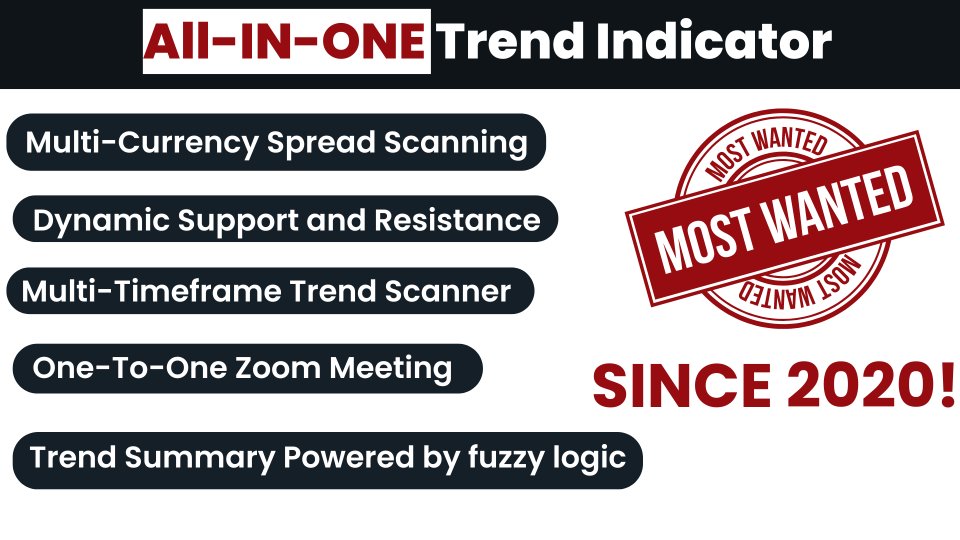
趋势指标,趋势交易和过滤的突破性独特解决方案,所有重要趋势功能都内置在一个工具中! 它是 100% 非重绘多时间框架和多货币指标,可用于所有符号/工具:外汇、商品、加密货币、指数、股票。

限时优惠:支撑和阻力筛选指标仅售 50美元,终身有效。(原价 250 美元)(优惠延长)

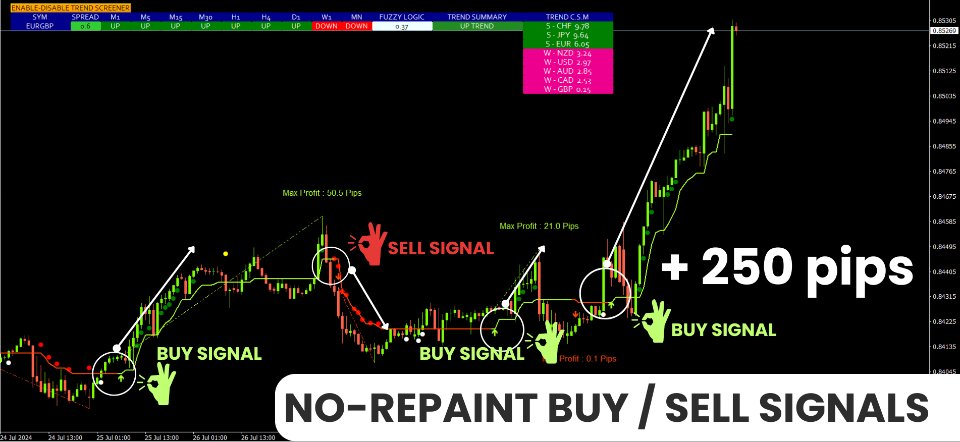
趋势筛选器是有效的指标趋势跟踪指标,它在图表中提供带有点的箭头趋势信号。 趋势分析器指标中可用的功能:

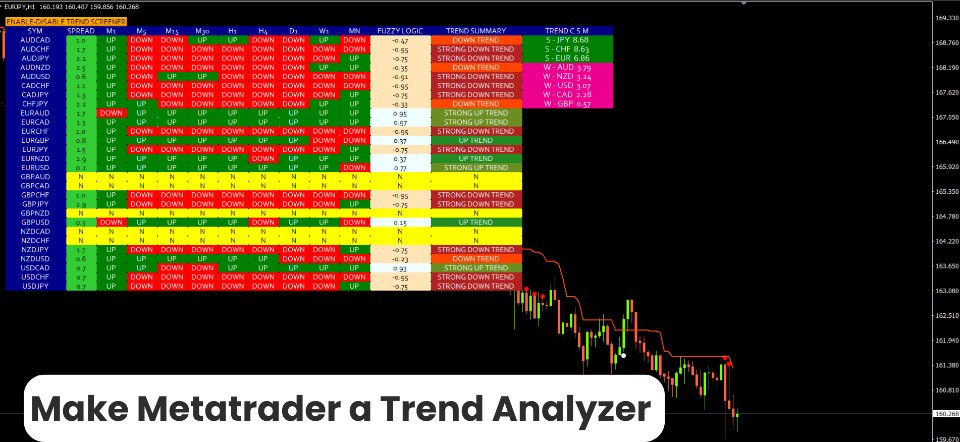
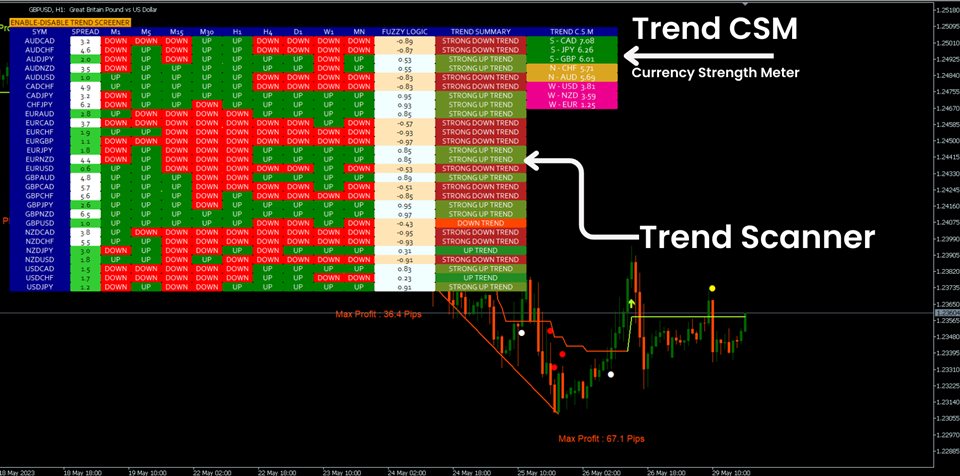
1.趋势扫描仪。

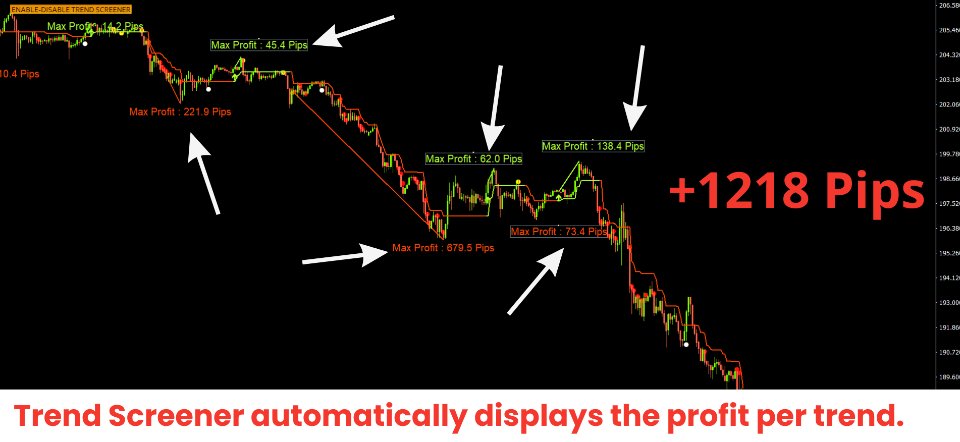
2. 具有最大利润分析的趋势线。

3.趋势货币强度计。

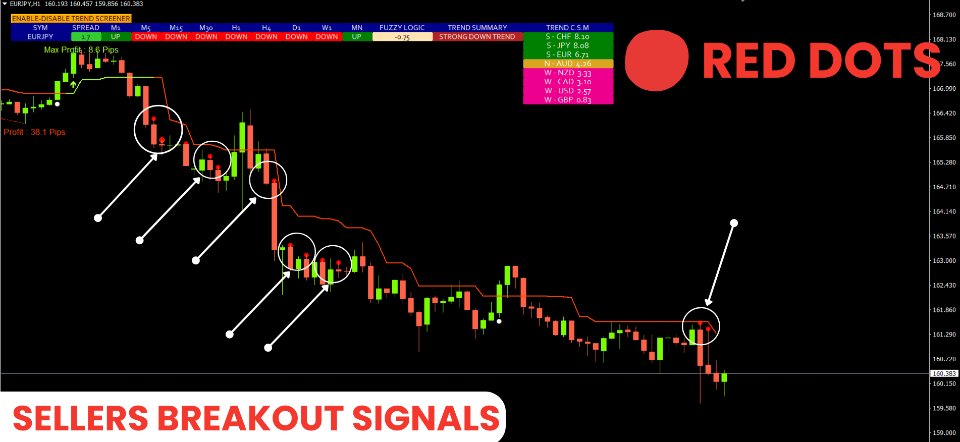
4. 带有警报的趋势反转点。

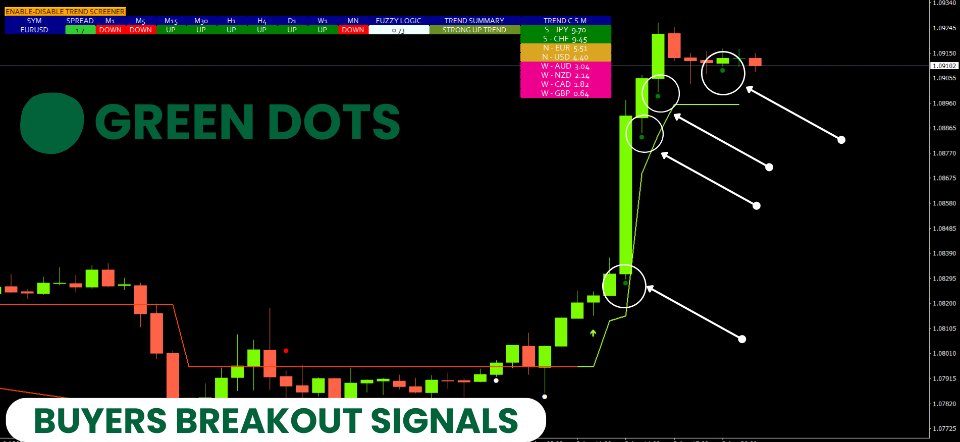
5. 带有警报的强趋势点。

6. 趋势箭头

每日分析示例,每日信号表现...等与我们的趋势筛选指标,可以在这里找到:点击这里


限时优惠:Trend Screener Indicator 仅售 50 美元且终身可用。原价 125$)

通过访问我们的 MQL5 博客,您可以找到我们所有的高级指标以及分析示例、每日信号表现...等。 : 点击这里

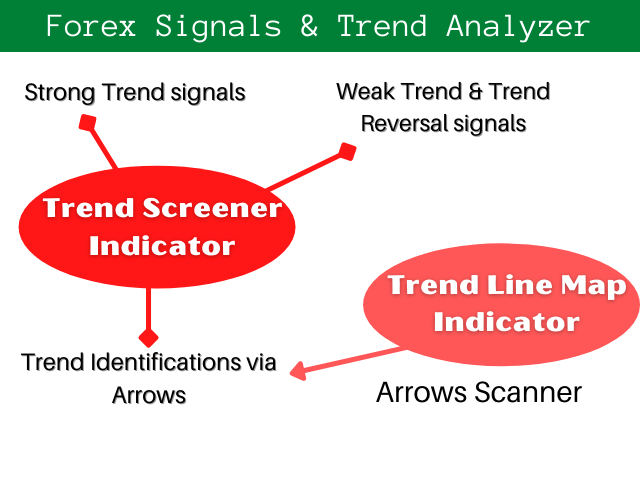
我们的趋势系统由 2 个指标组成:

1. Trend Screener Indicator:显示趋势仪表盘、图表中的趋势线、入场点...等。

2. Trend Line Map Indicator:显示买卖作为仪表板,活动信号盈利/亏损...等。

        下载趋势线图指标


Youtube 视频教程:

通过查看我们的 MQL5 博客,您会发现许多 youtube 视频教程,我们在其中解释了如何使用 Trend Screener Indicator 以及如何进行交易。 单击此处查找所有视频。


主要特点

  • 趋势强度分析器。
  • 多时间框架和多货币趋势分析器。
  • 趋势仪表板
  • 趋势反转信号。 (点信号)
  • 强烈的趋势信号。 (点信号)
  • 趋势线


文件(说明)

所有趋势筛选器文档(说明)和策略详细信息均可在我们 MQL5 博客的这篇文章中找到:单击此处。


接触

如果您有任何问题或需要帮助,请通过私信与我联系。


作者

SAYADI ACHREF,金融科技软件工程师,Finansya 创始人。


评论 20
Matthew Nathan Brooks
199
Matthew Nathan Brooks 2024.09.04 19:24 
 

This is an amazing indicator. ive used it for 2 weeks on a demo on Gold and the results have been amazing. it took a couple days to get the setting right. but since then its been the best, will try on a demo for another 2 weeks. having a small issue with notification not coming to my phone all the time but thats not a big deal for me..

waqarqureshi1
57
waqarqureshi1 2024.08.05 14:25 
 

Amazing

Nagib Mahfuj Nayem
37
Nagib Mahfuj Nayem 2024.08.02 18:27 
 

This is really Insane. I just used only one week but more than 500 pips made with this indicator with only GOLD. And his support is really top notch. 100% Recommended.

推荐产品
Trend Line Map Pro
STE S.S.COMPANY
4.47 (15)
趋势线图指标是趋势筛选器指标的插件。它用作趋势筛选器(趋势线信号)生成的所有信号的扫描仪。 它是基于趋势筛选器指标的趋势线扫描仪。如果您没有 Trend Screener Pro Indicator ,Trend Line Map Pro 将无法使用。 通过访问我们的 MQL5 博客,您可以下载趋势线图指标的免费版本。购买前试用,不受 Metatrader Tester 限制。 :    点击这里 1. 容易获得的优势 根据货币和时间范围显示买入和卖出信号。 评估自图表中出现箭头以来价格上涨或下跌的点数。 (趋势筛选指标箭头) 显示信号的时序。 获取多时间范围和多货币警报以购买和出售警报。 2. 如何使用趋势线图 如何显示买卖信号仪表板? 如果您有任何问题或需要帮助,请通过私信联系我。 作者 SAYADI ACHREF,金融科技软件工程师,Finansya 创始人。
Quantum Heiken Ashi PRO MT4
Bogdan Ion Puscasu
4.33 (6)
介绍     Quantum Heiken Ashi PRO 图表 Heiken Ashi 蜡烛旨在提供对市场趋势的清晰洞察,以其过滤噪音和消除虚假信号的能力而闻名。告别令人困惑的价格波动,迎接更流畅、更可靠的图表表示。 Quantum Heiken Ashi PRO 的真正独特之处在于其创新公式,它将传统烛台数据转换为易于阅读的彩色条。红色和绿色条分别优雅地突出了看跌和看涨趋势,让您能够以非凡的精度发现潜在的进入和退出点。 量子 EA 通道:       点击这里 MT5版本:       点击这里 这一卓越的指标具有以下几个关键优势: 增强清晰度:通过平滑价格波动,Heiken Ashi 金条可以更清晰地反映市场趋势,使您更容易识别有利的交易机会。 减少噪音:告别经常导致错误信号的不稳定价格变动。 Quantum Heiken Ashi 指标可过滤噪音,使您能够做出更明智的交易决策 无缝集成:Heiken Ashi 指标专为 MetaTrader 开发,可无缝集成到您的交易平台中。它用户友好、高度可定制,并且与您的其他交易指标和过滤器兼容 无论您是寻求新优势的经验
MT4 的 R 2EMA 颜色指标基于 2 个 EMA 的交叉提供可靠的交易信号。 关键点 当价格交叉并收于两条绿色 EMA 上方时,它会产生买入交易信号。 当价格交叉并收于两条红色 EMA 上方时,它会产生卖出交易信号。 R 2EMA Color Forex 指标使确定何时买卖变得更加容易 当 2 条 EMA 线变为绿色时,出现买入信号。 当 2 条 EMA 线变为红色时,出现卖出信号。 如何与之交易? 一旦两条 EMA 信号线从红色变为绿色,就开始买入交易,现在趋势是积极的。 一旦两条 EMA 信号线从绿色变为红色,就开始卖出交易,现在趋势是负面的。 当图表上出现相反的交易信号时退出交易。 随意使用您自己喜欢的交易方法通过 R 2EMA 颜色指标打开和关闭交易。 规格 交易平台:Metatrader 4 (MT4) 货币对:适用于任何货币对 时间范围:适用于任何时间范围 输入参数:快、慢、模式、价格、信号条、警报消息、警报声音、警报电子邮件、警报移动、颜色设置和样式 指标类型:价格行为
High Pass Filter Candlesticks
Safwan Rushdi Khalil Arekat
This indicator applies the  biquad high pass filter to the price-chart data, and displays the filter output for the OHLC as candlesticks. The candlesticks corresponds to the actual calculations of the filter value  during the formation of each price bar (not from all historical highs lows or closes). The shape of the bars therefore corresponds directly to the shape of each price bar. High pass filters are an underappreciated type of oscillator that are seldom used in technical analysis in the st
FREE
Noize Absorption Index MT4
Ekaterina Saltykova
5 (1)
Noize Absorption Index - is the manual trading system that measures the difference of pressure between bears forces and bulls forces. Green line - is a noize free index that showing curent situation. Zero value of index shows totally choppy/flat market.Values above zero level shows how powerfull bullish wave is and values below zero measures bearish forces.Up arrow appears on bearish market when it's ready to reverse, dn arrow appears on weak bullish market, as a result of reverse expectation. S
这是一个预测蜡烛收盘价的指标。 该指标主要用于 D1 图表。 该指标适用于传统外汇交易和二元期权交易。 该指标可以用作独立的交易系统,也可以作为您现有交易系统的补充。 该指标分析当前蜡烛,计算蜡烛本身内部的某些强度因素,以及前一根蜡烛的参数。 因此,该指标预测市场走势的进一步方向和当前蜡烛的收盘价。 由于这种方法,该指标既适用于短期盘中交易,也适用于中长期交易。 该指标允许您设置指标在分析市场情况期间将产生的潜在信号的数量。 在指标设置中有一个特殊的参数。 此外,该指标可以通过图表上的消息、电子邮件以及推送通知的形式通知新信号。感谢您的关注!交易愉快! 购买后一定要写信给我! 我会给你我的交易指标的建议! 还可以获得奖金!
Super Reversal Pattern
Parfait Mujinga Ndalika
Super Reversal Pattern Indicator Unlock the power of advanced pattern recognition with our Super Reversal Pattern Indicator. Designed for traders seeking precision and reliability, this indicator identifies one of the most effective reversal patterns in technical analysis, offering a significant edge in your trading strategy. Key Features: Non-Repainting Accuracy: Enjoy the confidence of non-repainting technology. Once a Super Reversal Pattern is detected, it remains static, providing consis
Dynamic Forex28 Navigator - The Next Generation Forex Trading Tool CURRENTLY 49% OFF. Dynamic Forex28 Navigator is the evolution of our long-time, popular indicators, combining the power of three into one: Advanced Currency Strength28 Indicator  (695 reviews) + Advanced Currency IMPULSE with ALERT  (520 reviews) + CS28 Combo Signals (recent Bonus) Details about the indicator   https://www.mql5.com/en/blogs/post/758844 What Does The Next-Generation Strength Indicator Offer? Everything you love
MACD Color for GOLD
Chitipat Changsamrit
黄金的 MACD 颜色 用于查看图表的走势和检查将要买入或卖出 看 trand 的颜色很容易看。 红色向下/蓝色向上。 可以在很短的时间内使用它 1. 多头交易:与时间框架 H1 / H4 / 每日一起使用 2.Short Trade : 使用时间框架 M5 / M15 / M 30 / H1 您可以通过查看此指标来了解何时打开或关闭订单 ---------------------------- 黄金的 MACD 颜色 用于查看图表的走势和检查将要买入或卖出 看 trand 的颜色很容易看。 红色向下/蓝色向上。 可以在很短的时间内使用它 1. 多头交易:与时间框架 H1 / H4 / 每日一起使用 2.Short Trade : 使用时间框架 M5 / M15 / M 30 / H1 您可以通过查看此指标来了解何时打开或关闭订单
Classic Fractals indicator for MT4, with additional Trendlines connecting the latest couples of fractals ( fractals are showing highest high, and lowest low on each period) Rules for trendlines: -if new top fractal is below the last one = new resistance line -if new bot fractal is above the last one = new support line -Trendlines can be hidden -Fractals can be hidden Fractal Period = can be both even or uneven number, as it is setting for half (one side) of the bars sequence
Signal From Level
Yaroslav Varankin
Binary Options Support Resistance Indicator This indicator is designed for binary options trading and effectively shows retracements from support and resistance levels. Signals appear on the current candle. A red arrow pointing downwards indicates a potential selling opportunity, while a blue arrow pointing upwards suggests buying opportunities. All that needs adjustment is the color of the signal arrows. It is recommended to use it on the M1-M5 timeframes as signals are frequent on these timef
Volume by Price MT4
Brian Collard
4.64 (11)
The Volumebyprice.com Indicator for MetaTrader 4 features Volume Profile and Market Profile TPO (Time Price Opportunity). Volume and TPO histogram bar and line charts. Volume Footprint charts. TPO letter and block marker collapsed and split structure charts. Static, dynamic and flexible range segmentation and compositing methods with relative and absolute visualizations. Session hours filtering and segment concatenation with Market Watch and custom user specifications. Graphical layering, posit
TWO PAIRS SQUARE HEDGE METER INDICATOR Try this brilliant 2 pairs square indicator It draws a square wave of the relation between your two inputs symbols when square wave indicates -1 then it is very great opportunity to SELL pair1 and BUY Pair2 when square wave indicates +1 then it is very great opportunity to BUY pair1 and SELL Pair2 the inputs are : 2 pairs of symbols         then index value : i use 20 for M30 charts ( you can try other values : 40/50 for M15 , : 30 for M30 , : 10 for H1 ,
Power Renko MT4
Pierce Vallieres
Power Renko is an indicator which plots Renko bricks underneath the chart using a histogram. You can select the brick size and the timeframe of the Renko bricks as well as whether or not to use the close price or the high/low price of the candles. Renko bricks are based on price alone, not time, therefor the Renko bricks will not be aligned with the chart's time. They are extremely useful for trend trading and many different strategies can be formed from them. Buffers are provided allowing you t
Rapid
Igor Semyonov
The Rapid indicator is a ready binary options trading system . The system is designed for trading on a five-minute interval with the 15-minute expiration and with the payout at least 85%, it is designed for traders using web terminals and MetaTrader 4 platform. Available financial instruments: EURUSD, EURCHF, GBPUSD, GBPJPY, USDJPY and XAGUSD. This is a counter-trend system, i.e. it waits for the price reversal of a traded asset. The indicator signals are not redrawn, they appear after the close
This indicator works on MT4 and is very easy to use. When you receive a signal from it, you wait for that candle with the signal to close and you enter your trade at the beginning of the next new candle . A red arrow means sell and a green arrow means buy. All arrows comes with Alert  like for easy identification of trade signal. Are you okay with that? 1 minute candle 1 minute expire
Binary Option Signal
Yaroslav Varankin
Indicator for binary options arrow is easy to use and does not require configuration works on all currency pairs, cryptocurrencies buy signal blue up arrow sell signal red down arrow tips do not trade during news and 15-30 minutes before their release, as the market is too volatile and there is a lot of noise it is worth entering trades one or two candles from the current period (recommended for 1 candle) timeframe up to m 15 recommended money management fixed lot or fixed percentage of the depo
YK Fibo Pivot Indicator
Peechanat Chatsermsak
YK-Fibo Pivot Indicator: Trade Smarter with Fibonacci Pivot Points The YK-Fibo Pivot Indicator is a powerful technical analysis tool that combines the precision of Fibonacci retracements with the insights of Pivot Points. Whether you're a novice or seasoned trader, this indicator empowers you to spot profitable opportunities in the market with ease. Why Choose YK-Fibo Pivot? Pinpoint Support & Resistance: By calculating Fibonacci levels based on the previous day's high, low, and close prices, y
NEW check the FULL Version Including the private ICT tools limited so far until the release of the full 2016 Mentorship Core Content to the public. Indicator type: Money Management Calculator; Forex Position Size Calculator; Fixed or ATR value for Stop Loss and Take Profit levels; Average Position Size Indicator (True Average Price); Acc ount Information; Stop-out Level, Margin and Risk Exposure Warning, Forex Sessions; Institutional Levels Grid; Major Highs and Lows, Detailed Account Report an
A Boss Stats
Anthonius Soruh
Hi Trader, We are strategy development for Binary and Forex tools, our product have success for binary trading 1 min - 2 min experation. At the moment I build indicator for trading all day, not like Bonosu series with specific time. We launch A-Boss Stats Indicator for trading 1 minute to 5 minutes experation is mean can trade from 1 minutes - 5 minutes. Specification of A Boss Stats trading binary option: Work with all MT4 broker. Chart Time Frame M1 only, can use M5 Experation time for contact
This is a new strategy for SUPPLY DEMAND areas It is based on a calculation using the tick volume to detect the big price action in market for both bear /bull actions this smart volume action candles are used to determine the supply and demand areas prices in between main supply and demand lines indicate sideway market  up arrows will be shown when prices moves above the main supply and the secondary supply lines Down arrows will be shown when prices moves below the main demand and the secondary
5 signal in 1  Product     TimeFrame   Recommend   1m-5m recommend  signal   TF  5m    Banks Pro Binary Option is Indicator for binary option Can Use Manaul Trade or Robot on Platform  Mt2Trading  https://www.mt2trading.com/?ref=104    Time Trading   good work  EU session    Recommend  Curency   EUR  GBP USD        careful   AUD JPY      Recommend  Martingale 2-5 Step   Recommend  set profit  2%-5%/Day Setting Brake  News Event High volatility   recommend  15-30 min Have Problem Contract
Advanced Stochastic Scalper
Evgeny Belyaev
4.53 (15)
Advanced Stochastic Scalper - is a professional indicator based on the popular Stochastic Oscillator. Advanced Stochastic Scalper is an oscillator with dynamic overbought and oversold levels, while in the standard Stochastic Oscillator, these levels are static and do not change. This allows Advanced Stochastic Scalper to adapt to the ever-changing market. When a buy or a sell signal appears, an arrow is drawn on the chart and an alert is triggered allowing you to open a position in a timely mann
MA Alignment Scanner
Benedict Jamora
5 (1)
This indicator scans and displays currency pairs that have recently aligned moving averages on a given timeframe. You can configure which pairs the indicator will scan. It also includes all types of alert options. Bullish MA Alignment =  MA1>MA2>MA3>MA4>MA5 Bearish MA Alignment =  MA1<MA2<MA3<MA4<MA5 Features Attach to one chart and scans all the currency pairs configured and visible in the Market Watch Window It can monitor all the available timeframes from M1 to MN1 and sends alerts on ever
VR Cub
Vladimir Pastushak
VR Cub 这是获得高质量切入点的指标。该指标的开发是为了促进数学计算并简化对仓位入场点的搜索。多年来,该指标所针对的交易策略已被证明其有效性。交易策略的简单性是其巨大的优势,即使是新手交易者也能成功进行交易。 VR Cub 计算开仓点以及获利和止损目标水平,这显着提高了效率和易用性。查看使用以下策略进行交易的屏幕截图,了解简单的交易规则。 设置、设置文件、演示版本、说明、问题解决,可以从以下位置获取 [博客] 您可以在以下位置阅读或撰写评论 [关联] 版本为 [MetaTrader 5] 计算入场点的规则 开仓 要计算入场点,您需要将 VR Cub 工具从最后一个高点拉伸到最后一个低点。 如果第一个点在时间上早于第二个点,交易者等待柱线收于中线上方。 如果第一个点在时间上晚于第二个点,交易者等待柱线收于中线下方。 根据上述条件,严格在 柱线收盘 后建仓。 换句话说,如果我们在小时图上进行交易,那么从最高点到最低点的时间距离必须超过24小时,最高点和最低点之间的点数必须大于或等于平均价格变动每天。 维持和改变市场地位 可以有多个未平仓头寸;每个头寸都可以单独修改。 VR Cu
CumulativeDeltaBars
Stanislav Korotky
This indicator is a conventional analytical tool for tick volumes changes. It calculates tick volumes for buys and sells separately, and their delta on every bar, and displays volumes by price clusters (cells) within a specified bar (usually the latest one). The algorithm used internally is the same as in the indicator VolumeDelta , but results are shown as cumulative volume delta bars (candlesticks). Analogous indicator for MetaTrader 5 exists - VolumeDeltaBars . This is a limited substitution
Shark Trading
Yaroslav Varankin
The indicator is designed to trade binary options on small time frames up to m 30 Signals The blue up arrow is a buy signal. The red dn arrow is a sell signal. The signal will appear together with the advent of a new candle  and during formation Signals on the current candle Expiration time one candle from the timeframe on which you are trading You can use moving average to filter out false signals. Or escort support levels. This tool is reliable in trading.
Скрипт собирает размеры всех ценовых волн на текущем графике, которые не меньше заданной величины, и сохраняет их в CSV файл. Каждая строка таблицы будет содержать дату/время окончания волны и ее размер. Если вам нужно знать размеры волн в реальном времени, то воспользуйтесь индикатором Wave Size into ZigZag , Wave Size Histogram  или ZZ Histogram . ПАРАМЕТРЫ MinWaveSize:  минимальный размер дял волн, которые попадут в статистику PositiveValues:   true  - в файл сохраняется только размер вол
Professional Level
Yaroslav Varankin
indicator for trading binary options and forex trading. The indicator does not redraw the readings. when trading binary options, testing was performed. This indicator showed the good results correct predictions. Under these conditions, the eur / usd m1 chart, when a signal appears, the transaction opens in the direction indicated by the indicator for 5 candles, then the truth is (5 minutes since in us the 1-minute chart of a candlestick is 1 minute) the result was. When trading in the forex
Royal Dutch Skunk
Sayan Vandenhout
ROYAL DUTCH SKUNK USES THE TREND WAVE INDICATOR AND IT CAN IDENTIFY THE BEGINNING AND THE END OF A NEW WAVE TREND MOVEMENT. AS AN OSCILLATOR, THE INDICATOR IDENTIFIES THE OVERBOUGHT AND OVERSOLD ZONES. IT WORKS GREAT TO CATCH THE SHORT TERM PRICE REVERSALS AND USES A MARTINGALE STRATEGY TO CLOSE ALL TRADES IN PROFIT. USE DEFAULT SETTINGS ON H1 OR HIGHER TIME FRAME ON ANY PAIR FOR MORE ACCURATE TRADES WHY THIS EA : Smart entries calculated by 6 great strategies The EA can be run on even a $20000
该产品的买家也购买
Gann Made Easy
Oleg Rodin
4.85 (82)
Gann Made Easy 是一个专业且易于使用的外汇交易系统,它基于使用先生理论的最佳交易原则。 W.D.江恩。该指标提供准确的买入和卖出信号,包括止损和获利水平。您甚至可以使用推送通知在旅途中进行交易。 购买后请联系我!我将免费与您分享我的交易技巧和丰厚的红利指标! 您可能已经多次听说过江恩交易方法。通常 Gann 的理论不仅对于新手交易者而且对于那些已经有一定交易经验的人来说都是非常复杂的东西。这是因为江恩的交易方法在理论上并不那么容易应用。我花了几年时间来完善这些知识,并将最好的原则应用到我的外汇指标中。 该指标非常易于应用。您所需要的只是将其附加到您的图表并遵循简单的交易建议。该指标不断进行市场分析工作并寻找交易机会。当它检测到一个好的入口点时,它会为您提供一个箭头信号。该指标还显示止损和获利水平。 换句话说,当您像先生一样进行交易时,该指标会为您提供最佳江恩建议。江恩亲自告诉你此时此刻该做什么。但最好的部分是您不需要了解任何有关江恩交易原则的知识,因为该指标会为您完成整个市场分析工作。
TPSpro RFI Levels
Roman Podpora
4.82 (22)
指示       俄罗斯 -        英语   建议 与指示器一起使用     -       TPSpro 趋势专业版 -   MT4版本       交易中的一个关键要素是做出买卖交易工具决定的区域或水平。尽管主要参与者试图隐藏他们在市场中的存在,但他们不可避免地会留下痕迹。我们的任务是学习如何识别这些痕迹并正确解释它们。 主要功能: 向卖家和买家显示活跃区域! 该指标显示所有正确的初始买入和卖出脉冲水平/区域。激活这些水平/区域后,开始寻找切入点,水平会改变颜色并填充特定阴影。此外,还会显示箭头,以便更直观地了解情况。 显示更高时间范围内的级别/区域(MTF 模式) 添加了使用更高时间间隔显示级别/区域的功能。此外,该指标还具有自动趋势检测功能(   TPSproTREND PRO   )。 用于交易的单独专业的逐步算法。 该算法专为日内交易而设计,既可顺势交易,也可逆势交易。每个活动模板均提供详细说明。 适用于多种时间范围 。 TPSpro RFI 水平指标可用于图表上的任何时间范围,从一分钟(M1)开始一直到每月(MN)。 图形和声音警报。 该指标提供图形和声音指示
Gold Stuff
Vasiliy Strukov
4.89 (239)
Gold Stuff 是专为黄金设计的趋势指标,也可用于任何金融工具。 该指标不会重绘,也不会滞后。 推荐时间框架 H1。 在它指标工作全自动专家顾问 EA Gold Stuff。 你可以在我的个人资料中找到它。 重要! 购买后立即与我联系,以获得说明和奖金!   您可以免费收到我们的强力支持和趋势扫描指标的副本,请私信。大部头书! 购买后立即联系我以获得设置和个人奖励!   设置 绘制箭头 - 打开关闭。 在图表上绘制箭头。 警报 - 打开关闭声音警报。 电子邮件通知 - 打开关闭。 电子邮件通知。 Puch-notification - 打开关闭。 推送通知。 接下来,调整色域。 Gold Stuff 是专为黄金设计的趋势指标,也可用于任何金融工具。 该指标不会重绘,也不会滞后。 推荐时间框架 H1。 在它指标工作全自动专家顾问 EA Gold Stuff。 你可以在我的个人资料中找到它。 购买后立即联系我以获得设置和个人奖励!   设置 绘制箭头 - 打开关闭。 在图表上绘制箭头。 警报 - 打开关闭声音警报。 电子邮件通知 - 打开关闭。 电子邮件通
Atomic Analyst
Issam Kassas
5 (2)
首先值得强调的是,该交易指标是非重绘、非延迟的指标,这使其成为手动和机器人交易的理想选择。 用户手册:设置、输入和策略。 Atomic Analyst是一种PA价格行动指标,利用价格的力量和动量来寻找市场上更好的机会。配备了高级过滤器,可帮助去除噪音和假信号,并提高交易潜力。使用多层复杂的指标,Atomic Analyst扫描图表,并将复杂的数学计算转化为任何初学者都能理解并用来做出一致交易决策的简单信号和颜色。 “Atomic Analyst”是专为新手和经验丰富的交易者量身定制的综合交易解决方案。它将高级指标和一流功能融合为一体的交易策略,使其成为所有类型交易者的多功能选择。 日内交易和剥头皮策略:专为快速准确的日内交易和短期交易而设计。 日内和摆动交易策略:可用作追求价格大幅波动的日内和摆动交易者的可靠工具。 多货币和市场:凭借其可靠的精度,在不同的工具和市场上运作。 多个时间框架:可在多个时间框架上使用,性能良好。 稳定性:所有指标均不重绘、不重绘和不滞后,确保可靠的信号。 信号清晰度:提供箭头信号,用于清晰的入场和出场点。 实时警报:通过交易入场、SL和TP警报通知交
Trend Punch
Mohamed Hassan
4.95 (19)
This indicator is unstoppable when combined with our other indicator called  Support & Resistance . After purchase, send us a message and you will get it   for  FREE as a BONUS! Introducing Trend Punch , the revolutionary forex trend indicator that will transform the way you trade! Trend Punch is uniquely designed to provide precise buy and sell arrows during strong market trends, making your trading decisions clearer and more confident. Whether you're trading major currency pairs or exotic sym
TPSproTREND PrO
Roman Podpora
4.79 (19)
TPSpro TREND PRO 是一个趋势指标,可以自动分析市场并提供有关趋势及其每次变化的信息,并给出进入交易的信号而无需重新绘制! 该指标使用每根蜡烛,分别对其进行分析。指不同的脉冲——向上或向下脉冲。货币、加密货币、金属、股票、指数交易的准确切入点! MT5版本                 指标的完整描述   我们建议将其与 指示器 -   RFI LEVELS 一起使用 主要功能: 准确的输入信号,无需渲染! 如果出现信号,它仍然相关!这是与重提指标的一个重要区别,重提指标可以提供信号然后改变信号,这可能导致存款资金的损失。现在您可以以更高的概率和准确度进入市场。还有一个功能是在箭头出现后为蜡烛着色,直到达到目标(止盈)或出现反转信号。 显示止损/获利区域 为了提高搜索切入点时的视觉清晰度,创建了一个模块,该模块最初显示买入/卖出区域,在该区域中搜索进入市场的最佳点。用于处理止损水平的附加智能逻辑有助于随着时间的推移减小其大小,从而降低进入交易(移动 sl)时的初始风险。 显示较高时间范围内的最小值/最大值(MTF 模式) 添加了一项功能,可以显示较高时间间隔的最小
MetaBands M4
Vahidreza Heidar Gholami
5 (2)
MetaBands使用强大且独特的算法绘制通道并检测趋势,以便为交易者提供进出交易的潜在点。它是一个通道指标和强大的趋势指标。它包括不同类型的通道,可以通过使用输入参数简单地合并以创建新通道。MetaBands使用所有类型的警报通知用户市场事件。 功能 支持大多数通道算法 强大的趋势检测算法 能够合并不同类型的通道 多时间帧和多货币(信号矩阵) 所有类型的警报功能(声音、屏幕闪烁、推送通知、电子邮件、弹出窗口、箭头) 它永远不会重绘 趋势检测 MetaBands使用在通道内振荡的蓝色线来检测趋势。当该线遇到通道的上界时,表明开始下跌趋势,当它遇到下界时,表明开始上涨趋势。如果蓝线接近中线,则市场处于整理期。 该指标使用独特的方法来检测趋势。一开始可能看起来有些复杂,但如果您观看视频教程,您就会意识到它是多么强大且易于使用。 入场和出场信号 当趋势变化或价格穿过上下通道时,MetaBands会立即通过不同的方法提醒交易者,这些方法可以在指标设置中启用。 信号矩阵 要监视来自不同时间框架的多个符号并在一个地方查看信号,请单击右上角按钮或按键盘上的M键以打开信号矩阵。该矩阵可以
FX Volume
Daniel Stein
4.58 (33)
通过 mql5 和 Telegram 上 的 " 晨间简报 "获取每日市场更新,包括详细信息和屏幕截图 ! 外汇交易量(FX Volume)是第一个也是唯一一个从经纪商角度真正洞察市场情绪的交易量指标。 直接在您的图表上看到这些信息是真正改变游戏规则和突破性的交易解决方案。 受益于独特的市场数据洞察,如 比率(Ratios )显示货币多头和空头头寸的比率(百分比 比率变化 显示所选时间段内的多头比率及其百分比变化 总交易量 显示货币的总交易量(多头和空头),以手为单位 多头 交易量显示货币所有多头头寸的交易量 空头 交易量显示所有货币空头头寸的交易量 净多头 显示净多头交易量,即所有多头头寸减去所有空头头寸(以手为单位)。 净多头百分比 显示货币净多头交易量的变化 请阅读我们的基本教程 -> "如何使用外汇交易量进行交易 " 获取更多信息,如常见问题、交易技巧和教程视频,请访问我们的 外汇交易量公共信息频道 请 安装并运行 SI Connect 以建立与我们数据中心的持续连接 背景信息 我们都知道,外汇是一个分散的市场。这就是为什么我们必须打破常规思维,开发一个独
Scalper Inside PRO
Alexey Minkov
4.73 (56)
An exclusive indicator that utilizes an innovative algorithm to swiftly and accurately determine the market trend. The indicator automatically calculates opening, closing, and profit levels, providing detailed trading statistics. With these features, you can choose the most appropriate trading instrument for the current market conditions. Additionally, you can easily integrate your own arrow indicators into Scalper Inside Pro to quickly evaluate their statistics and profitability. Scalper Inside
Enigmera
Ivan Stefanov
5 (3)
ENIGMERA:市场核心 https://www.enigmera.com 简介 该指标和交易系统是金融市场的一种非凡方法。ENIGMERA 利用分形周期精确计算支撑位和阻力位。它能显示真实的累积阶段,并给出方向和目标。 该系统无论在趋势中还是在修正中都能发挥作用。 它是如何运行的? ENIGMERA 由三条线组成:支撑/阻力线、目标线和偏离线。与一般市场指标将过去的数据推断为现在和未来的情况不同,该系统能提供当前的完整情况。如果你处于支撑位,这意味着真正的支撑;如果你处于阻力位,这意味着真正的阻力。如果突破某一水平,则表示趋势发生变化。没有重绘。 由于市场在不断变化,ENIGMERA 不断调整其评估工具,定期修改策略。  这保证了每种情况都能得到全面评估。这一市场指标的独特性显而易见,其能力不言而喻。  ENIGMERA 为金融分析师和咨询师提供服务,他们需要可靠的见解与客户分享,也为投资者提供服务,他们需要最精确和最可靠的保证。 该系统能够达到最佳精度,使交易者能够自信、清晰地评估他们的选择。 ENIGMERA 将 20 年的交易专长和知识整合到一个综合软件
FX Power MT4 NG
Daniel Stein
5 (12)
通过 mql5 和 Telegram 上 的晨间简报获取每日市场更新,包括详细信息和屏幕截图 ! FX Power MT4 NG 是我们长期以来非常受欢迎的货币强度计算器 FX Power 的下一代产品。 这款下一代强度计算器能提供什么?您所喜爱的原版 FX Power 的所有功能 附加功能 黄金/XAU 强度分析 更精确的计算结果 可单独配置的分析周期 可自定义计算限制,以获得更好的性能 为希望查看更多信息的用户提供特殊的多实例设置 无尽的图形设置,可在每个图表中设置您最喜欢的颜色 无数的通知选项,让您再也不会错过任何重要信息 采用 Windows 11 和 macOS 风格的全新圆角设计 神奇的移动指标面板 FX Power 主要功能 所有主要货币的完整强势历史 所有时间框架内的货币强弱历史 所有经纪商和图表的计算结果完全相同 100% 可靠的实时计算 -> 无重绘 可通过下拉列表选择分析时段 通过自定义模式单独配置分析时段 可在一个图表中使用多个实例 可移动 FX Power 显示屏(通过拖放) 适用于高分辨率 QHD、UHD 和 4K 显示器 自动终端配置 针对平板电脑
目前八折优惠! 对任何新手或专家交易者来说都是最好的解决方案! 这个仪表板软件适用于28种货币对。它基于我们的两个主要指标(高级货币强度28和高级货币冲动)。它对整个外汇市场提供了一个伟大的概述。它显示高级货币强度值,货币运动速度和28个外汇对在所有(9)时间段的信号。想象一下,当你可以使用图表上的单一指标观察整个市场,以确定趋势和或剥头皮的机会时,你的交易将得到改善 我们已经在这个指标中建立了一些功能,使你更容易识别强势和弱势货币,同时识别和确认潜在的交易。该指标以图形方式显示货币的强势或弱势是增加还是减少,以及它在所有时间段的表现。 增加的新功能是动态市场斐波那契水平,它适应当前的市场条件变化,这是一个已经在我们的高级货币强度28和高级货币冲动指标中使用的成熟的加分项。 在交易时,总是将弱势货币和强势货币配对,这个新指标将帮助你做到这一点。 用户手册:点击这里  https://www.mql5.com/en/blogs/post/708783 特点  显示每个时间段的ACS28和GAP-speed(冲动)的货币强度值。 列:颜色代码以7种颜色
Bomb Bank Signal
Igor Pereira Calil
5 (1)
炸彈銀行訊號:您對 MetaTrader 4 的信心指標 Bomb Bank Signal 是 MetaTrader 4 的一個強大指標,旨在識別金融市場中最相關的趨勢。如果您正在尋找一種能夠準確預測運動的工具,那麼炸彈庫就是您需要的盟友。 運作原理: 該指標結合了三種不同的方法——成交量分析、蠟燭收盤價和對稱趨勢——來偵測和發出買賣機會訊號。當炸彈銀行識別出買入機會時,它就像一顆「炸彈」;當它偵測到賣出訊號時,它就像一個「頭骨」。 為什麼炸彈銀行不一樣? 完全可靠性:炸彈庫訊號不會刪除訊號。訊號一旦發出,就會一直存在,確保您不會錯過任何機會。 極為準確:炸彈庫不會發出錯誤訊號。它會即時更新您的訊息,隨著市場的變化進行調整,但保持先前訊號的透明度。 即時更新:訊號被即時識別並在必要時更新,使您能夠快速響應市場變化。 最大化您的結果: 炸彈銀行訊號是識別趨勢持續走勢的理想選擇。例如,如果您已經做空並且指標在 M15 發出買入訊號,那麼現在就是平倉或部分下單的最佳時機,反之亦然。 此外,經過仔細分析,我們建議您遵循M30、H1和H4上的訊號,停損僅50點。這使
Trend Cutter
Oleg Rodin
5 (2)
Trend Cutter 是一种趋势指标,可用于任何时间范围,包括 M1 和 M5 等较低时间范围。该指标对于喜欢日内交易的交易者来说是理想的选择,并且对那些喜欢长期交易的交易者也有帮助。您可以使用该指标作为您的交易系统的基础或作为独立的交易解决方案。 该指标提供所有类型的警报,包括推送通知。 指标中有一个易于使用的输入参数,可让您按照您希望的方式调整信号。此选项将为您提供交易的灵活性。 您也可以在任何您想要的市场进行交易。 该指标非常容易使用。您只需遵循信号即可。我还将免费向该指标的所有用户提供附加指标,这将帮助您尽可能高效地使用该方法。 购买后请联系我以获得我的交易提示和丰厚奖金! 感谢您的关注! 祝您交易顺利、盈利!
Currency Strength Wizard
Oleg Rodin
4.93 (44)
货币强度向导是一个非常强大的指标,为您提供成功交易的一体化解决方案。该指标使用多个时间范围内所有货币的数据来计算这个或那个外汇对的力量。此数据以易于使用的货币指数和货币电力线的形式表示,您可以使用它们来查看这种或那种货币的力量。 您所需要的只是将指标附加到您要交易的图表上,该指标将向您显示您交易的货币的真实强度。该指标还向您显示买卖量压力的极值,您可以在顺势交易时利用这些压力。该指标还显示了基于斐波那契的可能目标。该指标可用于各种交易时间范围。该指标支持各种货币对的交易。 该指标为您提供所有类型的警报,包括推送通知。 购买后请联系我。我将与您分享我的交易技巧,并免费为您提供丰厚的红利指标! 祝您交易愉快,获利丰厚!
TakePropips Donchian Trend Pro
Eric John Pajarillaga Aldana
4.44 (16)
TakePropips Donchian Trend Pro   (MT4) 是一款功能强大且有效的工具,可使用 Donchian 通道自动检测趋势方向,并为您提供进场和退场交易信号! 这个多功能指标包括趋势扫描器、交易信号、统计面板、筛选器、交易时段和警报历史仪表板。它旨在为您提供交易信号并节省您分析图表的时间! 您可以在我们的博文中下载用户手册和安装指南:   https   :// www.mql5.com/en/blogs/post/751368 今天立减 50%!价格从 98 美元降到 49 美元! 您可以在 Strategy Tester 上测试该指标(启用可视模式) 视频教程也可在说明下方获得更多详细信息。 如果您有任何问题或需要任何帮助,请与我联系。 TakePropips Donchian Trend Pro 指标适用于所有外汇对、金属、商品、指数和加密货币。 主要特点 交易信号 - 检测多个时间范围内所有货币对的买卖机会。它将为您提供警报并在图表上绘制交易信号,最多 3 个止盈价和一个止损价。 Trend Scanner   - 用于快速扫描和识别跨多个时间
Supply and Demand Dashboard PRO
Bernhard Schweigert
4.8 (20)
目前八折优惠! 这个仪表板是一个非常强大的软件,可用于多个符号和多达9个时间段。 它是基于我们的主要指标(最佳评论:高级供应需求)。 Advanced Supply Demand 该仪表板提供了一个伟大的概述。它显示。   筛选后的供需值,包括区域强度评级。 区间内和区间外的点位距离。 它突出了嵌套的区域。 在所有(9个)时间段内,它对所选符号发出4种警报。 它是高度可配置的,以满足您的个人需求! 您的利益! 对每个交易者来说,最重要的问题是。 什么是入市的最佳水平? 在强大的供应/需求区域内或附近进入你的交易,以获得最佳的成功机会和风险/回报。 我的止损的最佳位置是哪里? 把你的止损放在强势供应/需求区的下方/上方是最安全的。 我的最佳盈利目标是什么? 你的退出策略和你的进入策略一样重要,了解更高的时间框架图可以帮助你。对于买入,使用下一个供应区作为目标,对于卖出,使用下一个需求区作为目标。在回撤到供应区或需求区时进场,以确保有足够的利润空间,达到更高的时间框架的供应和需求,将增加你的利润。 为什么我们要过滤强区和
Advanced Currency Strength28 Indicator
Bernhard Schweigert
4.9 (649)
目前26%的折扣 任何新手或专家交易者的最佳解决方案! 这个指标是一个独特的、高质量的、可负担得起的交易工具,因为我们纳入了一些专有的功能和一个新的公式。只需一个图表,你就可以读出28个外汇对的货币强度!想象一下,你的交易将如何得到改善,因为你的交易是在你的手中进行的。想象一下,你的交易将如何改善,因为你能够准确地确定新趋势或剥头皮机会的触发点? 用户手册:点击这里  https://www.mql5.com/en/blogs/post/697384 这是第一本,原版的! 不要买一个毫无价值的崇拜者的克隆品。 特别的 子窗口中的箭头显示强劲的货币势头GAP将指导你的交易! 当基础货币或报价货币处于超卖/超买区域(外盘斐波那契水平)时,在个人图表的主窗口中出现警告信号。 当货币力量从外围区间回落时,回撤/反转警报。 十字星模式的特别警报 可选择多个时间框架,以快速查看趋势! 货币强度线在所有的时间框架中都非常平稳,当使用较高的时间框架来识别总体趋势,然后使用较短的时间框架来确定精确的入口时,效果非常好。你可以根据自己的意愿选择任何时间框架。每个时间框架都由其自身进
首先,值得强调的是,这个交易工具是非重绘、非重画和非滞后的指标,非常适合专业交易。 在线课程,用户手册和演示。 智能价格行动概念指标是一个非常强大的工具,既适用于新手,也适用于经验丰富的交易者。它将超过20个有用的指标合并到一个指标中,结合了高级交易思想,如内圈交易员分析和智能资金概念交易策略。该指标侧重于智能资金概念,提供有关大型机构交易方式的见解,帮助预测它们的动向。 它在流动性分析方面尤其擅长,有助于理解机构的交易方式。它擅长预测市场趋势,并仔细分析价格波动。通过将您的交易与机构策略对齐,您可以更准确地预测市场走向。该指标多才多艺,擅长分析市场结构,识别重要的订单区块,并识别各种模式。 它擅长识别BOS和CHoCH等模式,理解动量的转变,并突出显示供需强劲的关键区域。它还擅长发现强大的不平衡,并分析价格创造更高高点或更低低点的模式。如果您使用斐波那契回撤工具,该指标可以满足您的需求。它还可以识别相等的高点和低点,分析不同的时间框架,并通过仪表板显示数据。 对于使用更高级策略的交易者,该指标提供了工具,如公平价值差指标和优惠和折扣区域的识别。它特别关注高时间框架订单
Advanced Currency IMPULSE with ALERT
Bernhard Schweigert
4.9 (480)
目前31%的折扣!! 对任何新手或专家交易者来说都是最好的解决方案! 这个指标是一个独特的、高质量的、负担得起的交易工具,因为我们已经纳入了一些专有的功能和一个秘密的公式。只需一张图表,它就能给出所有28种货币对的警报。想象一下,你的交易将如何改善,因为你能够准确地确定新趋势或剥头皮机会的触发点 建立在新的基础算法上,它使识别和确认潜在交易变得更加容易。这是因为它以图形方式显示了一种货币的强势或弱势是否正在加速,并测量了这种加速的速度--把它想象成你汽车中的速度表。当你加速时,事情显然会发生得更快,这在外汇市场上也是一样的,即如果你配对的货币正在向相反的方向加速,你就会发现一个潜在的有利可图的交易。 货币动量的垂直线和箭头将指导你的交易! 动态的市场斐波那契23水平被用作警报触发器,将适应市场活动。如果冲动触及黄色触发线,您将在MetaTrader或您的电子邮件或推送警报中收到警报。然后你就知道作为一个交易员应该做什么。货币对和方向已经给出。只要点击警报按钮,就可以切换到该货币对或打开一个新的图表,以便进一步分析。警报级别可以通过用户输入来改变,可以选择3个敏感度级别
PZ Day Trading
PZ TRADING SLU
3.67 (3)
该指标仅使用价格行为分析和donchian渠道以锯齿形检测价格反转。它是专门为短期交易而设计的,根本不需要重新粉刷或补漆。对于精明的交易者来说,这是一个绝佳的工具,旨在增加他们的运作时间。 [ 安装指南 | 更新指南 | 故障排除 | 常见问题 | 所有产品 ] 极易交易 它在每个时间段都提供价值 实施自我分析统计 它实现了电子邮件/声音/视觉警报 基于可变长度的突破和拥挤区域,该指标仅使用价格行为来选择交易并对市场快速做出反应。 显示过去信号的潜在利润 该指标分析其自身的质量和性能 突围的损失突出显示并解决 该指标是不可重涂和不可重涂的 该指标将帮助盘中交易者不要错过单个价格反转。但是,并非所有价格反转都是一样的,也不是具有相同的可行质量。决定要突破哪些突破而忽略哪些取决于交易者的良好判断。 如何解释统计数据 该指标研究其自身信号的质量,并在图表上绘制相关信息。将分析每笔交易,并在图表的左上角显示总体历史结果,这使您可以针对任何给定的工具和时间范围自行优化指标参数。每个乐器和时间表都有其自己的最佳设置,您可以自己找到它们。 最大优惠交易:对于任何给定的交易,MFE都是
M1 Arrow
Oleg Rodin
4.73 (15)
M1 Arrow - 基于市场的两个基本原则的盘中策略。 该算法基于使用附加过滤器对交易量和价格波动的分析。该指标的智能算法仅在两个市场因素合二为一时才会发出信号。该指标使用较高时间框架的数据计算 M1 图表上某个范围的波浪。为了确认波浪,该指标使用了成交量分析。 从理论上讲,该指标可以与其他时间框架一起使用,但您需要考虑到该指标最初是为在 M1 上交易而开发的这一事实。 该指标是一个现成的交易系统。交易者所需要的只是跟随信号。此外,该指标可以成为您自己的交易系统的基础。交易仅在分钟图表上进行。 尽管指标使用 MTF 原理,但指标算法尽可能稳定。 购买后,一定要写信给我!我将与您分享我的交易设置和建议!祝您交易成功!感谢您的关注!
Advanced Supply Demand
Bernhard Schweigert
4.91 (294)
现在优惠 33%! 任何新手或专业交易者的最佳解决方案! 该指标是一款独特、高质量、且价格合理的交易工具,因为我们已经整合了许多专有功能和新公式。 依据此更新,您将能够显示双重时间帧区域。 您不仅可以显示一个较高的时间帧,还可以同时显示图表时间帧,加上更高的时间帧:显示嵌套时区。 供需双方所有交易者都会喜欢它。 :) 重要信息披露 高级供需的最大潜力,请访问 https://www.mql5.com/zh/blogs/post/720245   想象您的交易如何得以改善,是因为您能够精准定位入场或目标位吗? 构建于新的底层算法,它可以更轻松地识别出买卖双方之间的潜在失衡。 这是因为它以图形方式展示供需最强劲区域,及其过去的表现(显示旧区域)。 这些功能旨在帮助您更轻松地发现最佳入场区域和价位。 现在您可以针对您的交易品种和时间帧来优化和编辑区域强度! 高级供需指标适用于所有产品和时间帧。 它是一个新的公式,非常新的功能是两个区域强度函数可由用户输入进行调整! 这在交易中是一大优势。 当您学习如何使用专有功能,例如带有价格游离最小 X 因子的区域强度时,您能够判断该区域强劲与否。 供
Gold Channel XAUUSD
Paulo Rocha
5 (2)
Gold Channel is a volatility-based indicator, developed with a specific timing algorithm for the XAUUSD pair, which consists of finding possible corrections in the market. This indicator shows two outer lines, an inner line (retracement line) and an arrow sign, where the theory of the channel is to help identify overbought and oversold conditions in the market. The market price will generally fall between the boundaries of the channel. If prices touch or move outside the channel it is a tra
Trend Pulse
Mohamed Hassan
5 (4)
Please contact me after purchase to immediately get your PDF strategy + documentation for Trend Pulse !  Introducing Trend Pulse , a unique and robust indicator capable of detecting bullish, bearish, and even ranging trends! Trend Pulse uses a special algorithm to filter out market noise with real precision. If the current symbol is moving sideways, Trend Pulse will send you a ranging signal, letting you know that it's not a good time to enter a trade. This excellent system makes Trend Pulse
Scalper Vault
Oleg Rodin
5 (27)
Scalper Vault 是一个专业的剥头皮系统,为您提供成功剥头皮所需的一切。该指标是一个完整的交易系统,可供外汇和二元期权交易者使用。推荐的时间范围是 M5。 该系统为您提供趋势方向的准确箭头信号。它还为您提供顶部和底部信号以及江恩市场水平。无论您拥有何种交易经验,该系统都易于使用。您只需要遵循简单的规则并每天重复该过程。 建议将此系统用于主要货币对。感谢您的关注! 请注意,该指标在策略测试器中可能无法正常工作。因此,我建议仅在模拟或真实账户的真实交易条件下使用该系统。 指示器提供所有类型的警报,包括推送通知。 购买指标后请与我联系。我将免费与您分享我的个人交易建议和出色的奖励指标! 祝您交易愉快,盈利!
Currency Strength Exotics
Bernhard Schweigert
4.87 (30)
目前8折优惠! 对任何新手或专家交易者来说都是最好的解决方案! 这个指标是专门用来显示任何符号的货币强度,如异国货币对、商品、指数或期货。它是同类产品中的第一个,任何符号都可以添加到第9行,以显示黄金、白银、石油、DAX、US30、MXN、TRY、CNH等的真实货币强度。这是一个独特的、高质量的、负担得起的交易工具,因为我们已经纳入了一些专有的功能和一个新的公式。想象一下,你的交易将如何改善,因为你能够准确地确定新趋势或剥头皮机会的触发点? 用户手册:点击这里   https://www.mql5.com/en/blogs/post/708876 它适用于所有时间框架。你将很快能够看到TREND! 根据新的基础算法设计,它使识别和确认潜在交易变得更加容易。这是因为它以图形方式显示了8种主要货币和一种符号的强弱。 该指标显示了8种主要货币(澳元加元瑞士法郎欧元英镑日元新西兰美元)的强弱线,再加上一个符号! 该指标显示了符号的真实价值。例如:对于XAUUSD(黄金):价格以美元报价。如果黄金在上涨,你怎么能知道是黄金的强势还是美元的弱势?只有当黄金走强时,我们才会进行
Order Block Hunter
Noha Mohamed Fathy Younes Badr
5 (4)
Order block hunter indicator is the best indicator for  hunt the order blocks that area where there has been a large concentration of limit orders waiting to be executed Order blocks are identified on a chart by observing previous price action and looking for areas where the price experienced significant movement or sudden changes in direction .This indicator does that for you by using very complicated codes and helps you to take the best areas To buy and sell because it make marks at the best a
Quantum Trend Monitor Indicator
QUANTUM TRADING SOFTWARE LIMITED
Currency pairs never go up or down in a straight line. They rise and fall constantly, creating pullbacks and reversals. And with each rise and fall, so your emotions rise and fall. Hope, then fear, then hope. This is when the market will try to frighten you out of a strong position. It is when you are most vulnerable. But not if you have the Quantum Trend Monitor. And here, you even get two indicators for the price of one! The Quantum Trend Monitor has been designed to absorb these temporary pau
Quantum Volume Point of Control Indicator
QUANTUM TRADING SOFTWARE LIMITED
5 (1)
The Quantum VPOC indicator has been developed to expand the two dimensional study of volume and price, to a three dimensional one which embraces time. The volume/price/time relationship then provides real insight to the inner workings of the market and the heartbeat of sentiment and risk which drives the price action accordingly. The Quantum VPOC indicator displays several key pieces of information on the chart as follows: Volume Profile - this appears as a histogram of volume on the vertical pr
作者的更多信息
Trend Screener Pro MT5
STE S.S.COMPANY
4.87 (62)
使用趋势筛选指标释放趋势交易的力量:由模糊逻辑和多货币系统提供支持的终极趋势交易解决方案! 使用趋势筛选器(由模糊逻辑提供支持的革命性趋势指标)提升您的趋势交易。 它是一个强大的趋势跟踪指标,结合了超过 13 种高级工具和功能以及 3 种交易策略,使其成为使您的 Metatrader 成为趋势分析器的多功能选择。 限时优惠:趋势筛选指标终身仅需 50 美元。 ( 原价 250$ ) (优惠延长) 体验趋势筛选器 100% 无需重新绘制的准确性,确保您的交易决策不受过去价格变化的影响。 释放多时间框架和多货币功能的多功能性,使您能够以无与伦比的信心在外汇、商品、加密货币和指数领域进行交易。 利用 Trend Screener 的综合策略套件增强您的交易: - 趋势跟踪策略和趋势延续策略 :趋势筛选器的趋势跟踪策略提供清晰的趋势延续信号,让您有效捕捉趋势走势并管理风险。 - 反转策略和早期入场点策略 :趋势筛选器的反转策略可检测市场方向的潜在变化,使您能够预测趋势反转并利用疲弱的市场趋势。通过早期入场点,您可以在潜在的趋势变化之前定位自己 获取可观的利润。 - 倒卖策略: 趋势筛选器的倒卖
Support Resistance screnner
STE S.S.COMPANY
4.97 (35)
支撑和阻力筛选器是 MetaTrader 的一个级别指标,它在一个指标内提供多种工具。 可用的工具有: 1. 市场结构筛选器。 2. 看涨回调区。 3. 看跌回调区。 4.每日枢轴点 5.每周枢轴点 6. 每月枢轴点 7. 基于谐波形态和成交量的强大支撑和阻力。 8. 银行级区域。 限时优惠:HV 支撑和阻力指示器仅售 50 美元且终生可用。 (原价 125$) 您想尝试不受 Metatrader Backtester 限制的指标吗? 单击此处下载演示版本。 主要特点 基于谐波和音量算法的强大支撑和阻力区域。 基于谐波和成交量算法的看涨和看跌回调区域。 市场结构筛选器 每日、每周和每月的枢轴点。 文档 所有支持和阻力筛选器文档(说明)和策略详细信息均可在我们 MQL5 博客的这篇文章中找到: 单击此处。 接触 如果您有任何问题或需要帮助,请通过私信联系我。 作者 SAYADI ACHREF,金融科技软件工程师,Finansya 创始人。
Boom and Crash Spike Detector 指标是根据主要用于检测价格中的 Boom 和 Crash 的高级策略进行编码的。 植入了复杂的算法来检测价格中高概率的繁荣和崩溃。 它会在潜在的繁荣或崩溃阶段发出警报: 繁荣阶段:当价格上涨过快时。 崩溃阶段:当价格下跌过快时。 限时优惠:该指标仅适用于 30美元和终身。 主要特征 向手机发送推送通知 在计算机或笔记本电脑上弹出并发出警报 显示非重绘箭头(向上箭头表示潜在繁荣,向下箭头表示潜在崩溃) 与所有对一起工作。 推荐 时间范围:H1 和 H4 推荐货币对:处于趋势阶段的货币对。 接触 如果您有任何问题或需要帮助,请通过私信联系我。 作者 SAYADI ACHREF,金融科技软件工程师和 Finansya 创始人。
支撑和阻力筛选器是 MetaTrader 的一个级别指标,它在一个指标内提供多种工具。 可用的工具有: 1. 市场结构筛选器。 2. 看涨回调区。 3. 看跌回调区。 4.每日枢轴点 5.每周枢轴点 6. 每月枢轴点 7. 基于谐波形态和成交量的强大支撑和阻力。 8. 银行级区域。 限时优惠:HV 支撑和阻力指示器仅售 50 美元且终生可用。 (原价 125$) 通过访问我们的 MQL5 博客,您可以找到我们所有带有分析示例的高级指标: 单击此处 主要特点 基于谐波和音量算法的强大支撑和阻力区域。 基于谐波和成交量算法的看涨和看跌回调区域。 市场结构筛选器 每日、每周和每月的枢轴点。 文档 所有支持和阻力筛选器文档(说明)和策略详细信息均可在我们 MQL5 博客的这篇文章中找到: 单击此处。 接触 如果您有任何问题或需要帮助,请通过私信联系我。 作者 SAYADI ACHREF,金融科技软件工程师,Finansya 创始人。
当市场的价格走势逆转并改变方向时,我们的支撑位或阻力位就形成了,在市场上留下了一个高峰或低谷(摆动点)。支撑位和阻力位可以划出交易区间。该指标根据指标集中定义的 X 根柱线数 (Period) 识别摆动高点和摆动低点。 注意:如果您喜欢我们的价格行为指标,请尝试我们的多合一趋势指标(趋势筛选器、趋势线、强趋势和趋势反转信号等)。 要获取它, 请单击此处 主要特点 技术分析的一个关键概念是,当阻力位或支撑位被突破时,它的作用就会逆转。如果价格跌破支撑位,该位将成为阻力位。如果价格升至阻力位以上,则通常会成为支撑位。 水平支撑和阻力水平是这些水平中最基本的类型。它们只是由一条水平线标识: 图表中的绿色水平,是阻力水平。 图表中的红色水平,是支撑水平。 我们的支撑位和阻力位用于确定价格趋势更有可能停止并可能改变方向的关键水平。它可以是特定的价格或价格区域。对水平重要性程度的解释取决于交易者的时间框架。 文件(说明) 所有 PR 支撑和阻力指标、文档(说明)均可在我们 MQL5 博客的这篇文章中找到: 单击此处。 优势 处理所有货币对(外汇、加密货币、指数和商
FREE
Trend Line Map Pro
STE S.S.COMPANY
4.47 (15)
趋势线图指标是趋势筛选器指标的插件。它用作趋势筛选器(趋势线信号)生成的所有信号的扫描仪。 它是基于趋势筛选器指标的趋势线扫描仪。如果您没有 Trend Screener Pro Indicator ,Trend Line Map Pro 将无法使用。 通过访问我们的 MQL5 博客,您可以下载趋势线图指标的免费版本。购买前试用,不受 Metatrader Tester 限制。 :    点击这里 1. 容易获得的优势 根据货币和时间范围显示买入和卖出信号。 评估自图表中出现箭头以来价格上涨或下跌的点数。 (趋势筛选指标箭头) 显示信号的时序。 获取多时间范围和多货币警报以购买和出售警报。 2. 如何使用趋势线图 如何显示买卖信号仪表板? 如果您有任何问题或需要帮助,请通过私信联系我。 作者 SAYADI ACHREF,金融科技软件工程师,Finansya 创始人。
Trend Line Map Pro MT5
STE S.S.COMPANY
4.09 (11)
趋势线图指标是趋势筛选器指标的插件。它用作趋势筛选器(趋势线信号)生成的所有信号的扫描仪。 它是基于趋势筛选器指标的趋势线扫描仪。如果您没有 Trend Screener Pro Indicator,Trend Line Map Pro 将无法使用。 It's a Trend Line Scanner based on Trend Screener Indicator. If you don't have Trend Screener Pro Indicator,     the Trend Line Map Pro will not work . 通过访问我们的 MQL5 博客,您可以下载趋势线图指标的免费版本。购买前试用,不受 Metatrader Tester 限制。 :  点击这里 1. 容易获得的优势 根据货币和时间范围显示买入和卖出信号。 评估自图表中出现箭头以来价格上涨或下跌的点数。 (趋势筛选指标箭头) 显示信号的时序。 获取多时间范围和多货币警报以购买和出售警报。 2. 如何使用趋势线图 如何显示买卖信号仪表板? 如果您有任何问题或需
Boom and Crash Spike Detector 指标是根据主要用于检测价格中的 Boom 和 Crash 的高级策略进行编码的。 植入了复杂的算法来检测价格中高概率的繁荣和崩溃。 它会在潜在的繁荣或崩溃阶段发出警报: 繁荣阶段:当价格上涨过快时。 崩溃阶段:当价格下跌过快时。 限时优惠:该指标仅适用于 30 美元和终身。 主要特征 向手机发送推送通知 在计算机或笔记本电脑上弹出并发出警报 显示非重绘箭头(向上箭头表示潜在繁荣,向下箭头表示潜在崩溃) 与所有对一起工作。 推荐 时间范围:H1 和 H4 推荐货币对:处于趋势阶段的货币对。 接触 如果您有任何问题或需要帮助,请通过私信联系我。 作者 SAYADI ACHREF,金融科技软件工程师和 Finansya 创始人。
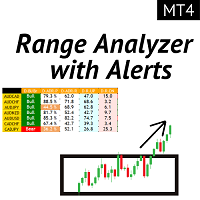
平均每日范围显示了在一定时期内测量的外汇对的平均点范围。 交易者可以使用 ADR 来可视化平均每日变动之外的潜在价格行为。 当 ADR 高于平均水平时,意味着每日波动率高于平时,这意味着货币对可能超出其正常范围。 我们的 ADR 分析仪由 5 个主要功能组成: Range (ADR) Screener:一种多币种 ADR 分析。 ADR 区域:显示 ADR 区域外价格上涨的日内预期市场范围。 X bar Zone : 显示用户指定的 X 根柱线的突破。 每日高点和低点区:识别前一天高点或低点的突破。 每周高点和低点区:确定一周的突破日高位或低位。 限时优惠:范围分析仪指示器仅适用于 50 美元和终身。 (原价 125 美元) 主要特征 多币种筛选器。 ADR 区域突破 所有类型的警报(弹出、推送通知等) 支持所有货币。 文件资料 所有带有警报文档(说明)和策略详细信息的范围分析器都可以在我们的 MQL5 博客的这篇文章中找到: 点击这里。 接触 如果您有任何问题或需要帮助,请通过私信联系我。 警告 我们所有的指标都只能通过官方 Metatrader
Todo comerciante sabe que él o ella nunca deben arriesgar más del 5% (o 7%) por operación. Esta es una ley de administración de dinero y se debe calcular un tamaño de lote utilizable cada vez porque un comerciante debe usar un valor StopLoss diferente para diferentes niveles de negociación. Este indicador calculará un tamaño de lote apropiado para el momento en que lo colocará en el gráfico y cada vez arrastrará la "Línea de stop loss" en cualquier dirección. OFERTA POR TIEMPO LIMITADO: Todos
Trend Currency Strength
STE S.S.COMPANY
5 (2)
货币强度计,为您提供当前哪些货币强,哪些货币弱的快速视觉指南。 该仪表测量所有外汇交叉货币对的强度,并对它们进行计算以确定每种货币的整体强度。 我们根据 28 对的趋势计算货币的强度。 .货币强度计是指标的通用名称,用于显示您是在处理强货币还是弱货币。这种基于算法的指标依赖于各种货币对的汇率来提供每种货币的强弱程度。 通过访问我们的 MQL5 博客,您可以下载该指标的免费版本。 购买前试用,不受 Metatrader Tester 限制: 单击此处 1. 文档 所有趋势货币强度文档(说明)和策略详细信息均可在我们 MQL5 博客的这篇文章中找到: 单击此处。 2. 联系方式 如果您有任何问题或需要帮助,请通过私信联系我。 3. 作者 SAYADI ACHREF,金融科技软件工程师,Finansya 创始人。
Todo comerciante sabe que él o ella nunca deben arriesgar más del 5% (o 7%) por operación. Esta es una ley de administración de dinero y se debe calcular un tamaño de lote utilizable cada vez porque un comerciante debe usar un valor StopLoss diferente para diferentes niveles de negociación. Este indicador calculará un tamaño de lote apropiado para el momento en que lo colocará en el gráfico y cada vez arrastrará la "Línea de stop loss" en cualquier dirección. OFERTA POR TIEMPO LIMITADO: Todos
波动率分析仪是一种动量指标,它利用价格在狭窄交易区间盘整后强劲突破的趋势。该指标还使用动量振荡器来显示挤压触发时的预期移动方向。该直方图在零线附近震荡,零线上方的动量增加表明有机会买入多头,而动量低于零线则表明有做空机会。 限时优惠:该指标仅适用于 50 美元和终身。 (原价 125 美元) 主要特征 横向趋势检测器。 低挥发性检测器。 看涨高位和看跌高波动率检测器。 使用所有时间框架和所有货币对。 提供弹出警报和推送通知警报。 接触 如果您有任何问题或需要帮助,请通过私信与我联系。 警告 我们所有的指标和工具都只能通过官方 Metatrader 商店 (MQL5 市场) 获得。 溢价指标 通过访问我们的 MQL5 配置文件,您可以找到我们所有的免费和高级指标。要访问我们的个人资料, 请单击此处。 作者 SAYADI ACHREF,金融科技软件工程师,Finansya Lab 创始人。
平均每日范围显示了在一定时期内测量的外汇对的平均点范围。 交易者可以使用 ADR 来可视化平均每日变动之外的潜在价格行为。 当 ADR 高于平均水平时,意味着每日波动率高于平时,这意味着货币对可能超出其正常范围。 我们的 ADR 分析仪由 5 个主要功能组成: Range (ADR) Screener:一种多币种 ADR 分析。 ADR 区域:显示 ADR 区域外价格上涨的日内预期市场范围。 X bar Zone : 显示用户指定的 X 根柱线的突破。 每日高点和低点区:识别前一天高点或低点的突破。 每周高点和低点区:确定一周的突破日高位或低位。 限时优惠:范围分析仪指示器仅适用于 50 美元和终身。 (原价 125 美元) 主要特征 多币种筛选器。 ADR 区域突破 所有类型的警报(弹出、推送通知等) 支持所有货币。 文件资料 所有带有警报文档(说明)和策略详细信息的范围分析器都可以在我们的 MQL5 博客的这篇文章中找到: 点击这里。 接触 如果您有任何问题或需要帮助,请通过私信联系我。 警告 我们所有的指标都只能通过官方 Metatrader
波动率分析仪是一种动量指标,它利用价格在狭窄交易区间盘整后强劲突破的趋势。该指标还使用动量振荡器来显示挤压触发时的预期移动方向。该直方图在零线附近震荡,零线上方的动量增加表明有机会买入多头,而动量低于零线则表明有做空机会。 限时优惠:该指标仅适用于 50 美元和终身。 (原价 125 美元) 主要特征 横向趋势检测器。 低挥发性检测器。 看涨高位和看跌高波动率检测器。 使用所有时间框架和所有货币对。 提供弹出警报和推送通知警报。 接触 如果您有任何问题或需要帮助,请通过私信与我联系。 警告 我们所有的指标和工具都只能通过官方 Metatrader 商店 (MQL5 市场) 获得。 溢价指标 通过访问我们的 MQL5 配置文件,您可以找到我们所有的免费和高级指标。要访问我们的个人资料, 请单击此处。 作者 SAYADI ACHREF,金融科技软件工程师,Finansya Lab 创始人。
筛选:
temcclain78
24
temcclain78 2024.09.11 16:35 
 

This outstanding product has been a game changer! In July, I bought the Trend Screener and the Trend Line Map Pro for $100 USD all together, signed up for a $200K challenge, and 6 days later I passed the challenge. August brought a market shift. So my honest recommendation, have a reliable trend based strategy already so you will know WHAT to look for. Buy the products so you will know WHERE and WHEN to look. I downloaded some free technical indicators to build my current strategy based on M1 (heads up), M5 (entry and exit), and M15 (overall trend). I have all 3 timeframes open when analysing and trading. The addition of the Trend Screener's analysis on all timeframes, and the Fuzzy Logic, make it a must have for me. The strongest trends, and best trades, happen when more timeframes align in that direction. The Trend Screener shows me what I am missing and makes Top Down Analysis quicker. These products have been the missing piece to the puzzle of trading for me / my "Aha moment". Although I'm a day trader, in July the Trend Line Map Pro made me want to become a swing trader. It gave an NZD alert based on the H4, and I placed my entries based on how I trade the lower timeframes. I placed my Take Profit based on H4 levels and saw amazing profit.

STE S.S.COMPANY
289116
来自开发人员的回复 Sayadi Achraf 2024.09.12 16:14
Thank you for sharing your detailed experience with the Trend Screener and Trend Line Map Pro! It's fantastic to hear how these tools have been game changers for you, especially with your successful $200K challenge result in just 6 days! Your strategy of combining multiple timeframes—M1 for a heads up, M5 for entry and exit, and M15 for the overall trend—alongside the Trend Screener's multi-timeframe analysis, sounds like a solid approach to making informed trading decisions. I appreciate your honest advice about having a reliable trend-based strategy beforehand to maximize the benefits of these products. It's clear that the combination of the Trend Screener, Fuzzy Logic, and the Top Down Analysis has really helped streamline your process and provided that "Aha moment" in your trading journey. It's also inspiring to hear how the Trend Line Map Pro prompted you to explore swing trading opportunities with such great results. Thanks again for the valuable insights—this is very helpful for other traders considering these tools!
Matthew Nathan Brooks
199
Matthew Nathan Brooks 2024.09.04 19:24 
 

This is an amazing indicator. ive used it for 2 weeks on a demo on Gold and the results have been amazing. it took a couple days to get the setting right. but since then its been the best, will try on a demo for another 2 weeks. having a small issue with notification not coming to my phone all the time but thats not a big deal for me..

STE S.S.COMPANY
289116
来自开发人员的回复 Sayadi Achraf 2024.09.12 16:14
Thank you for your feedback! I'm glad to hear that you're having such a great experience with the indicator on your demo account with Gold. It’s awesome to know that once you fine-tuned the settings, it’s been delivering amazing results for you! As for the notification issue, we appreciate you bringing it to our attention. We'll definitely look into that to ensure a smoother experience. It’s great to see that it hasn’t been a major inconvenience for you, and I hope your continued testing over the next couple of weeks brings even more positive outcomes. Thanks again for sharing your experience!
waqarqureshi1
57
waqarqureshi1 2024.08.05 14:25 
 

Amazing

STE S.S.COMPANY
289116
来自开发人员的回复 Sayadi Achraf 2024.08.05 15:03
Thank you for taking the time to write your review, sir. My customer satisfaction is always our top priority.
Nagib Mahfuj Nayem
37
Nagib Mahfuj Nayem 2024.08.02 18:27 
 

This is really Insane. I just used only one week but more than 500 pips made with this indicator with only GOLD. And his support is really top notch. 100% Recommended.

STE S.S.COMPANY
289116
来自开发人员的回复 Sayadi Achraf 2024.08.02 18:29
Hi Mr. Nayem, Thank you for taking the time to write your review of our trend indicator. Since 2020, we have been committed to offering the best trend indicator for our customers, making MetaTrader a true trend analyzer. Wishing you good and safe trading!
Gimel Abayon Roda
334
Gimel Abayon Roda 2024.07.16 07:07 
 

I have been using this indicator to analyze the market trend. The dashboard is very useful in identifying the overall market direction. The CSM trend is useful in identifying the strong, weak and ranging currencies. I am using this in 15min timeframe. Though not recommended by the seller to use it in timeframes lower than 30mins, the indicator can still help generate positive pips, especially when you use it with support and resistance indicator.

STE S.S.COMPANY
289116
来自开发人员的回复 Sayadi Achraf 2024.07.16 12:20
Thank you for taking the time to write your review MR. Gimel. Since 2020, we have been working hard to keep improving our indicator to offer our customers the best indicator in the market to analyze market trends via many features. I invite you to check the list of all our free and premium indicators here: https://www.mql5.com/en/users/sayadi_lancer/seller
sami57
119
sami57 2024.07.08 23:04 
 

this is the best indicator i use

STE S.S.COMPANY
289116
来自开发人员的回复 Sayadi Achraf 2024.07.10 13:32
Thank you for taking the time to write your review MR. Sami. We are here to offer all the necessary support for our customers. Since 2020, we have been working hard to keep improving our indicator to offer our customers the best indicator in the market to analyze market trends via many features. I invite you to check all the list of all our free and premium indicators here : https://www.mql5.com/en/users/sayadi_lancer/seller
fatambouzid
47
fatambouzid 2024.05.16 01:35 
 

This is one of the best indicators I have seen ! Multitimeframe trend analysis for selected currency pairs, with a clear trend summary information; currency strength information, plus a trend simulator so you can verify and set your expectations right in terms of TP that is proven by historical signals and success rate statistics, etc. I am using both MT5 and MT4 versions of the indicator as the main signal source for all my trades with a very high success rate for a a week now. From one single chart I have clear visibility to the current market conditions.

Leroy Pastran
428
Leroy Pastran 2024.05.15 18:57 
 

Great HTF Trend Tool! Thanks for creating this system!

Erik
169
Erik 2024.03.25 10:10 
 

I haven't tested the indicator properly yet. But I give 3 stars for the great support. My questions were answered in a short time. Problems were solved quickly. Excellent. The indicator itself only gave me losses.

STE S.S.COMPANY
289116
来自开发人员的回复 Sayadi Achraf 2024.04.15 02:33
Thank you for taking the time to write your review MR. Erik. We are here to offer all the necessary support for our customers. Since 2020, we have been working hard to keep improving our indicator to offer our customers the best indicator in the market to analyze market trends via many features. I invite you to check all the list of all our free and premium indicators here : https://www.mql5.com/en/users/sayadi_lancer/seller
zakim1984
44
zakim1984 2024.03.19 02:44 
 

I'm using trend screener since a couple of months both MT4 and MT5 versions and its really a great indicator! The author also is very responsive and helpful..

STE S.S.COMPANY
289116
来自开发人员的回复 Sayadi Achraf 2024.03.19 02:48
Thank you so much sir , for your honest review and your kind words! You dont know how happy i am really you made my day! I wish you more success in your trading! The Trend Screener is the best All-In-One Trend Indicator ! I am really glad that i help and that I could bring some positivity in you trading in general! thank you so much again!
tunsam61
32
tunsam61 2024.03.19 02:01 
 

The trend screener is one of the best indicators in the market if followed correctly. I've had the indicator for 3 days and has greatly helped my ability to predict the market. The developer has excellent customer support and always willing to go extra mile to satisfy his customers and answer any questions. I will recommend this product for anyone who is interested in making money from the financial market.

STE S.S.COMPANY
289116
来自开发人员的回复 Sayadi Achraf 2024.03.19 02:58
Hi sir, Thank you for taking time to write your review. If you see the trend summary always Up Trend it means that you're MT4 is missing historical data. The trend summary will not give up trend for 15 instruments always. There is something wrong with the installation. I'm sending you now a private message asap to check this issue with you and assisting you to fix it and explain to you the best way to use trend screener indicator because you need to use the trend line for short terms trend and trend summary, just as a filter.
———————
Update: Can you check your private message please? I just sent you a message to assist you from there and ensure that you don’t get confused. Please let me know your feedback sir.
19990228
34
19990228 2024.02.22 14:02 
 

用户没有留下任何评级信息

STE S.S.COMPANY
289116
来自开发人员的回复 Sayadi Achraf 2024.02.22 14:13
Hi sir, Thank you for your review. I'm happy to know that you found our indicator an excellent Smart trend indicator that can assist you in analyzing the Properly market trend and improving your trade accuracy. I'm sending you now a private message to assist you from there.
burnoutnorthbowl1
55
burnoutnorthbowl1 2024.01.22 21:33 
 

I purchased this indicator only a few days ago and I can already tell it is very powerful if used correctly. Now I am going to get the map add on.

STE S.S.COMPANY
289116
来自开发人员的回复 Sayadi Achraf 2024.01.25 21:19
Thank you soo much for the honest review and the kind words.
We are working day and night to create the best advanced and professional tools in the market. That's the goal here and we can get there only if our standards are held high and professional as well!
Please have a good and safe trading.
DanyLbc747
880
DanyLbc747 2024.01.18 13:08 
 

I purchased Trend Screener based on reviews. I was a bit skeptical. Ultimately, this is by far the most used product I have ever used. The first month I tested it on a demo and today it's been more than 1.5 months that I've been using it daily on a live account. I wasn't as profitable before as I am now. I like to test other products as well, but this one captivated me already during the demo testing. The uniqueness is such that each trader will find his own way according to his style, whether it is scalping, day or swing trading. In essence, only this product is enough for you and you are taken care of. The author is very helpful. After the purchase, I also had a video call with him, where he explained the important steps. The author is above all human-friendly. Thank you for this product and a job well done by the author and his team.

STE S.S.COMPANY
289116
来自开发人员的回复 Sayadi Achraf 2024.01.18 16:55
Thank you for taking the time to write your review, sir. I'm doing my best to offer the best analytics tools for my customers. My customer's satisfaction is always my top priority. Have a good and safe trading, sir.
Victor L
63
Victor L 2024.01.11 17:23 
 

A wonderful discovery. This tool indicator offers multiple feedback features to alert how the market is moving and enables probable actions one could take. The continuous process instills confidence. The 1x1 service support from Sayadi surely makes it better.

Iulius65
152
Iulius65 2024.01.04 18:21 
 

I bought this amazing indicator three days ago, in this moment I just study how can I better use this tool. I intuit that after I discover how to use it, will have good return in manual trading. From now I am very enthusiastic.

smallwood1988
64
smallwood1988 2023.12.29 16:37 
 

Amazing Indicator, Author so helpfull and understanding. Worth the purchase

STE S.S.COMPANY
289116
来自开发人员的回复 Sayadi Achraf 2023.12.29 17:14
Thank you for taking the time to write your review. I'm happy to know that you found our indicator a good indicator to use during your trading and analyzing market trends with our smart scanner. -- Please have a good and safe trading.
SUYANTO_SE
193
SUYANTO_SE 2023.12.27 16:20 
 

Excellent product and prompt support. Highly recommend to have this indicator c/w Trend Line Map Indicator. Thank you very much Mr. Sayadi

hari2007
19
hari2007 2023.12.22 11:15 
 

Everything is good but wanted to check will this indicator works in autotrading using mt2trading and mx2trading for binary trading does it takes trades automatically following trendscreener indicator what are settings i need to do please help

STE S.S.COMPANY
289116
来自开发人员的回复 Sayadi Achraf 2023.12.22 12:14
Hi sir, Thank you for taking the time to write your review. I'm happy to know that you find our trend indicator as a good indicator to use it in your daily trading and analyzing market trends.
---
I'm sending a PM to check more details about what you want to achieve exactly.
Ferdinand Amahan
123
Ferdinand Amahan 2023.12.17 23:57 
 

One of the best TREND INDICATOR in the market. Highly recommended for seasoned and newbie alike..

回复评论
版本 21.10 2024.06.03
1. Improve signal quality.
2. Add Trend line period.
版本 20.10 2023.11.29
1. Change the Trend Scanner Layout by giving more flexibility in configuration to hide and display every column.
2. Add inputs to change timeframes for every column.
3. Optimize Trend breakout alerts and trend reversal alerts.
4. Add a period for the scanner to be adjusted for faster or slower trend calculation.
5. Change trend lines layout.
6. Optimize indicator setting.
7. Increase Scanner speed.
版本 19.21 2023.05.29
1. Fixing Spelling mistakes.
版本 19.20 2023.05.26
1. Optimize indicator speed.
2. Improve Trend CSM algorithm.
3. Improve Trend reversals dots.
4. Improve Strong Trend dots.
版本 19.3 2022.12.06
1. Improve indicator Speed for calculation with missing data.
版本 19.0 2021.08.29
1. Updating Alerts.
版本 18.1 2021.08.27
1. Adjusting signals design.
版本 18.0 2021.08.27
1. Add Strong Trend Signals.
2. Add Reversal Trend Signals.
3. Optimizing Trend Algorithm.
4. Add Scalper TP similator.
版本 16.30 2021.06.07
1. Optimizing Trend Dashboard for small timeframes.
版本 16.21 2021.05.08
1. Optimizing indicator speed.
版本 16.20 2021.04.18
1. Fixing issue with ultimate Screener EA.
版本 16.10 2021.04.18
1. Add support for Trend Screener Ultimate.
版本 16.0 2021.03.19
1. Add support to swing stoploss for Trend screener EA.
版本 15.80 2021.01.06
1. Add support to Trend Turbo EA
版本 15.60 2020.10.01
1. Add backtesting feature / Demo testing in the market.
版本 15.51 2020.08.22
1. Setting optimization.
版本 15.50 2020.08.22
1. Optimizing Suffix and prefix displaying.
版本 15.0 2020.07.29
1. Fixing the issue of Suffix / Current Chart Mode.
2. Buffers optimization for Eas.
3. Adjusting the default setting.
版本 13.0 2020.06.15
1. Fixing Fuzzy logic score issue in version 12.00.
版本 12.10 2020.06.07
Updates :

1. Add new Alert time ( GMT Or BROKER SERVER TIME or Local Computer time ).
2. Add Parameter to define Frequency of the Screener updating. ( Seconds )
3. Add Pairs manager: Display Screener based on Current Chart OR Display Screener based on Custom pairs List.
4. Hide - display button for the Success Rate Simulator.

Fixed issues :
1. Correcting button names.


版本 11.10 2020.04.18
1. Add a Spread feature.
版本 11.0 2020.04.14
1. Add enable-disable Button based on Customers requests.
版本 10.1 2020.04.09
1. Changing the default setting.
版本 10.0 2020.04.06
1. Add EAs Supporting with 3 methods.
版本 9.2 2020.04.01
1. Fixing issue with the default setting.
版本 9.1 2020.03.31
1. Optimization of Stoploss calculator.
版本 9.0 2020.03.31
1. Optimizing trend line signal.
版本 8.1 2020.03.19
1. Optimizing CSM updating timing.
2. Add enable-disable CSM.
版本 8.0 2020.03.17
1. Add Currency Strength Meter
版本 7.3 2020.03.13
1. Add Prefix and Suffix for pairs like "EURUSD.c"...etc.
版本 7.2 2020.03.10
1. Fixing display Success rate simulator.
版本 7.1 2020.03.07
1. Adjusting default colors.
版本 7.0 2020.03.07
1. Optimizing Fuzzy logic algorithm and Strong Trend identification.
2. Optimizing Alert generating in Strong Trend and Normal Trend.
3. Add feature to display trading type recommendation in Success Rate Simulator.
4. Add Max bars to Run Success Rate Simulator.
版本 6.11 2020.03.01
1. Correcting some spelling mistakes.
版本 6.10 2020.03.01
1. Add Hide-Display Second Box
版本 6.0 2020.03.01
1. Add TP levels and SL per level.
2. Add 2 options for Takeprofit
2.1 Floating TP with three Ratio.
2.2 TP simulator to find the best TP with the best success rate.
3. Add Chart change via Button in Trend Screener.
4. Optimizing button click event.
版本 5.50 2020.02.27
1. Add Arrows color feature.
版本 5.2 2020.02.26
1. Optimization refresher.
版本 5.1 2020.02.26
1. Fixing a refreshing issue.
版本 5.0 2020.02.25
1. Add max profit feature.
2. Optimizing trend line drawing.
版本 4.0 2020.02.21
1. Add Alerts Filters.
2. Add List of pairs to display all Currencies in the same charts.
3. Add metals, indices supporting.
版本 3.0 2020.02.20
1. Add symbols automatically to the MT4 MarketWatch.
版本 2.0 2020.02.16
1. Optimizing trend calculation.
2. Add Alerts features.
版本 1.70 2020.02.13
Fixing the EURUSD calculation issue.
版本 1.60 2020.02.13
1. Optimizing Fuzzy logic calculation.