Skynet Lasso


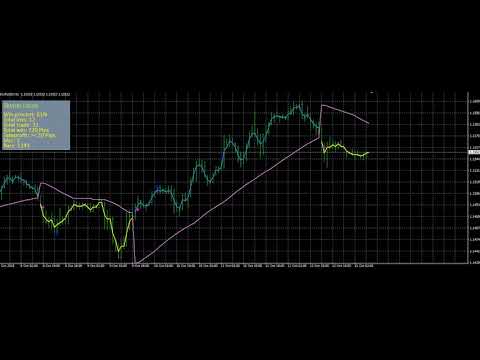
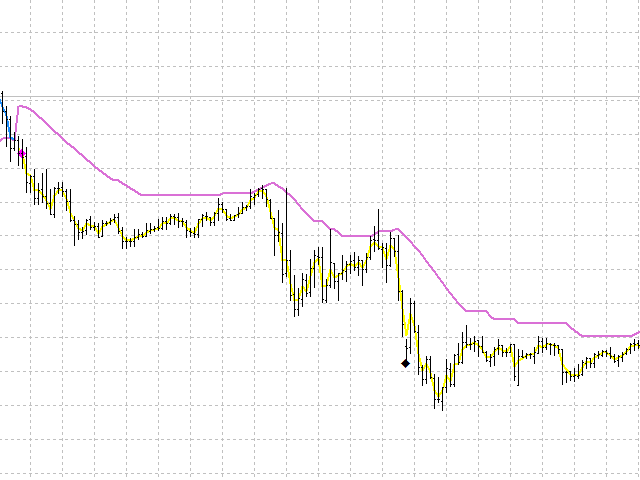
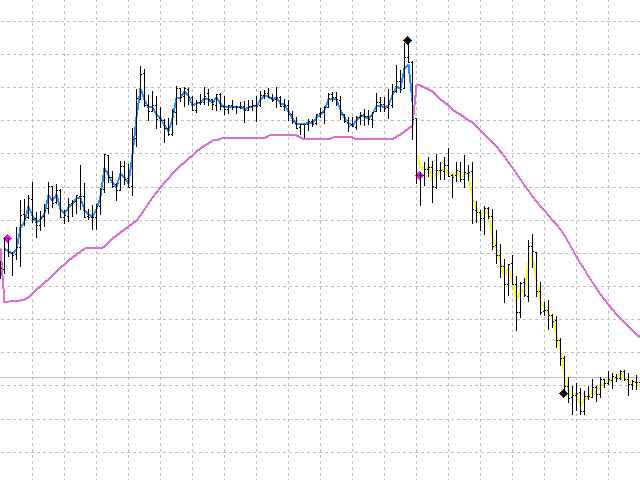
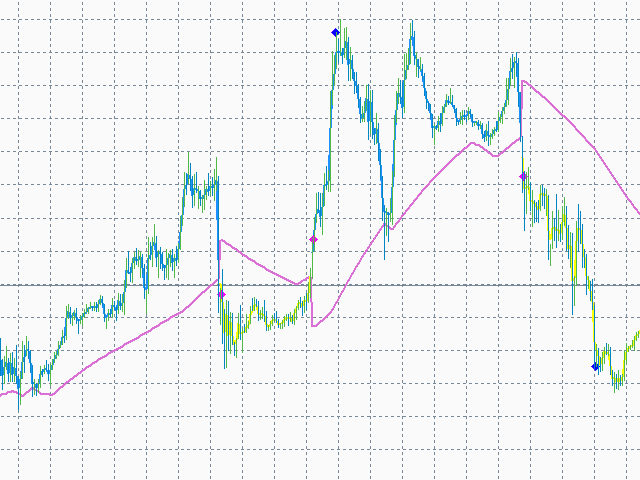
This indicator displays entry and exit points in the market. The indicator is based on Parabolic and various mathematical and statistical methods to increase profitability and reduce the number of losing trades. The indicator helps in many cases to skip false inputs, the support and resistance lines go around the price in a certain mode, reducing losses. The dashboard shows the results of the indicator so that you can adjust it more accurately and see how the parameters affect the result. The notification of entry and exit points comes to the phone. There are some ready for use sets in "comments" section.


Advantages

  • Skipping many false breakouts. The ability to choose the settings that will fit trend and flat at the same time. 
  • The signals are not redrawn.
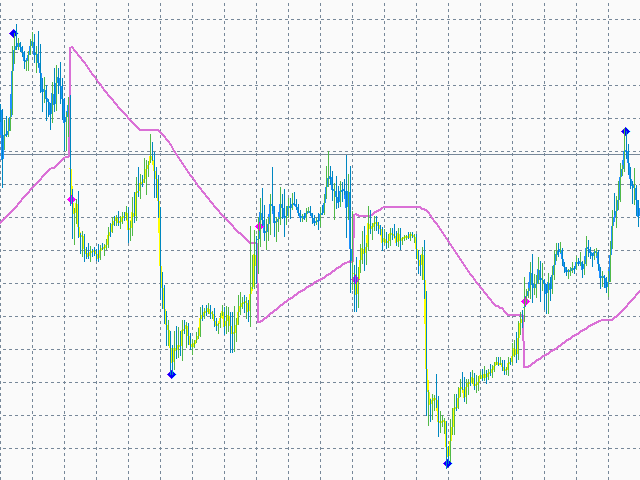
  • Visual display of bullish and bearish trend.
  • It is suitable for selecting very large and long trends without delay, characteristic of moving averages with large periods.
  • It clearly shows the profit in points, the number of successful and unsuccessful trades, the percentage ratio, and consecutive loss count.


Parameters

  • autodistance - automatic selection of the distance from the price to the entry point. The default value is 1; 1-Yes, 0-No;
  • distance - distance coefficient from the price to the entry point if the trend changes. The default value is 40;
  • velocity - coefficient for the rate of convergence with the price. The more coefficient - the more entry points. Values 1-5 are suitable for large areas of the trend. The default value is 10;
  • multiplier - coefficient for the limit of convergence with the price. The default value is 5;
  • smooth - smoothing line period. The default value is 2;
  • space - distance from the price at which the indicator line becomes horizontal. The default value is 5;
  • lasso - distance when lasso mode starts to operate (bypass false breakouts). The default value is 5;
  • q - lasso mode gain. The default value is 0.1;
  • cutoff - value for profit calculation in points (takeprofit). The default value is 5;
  • bars - the number of bars to calculate. The minimum value of 1000;
  • notification - send messages to the phone (Metaquotes ID). The default value is 1;
  • panel - it displays the dashboard. The default value is 1; 1-Yes, 0-No;
  • allbars - use all bars for calculation. The default value is 1; 1-Yes, 0-No;
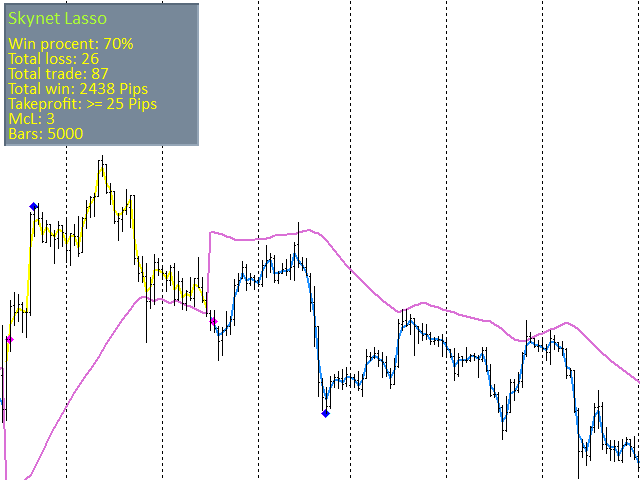
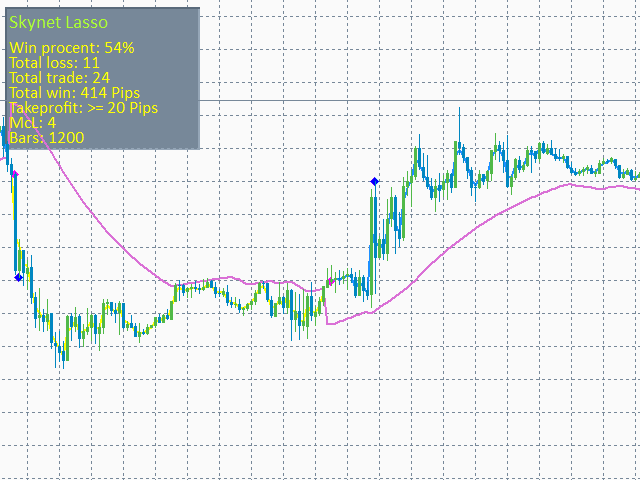

Information panel

The information panel displays the following information:

  • win percent - a ratio of profitable and losing trades in percent.
  • total loss - the total number of losing trades.
  • total trades - the total number of trades.
  • total win - the amount of profit in points for the number of candles.
  • takeprofit - the distance from the entry point to the high or low candle at which the profit is measured.
  • mcl - maximum number of losses in a row.
  • bars - the number of bars to calculate.

Additional information

The parameters in this indicator have a very strong influence on the definition of entry points into the market. The lasso and q parameters need to be fine-tuned to keep the balance between missing false breakouts and earlier entry when the price breaks. It is necessary to agree on the parameters so as to get the maximum profit in total win and the minimum value in mcl. For flat the space parameter is very important, which turns the indicator line into a support/resistance line. The space parameter should be selected empirically to find the best inputs and identify long-term trends. The mcl is important for using the indicator for trading on the martingale principle, where the minimum series of losses plays an important role. 

The distance parameter settings can be for M1: 5, M5: 10, M15: 25; M30: 50; H1: 100; H4: 200; D1: 500. It is better to use on M15, H1, H4, D1. You can use autodistance if it is too complex to find a good value.

The indicator works only with closed bars, volume and tick data are not taken into account when calculating values.


推荐产品
Ict Gold Scalper
Alex Amuyunzu Raymond
ICTVALID EA – Smart Money Concepts Automated Trading The ICTVALID EA is a professional trading system built on Smart Money Concepts (ICT methodology) . It automatically detects and trades institutional setups, allowing you to follow market structure with precision and consistency.  Key Features Dual Trading Modes – Choose between Scalping (short-term precision entries) or Swing Trading (longer-term trends). Smart Money Logic – Incorporates Change of Character (CHoCH), Break of Structure (BoS),
Upgrade your charts instantly. Smart Round Levels draws powerful .00 and .50 round-number zones automatically on  any forex pair — including  JPY pairs  like USDJPY — and features a dynamic  live price tracker  that follows price in real time. Features: • Automatic round-number detection (.00 & .50) • Auto-adjusts for JPY and non-JPY pairs • Perfect precision with customizable spacing & scale • Fully customizable colors, line widths, font sizes • Real-time yellow price label tha
Fusion Cross
Adolfina Denysenko
Fusion Cross 是一款适用于 MetaTrader 4 的现代箭头指标,融合了多种成熟工具的优势。 WPR(威廉姆斯百分比范围); RSI(相对强弱指数) 这些工具的组合能够生成高度精准的市场入场信号,有效过滤虚假信号,仅显示趋势反转或延续概率较高的关键点位。 核心功能: 图表上直接显示清晰的买入/卖出箭头信号 即时通知 声音警报 电子邮件 手机推送通知 ️自定义信号触发时机:可选择在K线开盘时或收盘后触发(通过参数设置)。 适用于任意周期和货币对。 操作简易:安装后即可直接跟随信号进行交易。 工作原理: 指标通过 WPR 指标追踪超买/超卖状态。 借助RSI指标过滤虚假信号。 当市场即将上涨时,会出现蓝色向上箭头; 红色向下箭头则提示可能下跌。 Fusion Cross 因此能够帮助交易者提前捕捉趋势反转或延续的信号。 核心优势: 信号永不重绘(箭头位置固定不变); 兼容短线剥头皮与中期交易策略 多货币支持,适用于所有交易品种(包括但不限于: 外汇、黄金、指数、加密货币)。
F ully automated Expert Advisor using the  advanced   algorithm for trading the EURUSD Designed for profit in a short period of time and big profit in a long run. Prefers EURUSD 1H. Principle of operation The SELL and BUY orders are opened (depending on the parameters set), guided by signals and the market situation.     Recommended parameter: Use an ECN broker account. minimum deposit of 100$ USD. use it in H1 time frame recommended symbol is EURUSD input parameter: TrendType                 
OB Breakout is alert indicator that identifies when a trend or price move is approaching exhaustion(Supply and Demand) and ready to reverse. It alerts you to changes in market movement which typically occur when a reversal or major pullbacks are about to or have happened. The indicator identifies breakouts and price momentum initially, every time a new high or low is formed near a possible Supply or Demand level point. The indicator draws in a rectangle on Supply or Demand Zones.   Once price we
Wolfe Wave Scanner MT4
Reza Aghajanpour
4.64 (11)
**  All Symbols  x  All Timeframes  scan just by pressing scanner button ** *** Contact me  to send you instruction and add you in "Wolfe Wave Scanner group" for sharing or seeing experiences with other users. Introduction: A Wolfe Wave is created with five-wave patterns in price. It shows supply and demand and a fight towards a balance price. T hese waves of price actions can help traders identify the boundaries of   the trend . Also  It helps forecast how the price will move in the near future
El indicador "MR BEAST ALERTAS DE LIQUIDEZ" es una herramienta avanzada diseñada para proporcionar señales y alertas sobre la liquidez del mercado basándose en una serie de indicadores técnicos y análisis de tendencias. Ideal para traders que buscan oportunidades de trading en función de la dinámica de precios y los niveles de volatilidad, este indicador ofrece una visualización clara y detallada en la ventana del gráfico de MetaTrader. Características Principales: Canal ATR Adaptativo: Calcula
供求区关键价指标 背景 系统自动搜索 K 线中的供求区域,并画出实时的关键价格线,交易者可以根据价格交易线进行交易。 主要特点 系统是自动搜索 K 线中的供求区域的,系统同时会画出实时的关键价格线,交易者可以根据价格交易线进行交易。所以使用供求区策略的交易员无需再耗费时间去寻找标识供求区域,而可以关注在价格对供求区域以及关键价格的反应,制定适合自己的交易策略。 然而供求区策略本身就是一个在震荡时期更加有效的策略,所以当市场呈现强大趋势的时候,应当小心使用,或者按顺应趋势的方向使用指标提供的建议。   范围 ShowZones :是否显示供求区域 DrawLines: 是否显示关键价格 SupplyZoneLineColor: 供给区价格线颜色 DemandZoneLineColor: 需求区价格线颜色 PenatratedLineColor: 被击穿价格线颜色   执行 只需将指标附加到图表上即可。 请给我您宝贵的意见,让我改进指标。 如有问题,联系微信 imlizard
Millennium EA
Vladimir Pleshakov
The scientific approach to trading and responsible development are the main principles of  Millennium  EA. In order to create this EA, a research work was done in the field of trading. Dow theory, the theory of fractal analysis, the methods of Bill Williams and other traders, all this served as the theoretical basis for the advisor, which is designed to automate trading decisions. Signals: https://www.mql5.com/en/signals/1748354 https://www.mql5.com/en/signals/1748359 https://www.mql5.com/en/sig
MA Acceleration mp
DMITRII GRIDASOV
Crypto_Forex 指标移动平均线加速度适用于 MT4,无需重绘。 MA 加速度 - 是剥头皮指标,设计为“MA 速度”指标的辅助工具 - 该指标的计算基于物理方程。它将向您显示移动平均线的加速度。 - 有很多机会使用 MA 加速度升级标准策略。它可以用于 SMA、EMA 和 LWMA。 - MA 加速度是相应移动平均线的二阶导数。 - 指标显示 MA 速度指标改变其值的速度。 - 如果 MA 加速度指标的值 < 0:MA 速度在看跌方向上增加;如果 MA 加速度指标的值 > 0:MA 速度在看涨方向上增加。 - 建议在主要趋势方向的快速剥头皮策略中将 MA 加速度指标与 MA 速度指标一起使用,如果 MA 速度指标的值 < 0:趋势下降;如果 MA 速度指标的值 > 0:趋势上升。 - 上升趋势:一旦 MA 加速度 >0,开启买入剥头皮交易。 - 下降趋势:一旦 MA 加速度 <0,开启卖出剥头皮交易。 参数: 1) Period_V:相应 MA 速度指标的周期。建议值为 3 到 7。 2) Period_ACC:加速周期。建议值为 2 到 12。Period_ACC
Trend Map
Maryna Shulzhenko
The Trend Map indicator is designed to detect trends in price movement and allows you to quickly determine not only the direction of the trend, but also to understand the levels of interaction between buyers and sellers. It has no settings and therefore can be perceived as it signals. It contains only three lines, each of which is designed to unambiguously perceive the present moment. Line # 2 characterizes the global direction of the price movement. If we see that the other two lines are above
TradeHistoryMapper EA
Dora Nafwa Mwabini
使用 TradeHistoryMapper 可视化您的交易优势 每位成功的交易者都深知:交易历史记录是您未来盈利的关键。 TradeHistoryMapper 将您的账户历史记录转化为强大的可视化地图,精准展示您的盈利点、亏损点以及如何改进。 既然您可以在图表上直接查看每笔交易,何必费力地翻阅无尽的账户历史记录标签呢? 1. 清晰的彩色编码,即时显示盈利和亏损交易 2. 分析多个交易品种和时间范围的表现 3. 跟踪已平仓和当前持仓,获得全面洞察 4. 一目了然地发现入场和出场的规律 5. 设置简单——连接、运行,即可查看您的历史记录 无论您是想了解自身交易习惯的初学者,还是寻求更深入分析的资深交易者,TradeHistoryMapper 都能帮助您发现哪些交易有效,哪些无效,从而让您自信地优化策略。 停止猜测。立即绘制图表。让交易历史记录成为您的优势。 有了 TradeHistoryMapper,您不仅可以回顾历史记录,还能解锁通往更佳决策、更精准入场和更高利润的路线图。切勿盲目交易。投资于清晰的思路,投资于您的优势。 立即购买 TradeHistoryMapper,开
DivirgentMAX
Mikhail Bilan
Indicator without redrawing Divergent MAX The DivirgentMAX indicator is a modification based on the MACD. The tool detects divergence based on OsMA and sends signals to buy or sell (buy|sell), taking into account the type of discrepancies detected. Important!!!! In the DivirgentMAX indicator, the optimal entry points are drawn using arrows in the indicator's basement. Divergence is also displayed graphically. In this modification of the MACD, the lag problem characteristic of its predecessor i
Shock Wave
Camila Bernardez Camero
Shock Wave Signal – 无重绘、无延迟、无回溯绘制 Shock Wave Signal 利用极端的 CCI 指标读数,精准识别任意周期的强势动量反转。当价格触及预设的超买或超卖水平时,即在 K 线收盘时生成简明的入场信号。 逻辑 该指标在每根已收盘的 K 线上,计算 5 周期的商品通道指数(CCI),最多回溯 600 根 K 线。当 CCI 超过 +165,即刻触发买入信号;当 CCI 低于 -165,则触发卖出信号。此阈值过滤仅保留最强烈的价格波动。 信号定位 买入标记绘制在触发信号的 K 线最高点,卖出标记绘制在最低点。每个箭头仅在 K 线收盘时绘制一次,且保持固定,不依赖未来数据,故无重绘、无回溯绘制,唯一的延迟仅为收盘后处理时间。 周期适用性 Shock Wave Signal 兼容 M1 至 MN1 各周期,但在 H1 和 H4 上表现最佳,此时 CCI 极值通常对应显著趋势转折。低周期同样可捕捉动量爆发,但信号频率会相应增加。 性能 采用优化的 MQL4 实现,脚本通过静态 last_bar 检查避免冗余计算,仅更新两个简单缓冲区,如无新收盘即刻退出。即便启
Mastodon
Yvan Musatov
Mastodon - displays potential market entry points. According to the wave theory, Mastodon displays the course of a large wave, while the oscillator can specify the entry point, that is, catch the price movement inside it, i.e. small “subwaves”. By correctly understanding the wave nature of price movements and using the Mastodon indicator in conjunction with an oscillator, you can create your own trading system, for example, entering the market after a large wave has formed and then exiting whe
Italo Trend Indicator
Italo Santana Gomes
4.76 (33)
BUY INDICATOR AND GET EA FOR FREE AS A BONUS + SOME OTHER GIFTS! ITALO TREND INDICATOR  is the best trend indicator on the market, the Indicator works on all time-frames and assets, indicator built after 7 years of experience on forex and many other markets. You know many trend indicators around the internet are not complete, does not help, and it's difficult to trade, but the Italo Trend Indicator is different , the Italo Trend Indicator shows the signal to buy or sell, to confirm the signal t
DMAX pro
Danny Teoh Kok Keong
DMAX SIGNAL IS VERY POWERFUL TOOL TO HELP YOU ENTRY,ITS CAN DETECT OVERSOLD AND OVERBOUGHT IN FOREX MARKET. ITS CAN TRADE 24 FOREX PAIR IN MARKET, 80% ACCURATE RESULT. MANY TRADER FAIL BECAUSE OF ENTRY POINT AND EXIT POINT , SIGNAL OF DMAX WILL GIVE VERY GOOD SIGNAL TO LET YOU KNOW WHERE TO ENTRY AND EXIT.  RISK MANAGEMENT IS VERY IMPORTANT IN TRADING FOREX, PLEASE DONT RISK OVER 5% PER TRADE IS FORE MARKET
RSI TrendLine Divergency Message is an indicator for the MetaTrader 4 trading platform. Unlike the original indicator, this three in one version has a system of alerts that inform on market situation changes. It consists of the following signals: when the Main line crosses the levels of extreme zones and 50% level; when the Main line crosses the Trend line in the indicator window; divergence on the last bar. Parameters of levels of extremum, 50-level and divergence are adjustable. Parameters La
OBV Scalper Gold
Ignacio Agustin Mene Franco
OBV Scalper GOLD MT4 Description OBV Scalper GOLD is a professional Expert Advisor specifically designed to trade XAU/USD (Gold) using the On Balance Volume (OBV) indicator to detect divergences and high-probability scalping opportunities. The EA automatically identifies bullish and bearish divergences between price and volume, placing strategic pending orders with integrated risk management and dynamic trailing stops. ️ Technical Specifications Recommended Pair: XAU/USD (Gold) Timeframe:
This is a combination of multiple oscillators into a single divergence system that creates the impression of a more reliable divergence indicator. It is multi-currency based and works best on 15 minutes timeframe and above. Every time a signal is generated, it shows an alert to the user. It is more ideal if combined with other price action indicators or trading systems.
Reback
Yazhou Liu
本指标可回溯历史交易,可以一目了然的看到交易位置,交易类型及盈亏情况,还有统计信息。 showlabel用于是否显示统计信息,summary_from是订单统计的开始时间,该参数以订单开仓时间为准。 回溯历史可以帮助我们纠正曾经错误的交易习惯,对于学习手动交易的新手极为重要。 本指标适用于各个时间周期,通过交易标识和划线能非常明显地看出各个订单的具体交易情况,可作为信号卖家的辅助工具使用。         即使加载到当前图标中也能实时看到当前订单的下单位置及盈亏情况。        即使加载到当前图标中也能实时看到当前订单的下单位置及盈亏情况。 本指标可回溯历史交易,可以一目了然的看到交易位置,交易类型及盈亏情况,还有统计信息。 showlabel用于是否显示统计信息,summary_from是订单统计的开始时间,该参数以订单开仓时间为准。 回溯历史可以帮助我们纠正曾经错误的交易习惯,对于学习手动交易的新手极为重要。 本指标适用于各个时间周期,通过交易标识和划线能非常明显地看出各个订单的具体交易情况,可作为信号卖家的辅助工具使用。
FFx CCI Divergences
Eric Venturi-Bloxs
The purpose of this new version of the MT4 standard indicator provided in your platform is to display in a sub-window multiple timeframes of the same indicator with its divergences. See the example shown in the picture below. But the display isn't like a simple MTF indicator. This is the real display of the indicator on its timeframe. Here's the options available in the FFx divergences indicator: Select the timeframes to be displayed (M1 to Monthly). Define the width (number of bars) for each ti
TSO Top Bottom Divergence MACD
Dionisis Nikolopoulos
5 (1)
This indicator combines double bottom and double top reversal chart patterns together with detection of divergences between the price chart and the MACD oscillator. Features Easily detect strong reversal signals Allows to use double top/bottom and MACD divergence signals combined or independently Get email and/or push notification alerts when a signal is detected Custom colors can be used The indicator is not repainting Can easily be used in an EA (see below) Inputs ENABLE Double Top - Bottom:
CapTaiNCAT
Nyamsuren Boldbaatar
CapTaiNCAT FullAutomated expert advisor. TimeFrame M1 M5 SET FILES;  https://www.mql5.com/en/market/product/38300#!tab=comments&comment=11565247 Recommendations Before using the EA on a real account, test it with minimal risk or on a demo account; Use VPS server with ping less 10ms; ECN account with low spreads + low commissions + quality execution;  Standard settings are optimized for EURUSD GBPUSD AUDUSD USDCAD USDJPY USDCHF XAUUSD  The settings of the EA  Trade Manager  Magic Number  Slippa
ShinZuka
Muhammad Asyraf Bin Mohamad
Using MACD value for direction. Using RSI as reversal indicator. Using open trading hour. (Recommend Hour 10,11,15 & 19 : MT4-Time) Counter trade if signal failed. Cutloss trade if signal failed. Auto lot calculate based on target profit & takeprofit. Able to set counter trade value. Suitable for commodities & currency.  Timeframe H1. Able to set limit lot open. Able to select day to trade.
Gets
Andrey Kozak
Gets is a smart trading system with complex market analysis mechanism. The operation principle of Gets is based on neural networks and diversified collection of information from various market analyzers. Then the system analyzes the statistical databases to create a general idea of the current market situation and the further price movement. The information is displayed on the screen in a simple and intuitive way - in the form of buy and sell arrows. Also, the information on the current trend st
GeoWprPro
Georgij Komarov
WPR by Profile, or WPR for Professionals Geo_WprPro is one of the well-known currency profile indicators. It simultaneously displays two WPR indicators with different parameters in the matrix form on all timeframes of multiple currency pairs forming the currency profile . As follows from the description, " WPR is a leading indicator that often goes ahead of the price chart. The oscillator frequently reaches extreme values before the price reversal as if anticipating that event: it almost always
FairyFibo
Syed Oarasul Islam
FairyFibo  can generate as many as 70 different BUY signals and 70 different SELL signals solely based on Price Action and Fibonacci levels. The idea is to catch as many as Swing High's and Swing Low's but with the consideration of the current trend mind. This indicator can be also used for Binary Options Trading as most of the time price tends to follow the signal direction immediately. Most of the strategies are already optimized for different time frames and different market conditions. While
Before
Nadiya Mirosh
The Before indicator predicts the most likely short-term price movement based on complex mathematical calculations. Most of the standard indicators commonly used in trading strategies are based on fairly simple calculations. This does not mean that there were no outstanding mathematicians in the world at the time of their creation. It is just that computers did not yet exist in those days, or their power was not enough for the sequential implementation of complex mathematical operations. Nowad
True SnD
Indra Lukmana
5 (1)
This Supply & Demand indicator uses a unique price action detection to calculate and measures the supply & demand area. The indicator will ensure the area are fresh and have a significant low risk zone. Our Supply Demand indicator delivers functionality previously unavailable on any trading platform. Trading idea You may set pending orders along the supply & demand area. You may enter a trade directly upon price hit the specific area (after a rejection confirmed). Input parameters Signal - Set
该产品的买家也购买
Meravith
Ivan Stefanov
5 (1)
该指标从每个点分析成交量,并计算该成交量的市场疲劳水平。 它由三条线组成: 牛市成交量疲劳线 熊市成交量疲劳线 表示市场趋势的线。该线根据市场是熊市还是牛市变化颜色。 您可以从任何选择的起点分析市场。一旦达到成交量疲劳线,确定一个新的起点来开始下一次分析。 您可以分析任何内容——趋势和修正。一个好的方法是每次当它达到趋势线或形成顶部或底部时移动指标。 趋势线与某一成交量疲劳线之间的距离越大,说明该方向的成交量越大。 趋势线可以作为开单的位置,而疲劳线则用于收集利润。 该系统非常独特,但又极其直观。 市场上没有类似的产品。 使用没有限制。可以在所有市场和所有时间框架中应用。 重要提示:在MetaTrader4测试器中检查时,双击紫色线条,然后左右移动它以分析市场。 如有任何问题,请随时联系我。
RelicusRoad Pro
Relicus LLC
4.63 (106)
您有多少次购买了一个交易指标,它拥有 出色的回测 、 实盘账户表现证明 以及惊人的数据和 无处不在的统计数据 ,但使用后您却 最终爆仓 ? 您不应该只相信一个信号本身,您需要知道它最初为何出现,而这正是 RelicusRoad Pro 最擅长的! 用户手册 + 策略 + 培训视频 + 带 VIP 权限的私人群组 + 提供移动版本 一种全新的市场视角 RelicusRoad 是外汇、期货、加密货币、股票和指数领域 全球最强大、最好的交易指标 ,为交易者提供 账户增长 所需的所有信息和工具。我们提供 技术分析 和 交易计划 ,帮助 每一位交易者成功 ,无论是 初学者 还是 高级交易者 。 它是一个 关键交易指标 ,提供足够的信息来 预测 未来市场。我们相信一个 完整的解决方案 ,而不是图表上几个毫无意义的不同指标。这是一个 一体化指标 ,显示 信号 、 箭头 + 价格行为 信息,这些信息 无与伦比 且 非常准确 。   RelicusRoad 利用机器学习(AI)技术,为交易者提供必要的信息和工具,帮助他们成为成功且消息灵通的交易者。   利用领先指标预测未来价格 几乎 所有技术指标
Dynamic Scalper System
Vitalyi Belyh
5 (1)
“ Dynamic Scalper System ”指标专为在趋势波内进行剥头皮交易而设计。 已在主要货币对和黄金上进行测试,并可与其他交易工具兼容。 提供顺势短线建仓信号,并提供额外的价格变动支持。 指标原理: 大箭头决定趋势方向。 在趋势波内,我们采用一种生成小箭头形式的剥头皮交易信号的算法。 红色箭头代表看涨方向,蓝色箭头代表看跌方向。 敏感的价格变动线会沿着趋势方向绘制,并与小箭头信号协同作用。 信号运作方式如下:当线在适当时刻出现时,将形成入场信号;在出现线时,持仓;线完成后,平仓。 建议的操作时间范围为M1 - H4。 箭头在当前K线上方形成,如果下一根K线已开仓,则不会重新绘制上一根K线上方的箭头。 输入参数 Trend Wave Period - 趋势方向(大箭头)的周期,改变趋势波的时间间隔。值 1 表示趋势方向的最长持续时间,参数值越大,持续时间越短。 Scalper Arrows Period - 信号箭头(小箭头)的计算周期,改变入场信号的生成频率。值 3 表示最频繁的生成频率,参数值越大,箭头频率越低,准确度越高。 这些参数可以根据不同的时间范
The Nihilist 5.0 Indicator includes Forexalien and Nihilist Easy Trend trading strategies and systems. It is composed of an MTF Dashboard where you can analyze the different input possibilities of each strategy at a glance. It has an alert system with different types of configurable filters. You can also configure which TF you want to be notified on your Metatrader 4 platform and Mobile application The indicator has the option to view how could be a TP and SL by using ATR or fixed points, even w
The BB Reversal Arrows technical trading system has been developed to predict reverse points for making retail decisions. The current market situation is analyzed by the indicator and structured for several criteria: the expectation of reversal moments, potential turning points, purchase and sale signals. The indicator does not contain excess information, has a visual understandable interface, allowing traders to make reasonable decisions. All arrows appear to close the candle, without redrawin
OrderFlow Absorption – 專業級MT4買賣差與吸收訊號指標 釋放真正訂單流分析的力量,OrderFlow Absorption 是MetaTrader 4上最強大的買賣差(Delta)直方圖與吸收訊號指標。專為想看清每一個價格波動背後真相的交易者設計,這個工具揭示了隱藏的買賣壓力與推動市場的吸收事件。 功能特色 買賣差直方圖視覺化:   以清晰的色彩直方圖即時顯示買方與賣方壓力。 吸收訊號偵測:   先進邏輯自動辨識多空吸收事件,及早預警潛在反轉。 圖表標記:   吸收訊號直接標示於主圖表,方便視覺辨識。 彈出式警報:   新吸收訊號出現時即時通知。 自訂門檻:   過濾弱訊號,專注高勝率機會。 資源管理:   高效運算,適用於大型圖表也能流暢運行。 全品種兼容:   適用於任何商品與週期,包括外匯、指數、商品等。 簡易整合:   參數簡單,快速上手與調整。 OrderFlow Absorption 的邏輯說明 OrderFlow Absorption 採用專利演算法,能在沒有完整Tick數據的情況下,估算每根K棒的買賣壓力(Delta)。它分析成交量、價格行為、K
GoldRush Trend Arrow Signal
Kirk Lee Holloway
5 (2)
GoldRush 趨勢箭頭信號 GoldRush 趨勢箭頭信號 指標為 XAU/USD 中的高速、短期短線交易者提供精確、實時的趨勢分析。 專為1分鐘時間框架設計,此工具顯示方向箭頭以明確顯示入場點,使短線交易者能在波動市場中自信操作。 該指標包含主要和次要警示箭頭。主要信號為白色和黑色方向箭頭,用於指示趨勢方向的轉變;次要信號為藍色和紅色箭頭,用於確認主要箭頭指示的方向並提示潛在交易入場點。 注意:當趨勢方向發生變化後僅出現一個主要警報箭頭時,請注意可能會出現多個次要藍/紅箭頭。次要信號將在滿足信號標準的任何蠟燭圖後出現,因此在長期趨勢移動中,螢幕上將顯示大量次要箭頭(如附帶的截圖所示)。您可在設置中開啟或關閉任一箭頭類型。 以下是我使用此指標進行交易的方式: - 對於買入入場,我會耐心等待白箭頭在蠟燭收盤時出現,並在下一根可用蠟燭收盤時出現藍箭頭時進行買入交易。 - 對於賣出入場,我會耐心等待黑箭頭在蠟燭收盤時出現,並在下一根可用蠟燭收盤時出現紅箭頭時進行賣出交易。 - 獲利了結/止損設置由使用者自行負責,但我個人使用最低R:R為1:2,並發現這在倫敦/紐約開盤等
ATC AlgoZone Indicator
Ameur Boudenne
5 (2)
Algo Trading Indicaor  With this indicator , you’ll have zones and trends that hight probability the price will reverse from it. so will gives you all the help that you need  Why should you join us !?  1-This indicator is logical since it’s working in previous days movement , to predict the future movements. 2-Algo trading indicator will help you to draw trends which is special and are too strong than the basics trend , trends will change with the frame time that you work on . 3-We can use
Rtc ML Ai Predictor MT4
Muhammad Faisal Sagala
Product Description Rtc ML Ai Predictor — Futuristic Intelligence for Real-Time Market Decisions Bring robotic precision to your trading.   Rtc ML Ai Predictor   fuses   Machine Learning   with   SMA-shift dynamics   to forecast short-term momentum and trend inflection points with clarity. The model evaluates multi-factor market structure, assigns a   confidence score   to each signal, and lets you act only when conditions align with your rules. Why traders choose Rtc ML Ai Predictor AI-guided e
ECM Elite Channel is a volatility-based indicator, developed with a specific time algorithm, which consists of finding possible corrections in the market. This indicator shows two outer lines, an inner line (retracement line) and an arrow sign, where the channel theory is to help identify overbought and oversold conditions in the market. The market price will generally fall between the boundaries of the channel. If prices touch or move outside the channel, it's a trading opportunity. The ind
Wall Street Indicator – 您的交易成功之钥! 厌倦了那些承诺很多却无法交付结果的工具?专为MT4设计, Wall Street Indicator 是提升您交易水平的终极解决方案。该指标经过精心开发,可提供清晰、可靠且精准的信号。以下是为什么 Wall Street Indicator 是初学者和经验丰富交易者的理想选择: 无与伦比的性能 – 经验证的结果 1年详细回测: 令人印象深刻的 90% 胜率 ,此指标在盈利能力上表现出了可靠性。在总共7006个信号中, 6242个是盈利的 ,每个信号平均收益为 29点 。 极低的亏损率: 仅 10% 的信号导致亏损,显示出算法的准确性和质量。 主要特点 无重绘(No Repaint): 信号生成后不会改变,确保完全透明。 无延迟(No Lagging): 实时捕捉市场机会,计算速度快如闪电。 无历史篡改(No BackPrint): 信号是固定的且可靠,完全值得信赖。 无与伦比的精确性 凭借先进算法,该指标提供: 精确的进场点: 完美定位以充分利用市场波动。 清晰的高低点: 最大化利润,同时将损失降至最低。 在波动市场中
BinaryUniversal
Andrey Spiridonov
BinaryUniversal is a signal indicator for binary options and Forex. In its work, the indicator uses a complex algorithm for generating signals. Before forming a signal, the indicator analyzes volatility, candlestick patterns, important support and resistance levels. The indicator has the ability to adjust the accuracy of the signals, which makes it possible to apply this indicator for both aggressive and conservative trading. The indicator is set in the usual way, it works on any time period and
Introduction to X3 Chart Pattern Scanner X3 Cherart Pattern Scanner is the non-repainting and non-lagging indicator detecting X3 chart patterns including Harmonic pattern, Elliott Wave pattern, X3 patterns, and Japanese Candlestick patterns. Historical patterns match with signal patterns. Hence, you can readily develop the solid trading strategy in your chart. More importantly, this superb pattern scanner can detect the optimal pattern of its kind. In addition, you can switch on and off individu
"Dragon's Tail"是一种综合交易系统,而不仅仅是一个指标。这个系统以分钟为单位分析每一个蜡烛,这在市场波动性高的情况下特别有效。 "Dragon's Tail"系统确定市场的关键时刻,称为"公牛和熊的战斗"。基于这些"战斗",系统给出交易方向的建议。在图表上出现箭头的情况下,这表明有可能在指示的方向上开设两个交易。黄线和绿线分别作为第一和第二个交易的获利水平。在达到黄线水平并关闭第一笔交易后,建议在第二笔交易开启的水平上设定止损。 时间框架和工具的选择取决于交易员的偏好,但为了达到最佳结果,建议使用H4和D1的时间框架,并考虑所选工具的差价大小。 "Dragon's Tail"的设置参数可以分为两组: 直接影响交易结果的参数: 历史深度 - 只影响图表上入口点的显示。推荐值:D1 - 10,H4 - 15,H1 - 20。 获利1和获利2 - 影响最终结果。取决于时间框架的推荐值:D1 - 250/450,H4 - 150/250,H1 - 75/150。 负责系统视觉设计的参数。可以根据交易员的意愿进行设置。 重要的是要记住,"Dragon's Tail"是一个需要交易员
Super Signal – Skyblade Edition 專業級無重繪 / 無延遲趨勢信號系統,擁有卓越勝率 | 適用於 MT4 / MT5 核心特色: Super Signal – Skyblade Edition 是一套專為趨勢交易設計的智能信號系統。 其採用多重濾波邏輯,僅篩選出具有明確方向性、動能強勁且波動結構健康的走勢進場點。 本系統 不預測高點或低點 ,只有在同時滿足以下三項條件時才會觸發交易信號: 趨勢方向明確 動能持續增強 波動率結構穩定 此外,系統還結合市場流動性分析,以進一步提升信號的準確性與觸發時機。 信號特性: 所有箭頭信號皆為 100% 無重繪,無延遲 信號一旦出現即固定於圖表,不會閃爍或消失 提供圖表箭頭、資訊面板、彈出通知、聲音提示及推播訊息 支援 EA 呼叫(Buffer 輸出),可整合至自動化交易或信號跟單系統 提供預設參數模板,免調整即可使用,適合新手快速上手 所有數據皆採用「嚴格回測標準」——每筆交易訊號在觸發後的 60 根 K 線內, EURUSD 與 USDJPY 至少須達成 +50 點獲利,黃金(XAUUSD)則須達成 +100 點
Hit Rate Top Bottom Signal
Martin Alejandro Bamonte
命中率顶部底部信号 命中率顶部底部信号 命中率顶部底部信号 提供了一种完全创新的方法。 它非常适合那些希望预先评估信号在特定 TP-SL 下的表现以及在哪些货币对/时间框架(TF)中效果最佳的人。 命中率顶部底部信号 策略是 任何交易员和任何交易类型 的重要工具,因为它不仅发出 精确且不重绘的信号 ,明确指示何时交易以及交易方向,而且还 详细记录每个货币对和时间框架的命中率 ,并预设止盈(TP)和止损(SL)。 这使得能够提前知道信号的有效性比率 ,对于良好的风险管理和精确的交易至关重要。 该策略的独特之处在于它专注于在波动的反转点进行检测,而不是在整个行情中,这使得信号的发出频率比传统的顶部底部信号更高,专注于 市场每一个重要波动的关键时刻。 这种以百分比显示 信号历史效果与SL/TP比率结合的能力 使得这项策略成为安全交易的最佳选择,让交易员能够基于数据做出决策。 依靠一个不仅清晰直接而且历史记录良好的信号,我们正在使用市场上最好的策略之一。 如何使用该系统进行交易? 打开多个货币对并在每个货币对上加载指标。现在,分析每个货币对,以确定哪些货币对和时间框架(TF)信号效果
Gold Channel XAUUSD
Paulo Rocha
5 (4)
Gold Channel is a volatility-based indicator, developed with a specific timing algorithm for the XAUUSD pair, which consists of finding possible corrections in the market. This indicator shows two outer lines, an inner line (retracement line) and an arrow sign, where the theory of the channel is to help identify overbought and oversold conditions in the market. The market price will generally fall between the boundaries of the channel. If prices touch or move outside the channel it is a tradi
该指标是一款多功能技术分析工具,基于自适应指数移动平均线(EMA)与通过真实波动幅度均值(ATR)计算的波动率过滤器相结合而构建。其设计目的是精确识别当前价格方向,突出潜在趋势转折的关键区域,并直观显示可能的反转区域。 算法的核心是通过两层波动率构建动态趋势带:外层和内层。外层边界起到强突破信号的作用,而内层水平则在指数均线斜率发生变化时捕捉价格结构的温和反转。这种组合确保了指标在保持对市场噪音抗干扰性的同时,也具有较高的灵敏度。 图形表现中加入了对比鲜明的箭头标记,用于提示趋势的变化。该指标不会重绘信号,这使其在交易策略和风险管理系统中成为可靠的过滤工具。 优势 多层波动率分析 —— 通过使用内外ATR通道,既能捕捉剧烈突破,也能识别趋势的逐渐转向。 自适应平滑 —— 内置可调系数的EMA平滑算法,能够适应不同的市场环境。 无重绘 —— 信号在出现时固定不变,确保历史分析的可靠性。 清晰可视化 —— 明确的趋势线与箭头标记,可即时评估市场状态。 灵活配置 —— 广泛的参数设置,可适配各种时间周期和金融工具。 通用应用 —— 既可用于趋势跟随策略,也可作为逆势过滤器。 指标参数 算法
---- Brand New Strategy. Three Month Rent is $30. ONE YEAR RENT ONLY $50. FREE EURUSD VERSION AVAILABLE UNDER << Forecast System Gift >>. NO NEED FOR BACKTEST! Link to the FREE version -->  https://www.mql5.com/en/market/product/110085?source=Site --- This is a simple strategy based on BREAKOUT and FIBONACCI levels. After a breakout, either, the market: - continues the move directly to the 161, 261 and 423 levels, or - retraces to the 50% level (also called a correction) and thereafter continues
Trend AI Indicator
Aleksandr Goryachev
Trend AI Indicator 描述: Trend AI Indicator 是一款强大的市场分析工具,利用人工智能识别趋势和关键水平。该指标自动适应不断变化的市场条件,提供准确的数据以支持决策。 主要功能: 趋势识别:   该指标使用机器学习算法准确判断趋势方向(上升、下降、横盘)。 关键水平:   基于历史数据自动构建支撑和阻力水平。 安全交易区:   定义最小可能止损的区域,降低风险。 适应性:   该指标适应市场波动,减少错误数据。 自定义设置:   可根据不同交易策略和时间框架进行调整。 优势: 由于使用AI,具有高精度。 适用于所有市场类型(外汇、股票、加密货币)。 安全交易区通过最小止损降低风险。 易于使用,适合初学者和专业人士。 设置: Indicator Color Theme:   设置与截图中显示的颜色主题。 Sensitivity Factor:   调整指标的敏感度。 Safety Factor:   调整安全止损功能的触发条件。 Trading Area Coefficient:   安全交易区的大小。 注意: 为确保指标正常运行,至少需要1500
PTS Precision Index Oscillator V2
PrecisionTradingSystems
5 (1)
精密指数振荡器(Pi-Osc)由Precision Trading Systems的Roger Medcalf开发 版本2经过精心重新编码,以在您的图表上加载速度非常快,还加入了一些其他技术改进,以提高体验。 Pi-Osc旨在提供准确的交易定时信号,旨在找到极端的耗尽点,这些点是市场被迫去触及,以清理每个人的止损单。 该产品解决了一个古老的问题,即知道极端点在哪里,这使得交易员的生活变得更加简单。 这是一个高度复杂的共识指标,与行业标准的振荡器相比,具有一些强大的区别。 它使用的一些特征包括需求指数、资金流动、RSI、随机指标、模式识别、成交量分析、标准偏差极端点以及不同长度上述各种变化的分歧。 乍一看,对于未经培训的人来说,它似乎与任何其他振荡器没有什么不同,但当与其他振荡器(如RSI或动量等)相对比时,这个指标的真正威力开始显现。 据我所知,没有其他振荡器可以频繁地精确指出顶部和底部,具有相同的定期效率。 精密指数振荡器由许多不同的数学方程组成,用于测量多个时间框架采样中的价格和成交量变动,从而高度准确地预测趋势可能发生转折的位置。 PTS Pi-Osc V2非
Quantum Regime Indicator
Gideon Asiamah Yeboah
Stop Trading Random Signals. Start Trading with Real Confluence Are you tired of indicators that repaint, give conflicting signals, and leave you more confused than confident? The Quantum Regime Indicator is a professional, standalone trading tool designed for serious traders who demand a systematic edge. It solves the biggest problem in technical analysis— false signals —by using a powerful multi-engine framework. Every signal is confirmed by a confluence of market conditions , ensuring you onl
This is a mini One pair version of Advanced Detector of Trend Reversal and Continuance known as TrueTrendStarM(TTSm25). It is a sensitive and Predictive indicator of Price Trends for Professional traders.  ( ATTENTION BUYERS:-Now the indicator is available for UNLIMITED TIME ONE TIME buy of just $500 ). Avail the Opportunity.    It detects high odds changes in Price Trend direction long before other indicator detects it. I have been working on it since 2019.    This is possible due to fractal
Gold Titan King Scalper
Dodong Christian Arnon
Indicator Description GOLD TITAN KING SIGNAL INDICATOR High-Precision Gold Scalping Buy/Sell Signals – Manual Trading Assistant Overview The Gold Titan King Signal Indicator is a manual trading assistant tool designed for high-frequency scalping on Gold (XAUUSD) and other major pairs. It generates clear BUY/SELL signals with precise entry levels, along with adjustable Stop Loss and Take Profit levels displayed directly on the chart. ️ This tool is NOT an EA. It does not execute trades
Pair Trading Station MT4
Young Ho Seo
3.67 (3)
How to use Pair Trading Station Pair Trading Station is recommended for H1 time frame and you can use it for any currency pairs. To generate buy and sell signal, follow few steps below to apply Pair Trading Station to your MetaTrader terminal. When you load Pair Trading Station on your chart, Pair Trading station will assess available historical data in your MetaTrader platforms for each currency pair. On your chart, the amount of historical data available will be displayed for each currency pai
Offer 249 down from 350 for the next 3 copies. then back to 350 $ Are you tired of using outdated indicators that leave you guessing where to set your profit targets? Look no further than the AK CAP Opening Range Breakout Indicator. This powerful tool is backed by a US patent and has already helped countless traders pass funded challenges like FTMO. We use it daily on our prop traders and internal funds, and now it's available to you as well. The calculation behind the indicator is incredibly a
Oracle flow
Adolfina Denysenko
指标目的: Oracle Flow 结合了技术指标和过滤器,旨在识别买入和卖出的市场入场点。该指标通过在图表上显示箭头信号,来提示潜在的趋势反转或延续。 ️ 主要使用元素: 指数移动平均线(EMAs) - 采用快慢两条周期线,通过交叉确认趋势强度。 相对强弱指数(RSI): - 评估趋势强度,当突破 50 水平线时生成信号,表明多空主导权转换。 多头力量与空头力量: ——测算多空力量失衡程度,以增强信号过滤效果。 布林带: - 监测价格是否突破通道范围。 波动率过滤: 该指标通过计算K线的平均波动区间(即高低点差),以优化入场点位。 信号形成条件: 买入信号(蓝色向下箭头): 快速EMA高于慢速EMA,基于前期值提示潜在反转; RSI 指标显示价格已突破关键支撑位。 多头动能确认上涨趋势,空头动能持续减弱。 价格位于布林带下轨下方。 附加筛选条件(特定周期内最高价与最低价的差值)可进一步增强信号强度。 卖出信号(红色上箭头): 快速EMA低于慢速EMA。 RSI 指标呈现下降趋势。 空头力量增强,多头力量减弱。 价格位于布林带上轨
Dual Momentum
Adolfina Denysenko
Dual Momentum is a modern arrow indicator for MetaTrader 4, created specifically for the accurate detection of market reversals and strong impulse movements. The indicator is based on a combination of two powerful oscillators – Williams %R and RSI, which allows you to filter noise and generate more reliable signals. Thanks to this, Dual Momentum indicates only key entry points when the probability of a successful trade is highest. Key advantages: No redrawing – signals remain on the cha
FFx Engulfing Setup Alerter gives trade suggestions with Entry, Target 1, Target 2 and StopLoss. Below are the different options available: Entry suggestion - pips to be added over the break for the entry 3 different options to calculate the SL - by pips, by ATR multiplier or at the pattern High/Low 3 different options to calculate the 2 TPs - by pips, by ATR multiplier or at Risk/Reward Offset the dashboard - any place on the chart Remove the suggestion once the price reached the SL line Lines
作者的更多信息
MacdScalper
Roman Yablonskiy
4 (1)
MacdScapler   is an automatic expert advisor with two section of martingale strateges with automation takeprofit. The MACD indicator with adjustable parameters is used as inputs. If parameters of the entry points goes wrong, the EA changes them automaticly. General recommendation The minimum recommended deposit is 1000 cents for 0.01 lot. Spread is recommended less then 2 points. The martingale parameter can be set from 0.1 to any value in two steps - the first for the four trades and the second
FREE
Macd Martin
Roman Yablonskiy
2.5 (2)
Double Breakout   is an automatic expert advisor with two separate strateges that uses martingale. The MACD indicator with adjustable parameters is used as inputs for each flow of orders. The specified takeprofit and stoploss levels are used to exit the position.  General recommendation The minimum recommended deposit is 1000 cents. Spread is recommended not more than 3 points. It is better to use trend currency pairs. The martingale parameter can be set from 0.1 to any value. When martingale i
FREE
All Days Scalper
Roman Yablonskiy
1 (1)
All Days Scalper   is created to give a constant profit from the moment of launch and bring profitable transactions every day. It is automatic trading advisor with a built-in double strategy module, which are used depending on market conditions. The EA has fully customizable parameters for working in different market conditions. As inputs, indicators Rsi and Long Parabolic is used. When the profit from open basket of orders is greater than used parameter, they are automatically closed with a p
FREE
This indicator displays the trend direction, the averaged price value and flat areas. It is used to determine the averaged price value with little or no delay. During a flat, its line is often smooth, and it follows the trend during a descending or an ascending movement. The best charts for the indicator are the range\renko charts, which do not have rounded borders of price changes. Various types of moving averages and certain types of digital filters were used as a prototype. Compared to variou
Skynet Heiken Ashi
Roman Yablonskiy
This indicator displays the short-term trend direction and flat areas in the same way as the classic Heiken Ashi indicator, but it is not plotted using candles or a moving average, but rather the Skynet Moving Average indicator. Advantages no delay, or a slight delay when using the 'smooth' parameter. customizable parameters for any price data and timeframes. visualization of the flat and the short-term trend. unlike the classic Heiken Ashi indicator, the frequency of candles changing from bull
Skynet Parabolic
Roman Yablonskiy
This indicator displays the entry points for buying and selling, with additional push notifications. It is based on the classic Parabolic SAR indicator, price smoothing model and certain mathematical methods for a greater variability in finding market entry points. Advantages Fewer wrong entries compared to the use of classic breakout and trend confirmation indicators. Signals are not redrawn. A large number of customizable parameters. Visualization of the bullish and bearish trend. Used for id
This indicator displays an equidistant price channel, identifies short-term trends and automatically finds the best levels for the upper and lower borders of the channel. It is optimized for major timeframes and currency pairs. Advantages visualization of short-term trends automatic setting of upper and lower channel borders suitable for scalping strategies based on a rebound from the channel borders Parameters smooth - border smoothing coefficient. The default value is 1; pricetype - use Open
Skynet Trend Zones
Roman Yablonskiy
Skynet Trend Zones is based on classical indicators and some mathematical calculations and works in different market conditions for showing the trend. The principle of operation is as follows: if the price moves in a range, then a flat line is shown below or above the price depending on the previous trend; if the price moves down or up without a rollback, a line is shown at an angle to the price, and when a small rollback occurs, the indicator line is built again horizontally. Thus, you can work
Macd Martingale
Roman Yablonskiy
Macd Martingale is an automatic expert advisor that uses a fully adjustable martingale. The MACD indicator with adjustable parameters is used as inputs. The specified takeprofit and stoploss levels are used to exit the position.  General recommendation The minimum recommended deposit is 1000 cents or other currency depending on the parameters of your account. Spread is recommended not more than 3 points. It is better to use those currency pairs where there are a lot of trend movements in any dir
Prometheus
Roman Yablonskiy
Prometheus  is created to give a constant profit from the moment of launch and bring profitable transactions every day. It is automatic trading advisor with a built-in double strategy module, which are used depending on market conditions. The EA has fully customizable parameters for working in different market conditions. As inputs, indicators Rsi and Long Parabolic is used. When the profit from open basket of orders is greater than used parameter, they are automatically closed with a profit. If
Skynet MACD
Roman Yablonskiy
This indicator displays a histogram of the crossover of two analogs of the moving average, in appearance it is the same as the classic MACD indicator, but with almost no delay. The first value of the indicator after going through zero is calculated using the difference between the upper and lower Bollinger bands. Advantages there is practically no delay with an increase in the averaging periods, since analogs of the average are used, where there is no such negative effect as delay. much less ze
Entry Points
Roman Yablonskiy
This indicator displays entry points in the market where to open your positions. The indicator is based on Parabolic, SuperTrend and Bollinger Bands to increase profitability and reduce the number of losing trades. It helps to find breakout of the support or resistance line and shows where to enter the market. The dashboard shows the results of the indicator (total pips win, loss, % of win and so on). The notification of entry points comes to the phone. It uses closed bars, no tick data. When yo
Bollinger Trend
Roman Yablonskiy
This indicator displays entry points to the market using Bollinger tapes and exit points, which are determined by the specified distance in points from the entry point. If indicator line is above the price - it is "sell" zone for traders, and if indicator line is lower than the price - it is bullish trend. The information panel shows the results of the indicator so that you can configure it more precisely and see how the parameters affect the result. Alert about the points of entry and exit come
Skynet Trend AI
Roman Yablonskiy
Skynet Trend AI shows trend on the price chart with a colored line. Usually, all traders are looking for a clue where to buy and where to sell using classic or downloaded indicators. But often it gets more and more confusing and every time you find it difficult and confusing to create a hint for yourself where to open a position. Self-reliance does not always justify the result. Therefore, it is better to use a simple and intuitive tool to solve your problem!   Skynet Trend AI   gives visual
筛选:
无评论
回复评论