RegLin Polinomico

RegLin Polinómico – Polynomial Regression Bands with Intelligent Filters

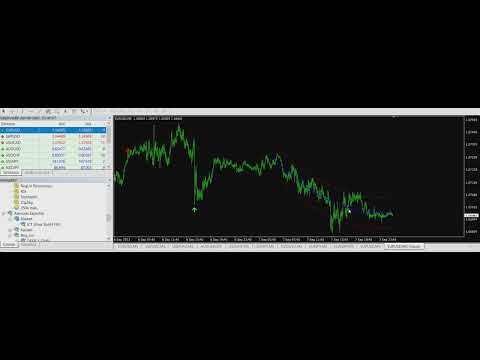
RegLin Polinómico is a professional indicator that fits a polynomial (degree 1, 2, or 3) over a rolling price window and builds dynamic bands from the standard deviation of the fit’s residuals. It includes RSI (with selectable timeframe) and a trend-only option to filter out low-quality breakouts. You can also enable/disable sound when visual signals (arrows) are generated.

How it works

  • Fits a configurable-degree polynomial over RegPeriod bars.

  • Draws the central curve (regression) and two bands at StdDevFactor standard deviations.

Indicative signals

  • Buy: when the bar’s low breaks below the lower band and RSI confirms oversold.

  • Sell: when the bar’s high breaks above the upper band and RSI confirms overbought.

  • With OnlyInTrend = true , the slope must favor the trade (polynomial derivative): buys only if the slope is positive, sells only if it’s negative.

  • If EnableSound = true , a sound plays when an arrow is drawn for the first time.

Polynomial degree: what changes and when to use each one

Degree 1 (Linear) – Trend-following & robust

  • Behavior: best-fit straight line; delivers a clean read of direction.

  • When: clear trends or mid/high timeframes (M15–H4).

  • Pros: low latency, fewer false signals in orderly markets, less overfitting.

Degree 2 (Quadratic) – Curvature & cycles

  • Behavior: allows curvature, capturing accelerations/decelerations.

  • When: cyclical phases or arcing channels; changes of pace.

  • Pros: balanced sensitivity vs. stability; detects broad turns better than linear.

Degree 3 (Cubic) – High sensitivity & inflections

  • Behavior: captures inflections (convexity changes) and early turns.

  • When: intraday/scalping and volatile instruments.

  • Pros: maximum adaptability; consider tighter RSI/period and OnlyInTrend to avoid over-signaling.

Quick tip

  • Start with Degree 1 to map the baseline trend.

  • Try Degree 2 if you observe curvature.

  • Use Degree 3 on lower timeframes / highly dynamic markets with stricter filters.

Key advantages

  • Statistically consistent bands: width responds to model error, not just fixed ranges.

  • Integrated technical filter: RSI and (optional) slope reduce deceptive breakouts.

  • True market adaptability: switch degree by regime (trend, cycle, volatility).

  • Refined UX: arrows with optional sound, bar-close confirmation to avoid repainting.

External variables (quick guide)

  • RegPeriod – Number of bars for the fit and bands. Larger = smoother; smaller = more responsive.

  • StdDevFactor – Standard-deviation multiplier of residuals (band width).

  • PriceType – Price source: 0=Close , 1=Open , 2=High , 3=Low , 4=Average (O+C)/2 , 5=Typical (H+L+C)/3 .

  • PolyDegree – Polynomial degree: 1 (linear), 2 (quadratic), 3 (cubic). Controls sensitivity & curvature modeling.

  • RSIPeriod – RSI period used as a filter.

  • RSITimeframe – RSI timeframe (enables MTF confirmation).

  • RSI_Overbought / RSI_Oversold – Thresholds to validate overbought/oversold.

  • RSI_Shift – RSI shift; use 1 to confirm on bar close and reduce repainting.

  • OnlyInTrend – If true , requires slope in favor of the signal (derivative > 0 for buys, < 0 for sells).

  • EnableSound – If true , plays a sound when a new arrow is drawn; if false , silent.

Summary

RegLin Polinómico blends statistical rigor with operational flexibility: it adapts model complexity to the market, filters with RSI/slope, and presents clear visual signals with optional sound. Built for traders seeking consistency, noise control, and an advanced read of price dynamics.

推荐产品
PTW NON REPAINT TRADING SYSTEM + HISTOGRAM Non-Repainting ,   Non-Redrawing   and   Non-Lagging  Trading System. Does the following: - Gives Accurate Entry and Exit Points - Scalping, Day and Swing Trading  - 95% Accuracy  - Targets, where to take profits. - Shows Trends, Support and resistance levels - Works on All Brokers - Works on All Currencies, CFDs and Stocks - It does not place trades for you, it only shows you what trades to place. - It works on All Timeframes - It is for Trend or ran


Msht Head and Shoulder
Ngoc Hoai Thuong Doan
MSHT Head&Shoulders indicator for MT4 automatically scans the chart for head and shoulders candlestick patterns. Obviously, the scanner shows the Symbol, Timeframe, Direction, Pattern Name, Age, and Chart time frame in which the head and shoulders pattern is identified. Furthermore, the scanner displays the inverted head and shoulders pattern also. So, forex traders can BUY or SELL based on the head and shoulders candlestick pattern. Additionally, the indicator also scans and plots emerging head
Max Volume
Maksim Slovakov
Подкрашивает аномально большие тиковые объёмы в красный цвет. Имеет следующие настройки: "Процент" по умолчанию "70"  (Процент на который аномальный объём должен быть больше предыдущего) "Уровень" по умолчанию "500" (Количество тиков, больше которого будем брать во внимание аномальный объём) Внимание! Данный индикатор был разработан для мелких таймфреймов M1,M5,M15. Идея в том, что на таких Таймфреймах увеличение количества тиков говорит об увеличении количество сделок, увеличения интереса к цен
Cyclic Impulse
Vitalyi Belyh
构建图表并识别周期性价格变动的技术指标。 可以在任何图表上工作。 几种类型的通知。 图表本身还有额外的箭头。 无需重新绘制历史记录,只需关闭蜡烛即可。 建议使用 M5 及以上的 TF。 易于使用和配置参数。 当使用 2 个具有不同参数的指标时,您可以单独使用它们,而无需其他指标。 有 2 个输入参数 周期性和信号持续时间 这两个参数处理图表结构的处理。 Cyclicity 调节反转周期的变化频率,平滑周期。 Signal duration 为最小数字,检测价格变动中的脉冲,最大长期趋势变动。    ---------------------------------------------------------------------------------------
本指标是实践实战交易完善的波浪自动分析的指标 !  案例... 注: 波浪分级用西方叫法不习惯,因受到缠论(缠中说禅)命名方式习惯的影响,我是将基础波浪命名为 笔 ,将二级波段命名为 段 ,同时具有趋势方向的段命名为 主趋段 (以后笔记中都是这种命名方式,先告知大家),但是算法上和缠论关系不大切勿混淆.反映的是本人分析盘面总结的 千变万化纷繁复杂的运行规律 . 对波段进行了标准化定义,不再是不同人不同的浪  ,    对人为干扰的画法进行了排除,在严格分析进场起到了关键的作用 . 使用这个指标,等于将交易界面提升美感,抛弃最原始的K线交易带你进入新的交易层次.如果不是为了交易,在宣传上也将使客户观感提升层次. 指标内容: 1. 基础波浪 (笔) : 首先我们找出了价格波动过程中的基础波动拐点,当然他的有序性低,为下一步的计算提供基础. 2. 二级波段( 段 ) :在基础波浪的基础上,通过算法分析得到层级更明显的二级波段,二级波段为波浪提供了分析基础 3. 波浪( 浪 ): 有着更清晰的趋势,更清晰直观的方向.分析一个波浪是否延续,需要看二级波段的形态,分析二级的构成,可以得出波浪
Implement
Vitalii Zakharuk
5 (1)
Implement analyzes market dynamics for pivot points. If you want to learn how to spot the correct reversals for consistently likely profitable trading, buy this indicator. Shows favorable moments of entering the market in stripes. Ready-made trading system. The principle of operation of the indicator is to automatically determine the current state of the market when placed on a chart, analyze historical data based on historical data and display instructions for further actions on the trader's
ROC acceleration-deceleration is the manual system for medium-term scalping. Indicator based on custom ROC system which defines bullish/bearish market and especially  acceleration-deceleration of tendention in the market's main direction. Buy arrow is plotted during bearish market when current trend decelerates and sell  arrow is plotted during bullish market when current trend decelerates. Main Indicator's Features Signals are not repaint,non-late or disappear(exept cases when system recalculat
AIS Bessel Filter
Aleksej Poljakov
该滤波器基于贝塞尔多项式。它的主要优点是时间延迟小。这个过滤器的另一个特点是它对金融时间序列的最新值的高度敏感。正因为如此,该指标突出了活跃的价格走势,同时消除了噪音偏差。 除了经典变体之外,贝塞尔系数的对数已作为加权函数添加到指标中。在这种情况下,指标变得更平滑,但同时当价格活跃时它可能会滞后。 在计算贝塞尔多项式时,会使用阶乘。因此,指标的周期从下方和上方受到限制。使用普通贝塞尔滤波器时,最好注意指标的小周期。由于随着周期的增加,指标的行为变得越来越稳定,差异变得越来越不明显。 这些图显示了两种过滤器类型的行为。 指标参数: TypeFilter - 正常/对数滤波器类型选择 iPeriod - 指标周期,有效值 3 - 85。
Pyro Trend
Oleksii Ferbei
Pyro Trend is a new product that allows you to identify the current market phase (uptrend, downtrend or flat). The indicator is applicable for any data and periods. The middle of the trend wave, as well as the edges, are places of special heat and market behavior; when writing the indicator, an attempt was made to implement precisely finding the middle. Pyro Trend is a trend indicator that uses an original calculation algorithm. This indicator paints arrows in different colors depending on the
Bank Expert
James D Blanks
Bank Expert Indicator Uses A Simple method of tracking price as it moves across the chart and signals when a potential long or short position is active and indicates this to the trader giving you the opportunity to take a position on the market. Or you can simply use this indicator to give yourself signals and determine if you want to take the trade or learn the strategy on your own. The Signals From this indicator are targeted at long-term positions and focus on top quality call outs. 
Reversal Overlap Bot is an automated trading strategy. No technical indicators are used in the work. At the beginning of trading, the first order is placed in a certain direction (at your option). When you open a new candle, this order is closed if it is in profit. Otherwise, the next order opens in the opposite direction. Orders are closed when profit is reached. If there are unprofitable orders on the chart, the robot will close one of them. When closing loss-making orders, the profit covers t
Phantom Signals Pro 4
Aiman Saeed Salem Dahbag
Phantom Signal Pro – Professional Marketing Description Phantom Signal Pro   is an advanced trading indicator designed to generate high-precision entry signals directly on the chart by analyzing market momentum and trend strength to identify the best buy and sell opportunities in real time. The indicator is built to provide traders with a clearer view of price action by filtering out weak signals and focusing only on high-probability opportunities that occur within strong market movements, help
FREE
Power Bears Rich
Pham Trong Khanh
Everyday trading represents a battle of buyers ("Bulls") pushing prices up and sellers ("Bears") pushing prices down. Depending on what party scores off, the day will end with a price that is higher or lower than that of the previous day. Intermediate results, first of all the highest and lowest price, allow to judge about how the battle was developing during the day. It is very important to be able to estimate the Bears Power balance since changes in this balance initially signalize about possi
Market Profile
Artem Titarenko
5 (1)
The "Market Profile" indicator displays the profiles and volumes of periods – weekly, daily, session (8-hour), 4-hour, hour, summary. The VAH/VAL price area is automatically highlighted by a dotted line for each profile (except for the summary). The indicator includes chroma Delta, which colors the profile areas. The areas of prevailing Buys is colored in green, that of Sells - in red. The intensity histogram features blue/red respectively. In the filter mode, the indicator displays the volume a
Boba Binary
Anthonius Soruh
5 (1)
Result look on  https://t.me/BonosuProBinary Pair : All Forex Pairs Time Frame : M1 Expaired : 1-2 Minutes Trade Time Once Time a Day Backtester, Alert Avaliable Average Signals Generate 5 - 20 Signals All Pair A Day Broker Time Zone GMT+3 Default Setting [Example Broker GMT+3 : Alpari, FBS, XM] Support Broker : Deriv, IQOption, Alpari, Binomo, Olymtrade, Qoutex, GCoption, etc Support Auto Trading : MT2 Trading, Binary Bot, Intrade Bot, Binomo Bot, Olymptrad Bot, MX2 trading, Price Pro, etc Ind
Cota Binary
Anthonius Soruh
5 (2)
Result look on  https://t.me/BonosuProBinary Pair : All Forex Pairs Time Frame : M1 Expaired : 1-2 Minutes Trade Time Once Time a Day Backtester, Alert Avaliable Average Signals Generate 5 - 20 Signals All Pair A Day Broker Time Zone GMT+3 Default Setting [Example Broker GMT+3 : Alpari, FBS, XM] Support Broker : Deriv, IQOption, Alpari, Binomo, Olymtrade, Qoutex, GCoption, etc Support Auto Trading : MT2 Trading, Binary Bot, Intrade Bot, Binomo Bot, Olymptrad Bot, MX2 trading, Price Pro, etc Ind
Channel Arg Control
Vitalii Zakharuk
The Channel Arg Control indicator, in addition to lines, reflects entry signals in the form of arrows. But how to do that? At first glance, this is not an easy task. But not for the Channel Arg Control indicator, this indicator will tell you whether you have configured the indicator correctly, while you can specify the history interval in the bars that interests you. And yet, how does the indicator tell you? Look at the numbers on the chart near the arrows! This is exactly what you thought, the
This product shows you a different view of the market by examining the performance of volume and continuous patterns in the market, then by calculating the behavior of traders and market patterns, calculates the probability of the next movement of the market by calculations. Function. How to receive the signal: If the candlestick is currently a bullish candlestick, according to a market scan, if the next bullish candlestick is below 5%, you can open a free trade by hitting the wisdom areas.
Quantum Trend Ribbon Quantum Trend Ribbon is a premium trend-following indicator designed to help traders identify market direction with confidence. By combining an adaptive moving average with a dynamic trend ribbon, it filters out market noise and highlights the dominant trend, allowing you to focus on high-probability trading opportunities. The clean and intuitive interface makes it easy to understand market conditions at a glance without cluttering your chart. Key Features Adaptive Trend De
Mama-Fama Smoothed — True Non-Repainting Indicator   (MT4) 100% Non-Repainting Logic Signals are generated only after candles are fully closed No signals on the current forming bar Once an arrow appears, it never moves, disappears, or changes MTF Safe (Multi-Timeframe) Higher timeframe data is read only from CLOSED HTF candles The current (forming) HTF candle is explicitly excluded No future data leakage — safe for backtesting and live trading Closed-Bar Confirmation Buy/Sell arrows are
Cleopatra EA
Nestor Alejandro Chiariello
5 (1)
交易员您好! EA 拥有 3.5 年低回撤的稳定交易记录: 现场表演 可以在这里找到 MT4 版本 我介绍“Cleopatra EA”策略,Cleopatra 是一个美丽而智能的设计,具有不断适应的恢复形式,其强大之处在于多功能性 它的主要策略是阅读市场的弹性,我们将能够以不同的方式分析进入范围。 这可以是非常动态的,因为在不同的 tf 和不同的范围内,处理对市场新闻的查询。 Cleopatra 有很强的适应市场复苏的能力,她的模式不是固定的,我们也有不同类型的保护,无论是百分比还是浮动,能够在任何 propfirm account 或 mff 等规则下工作。 它针对 EURUSD 进行了优化,但它可以处理整个市场,关键是要使其适应您需要的市场。 支持的货币对:EURUSD,可选所有市场 推荐时间范围:M15 特征: 一张图表设置:您只需要一张图表即可进行交易 多种货币对支持 可靠的回测和现场表现 无需调整 GMT 非常易于使用:只需阅读下面的 3 行说明 比可用的高质量替代品便宜得多 如何安装 EA 必须附加到任何 TF 但 M15 图表,推荐 EURUSD 如果您的
FlatOut Movings Robot:绝对掌控震荡盘整,自信领航趋势行情。 基于移动平均线的指标策略都有一个共同 text 里的噩梦:一旦市场切换阶段,您的本金就会开始缩水。传统的均线在震荡市(盘整期)中会产生数十次虚假交叉,而标准的过滤器又存在严重的滞后性。这导致您常常深夜顶着压力守在终端前,却偏偏在行情行将结束时才建仓入场。 本软件专为解决这一具体痛点而生。机器人能够持续扫描图表,像获取了订单簿的内部消息(内幕数据)一样读取市场结构。无论是在死气沉沉的横盘震荡中,还是在强劲的趋势脉冲行情下,它都能保持同样高效的交易表现。系统宛如一把手术刀,精准地将真实突破与进入交易通道的虚假洗盘剥离开来。 历经市场混沌时代的岁月检验 该软件的数学核心已通过了长达十年的无序价格风暴周期(各周期交替更迭)的严苛回测。该算法在设计之初就具备了抵御任何全球金融危机以及市场时代变革的能力。 脉冲猎手: 机器人在行情无回旋余地的临界点(即价格顺着阻力最小的方向飞速推进的节点)切入交易。入场点经过极度精准的计算,因此持仓头寸通常几乎不会承受有害的反向浮亏压力。 连胜主宰: 机器人字典里没有
BinaryIndi
Andrey Kravchenko
This is an arrow indicator for binary options. It does not redraw, arrows do not disappear. The indicator implements an optional tester for visual monitoring of the number of signal and win rate. Does not require adjustment or fitting. Works on all pairs and gold. The signal appears at the close of a candle. Entry is made on the next bar. Optional alert. For trading with robots, there is a setting for the number of bars in history. If 0, the entire history is used. The EA operation time: 24/5 Wo
Note : The slow loading of the indicator issue has been addressed . This new version loads fast and does not slow the platform. Version 1.3 : We have updated the indicator to include an historical bar scanning option . So instead of scanning all bars in the history (which can make the indicator slow sometimes ) , you can select the maximum number of bars it can scan which can increase the performance and make the indicator faster. This indicator scans the 1-3 Trendline pattern . The indicato
Happy Croc
Pui Yan Leung
Overview Happy Croc is a trend-following and momentum-based technical indicator, it is built upon the classic Bill Williams Alligator logic and significantly enhanced by adding two critical filters: 200 SMA and Stochastic Oscillator for momentum confirmation. The indicator is designed to identify "crossover" events specifically in the direction of the dominant market trend.   Key Functions Trend Filtering (SMA 200) Acts as a primary gatekeeper for signals: Buy arrows are only permitted when the
Al in one level
Kundan Kumar Srivastava
5 (1)
This indicator is collection of important dynamic support and resistance giving a trader crystal clear idea , where to sell and where to buy. it completely complements trend lines, support, resistance, and sideways market and allow a trader to make sustainable profits. The thickness of lines suggests its strengths, the thicker the dynamic line, the stronger is rejection or pullback allowing a trader to make multi-fold profit, as they can clearly see them. Introducing Your Ultimate Trading Edge:
Gold Strike Predator
Ignacio Agustin Mene Franco
GoldStrike Predator – Professional Expert Advisor for XAUUSD GoldStrike Predator is an advanced, high-precision Expert Advisor (EA) designed exclusively for trading the XAUUSD pair (Gold vs. US Dollar) on the MetaTrader 4 platform. Developed with a sophisticated hybrid architecture, it combines multiple layers of technical and predictive analysis to identify high-probability opportunities in the gold market, one of the world's most volatile and profitable instruments. Trading Strategy The sys
Market Pressure is a next-generation display. Its simple and intuitive graphics system allows you to receive directions very easy and fast. This indicator can give three different methods of signals: Scalping, Intraday and Multiday. The logic is based on the price action which combined on multiple time frame. It can give very high quality signals. An indispensable tool for those who want to understand the market pressure and the operating trend. The indicator is customizable for both colors for
介绍二元智能系统:您的终极交易伴侣 二元智能系统不仅仅是一个指标,它是一个精心设计的复杂交易工具,为交易者提供精确的交易信号和市场洞察。该系统建立在先进的算法和广泛的技术指标基础上,是您解锁交易成功的关键。 指标组件: 移动平均百分比(MAP):   该组件计算多个移动平均线的加权平均值,为趋势识别提供强大的基础。MAP会根据市场条件动态调整,提供有关当前趋势方向的见解。 商品通道指标(CCI):   CCI通过分析价格偏离平均值来衡量超买和超卖情况。二元智能系统的CCI集成确保了从整体上识别潜在的反转点。 移动平均线收敛/发散(MACD):   系统中的MACD组件超越了简单的价格交叉。它评估MACD线和信号线的收敛和发散,揭示隐藏的交易机会并确认趋势强度。 平均方向指数(ADX):   使用ADX,二元智能系统量化趋势动量。它可以准确地识别强劲的趋势并帮助您避免弱势、不确定的市场阶段,从而增强您的交易决策。 多空力量:   通过这些指标,可以利用多空情绪的综合力量。这对市场情绪的全面了解有助于进行明智的交易入场。 随机指标:   二元智能系统中的随机指标有助于识别超买和超卖情况,并
NN8D Points
Aleksandr Nikolskii
NN8D Points is one of the indicators included into NN8D ( N ikolsky's N esting D oll) trading system. NN8D Points is an indicator containing multiple tools for analyzing Forex market: candle analysis and area system. Rather than simply averaging by Open, Close, High and Low prices, NN8D Points performs a complex analysis of the current and previous bars by various parameters: bar color; bar body size; bar wicks; bar core (average value between Open and Close, as well as between Lows and Highs);
该产品的买家也购买
TrendMaestro
Stefano Frisetti
4 (4)
Attention: beware of SCAMS, TRENDMAESTRO is only ditributed throught MQL5.com market place. note: this indicator is for METATRADER4, if you want the version for METATRADER5 this is the link:  https://www.mql5.com/it/market/product/108106 TRENDMAESTRO ver 2.5 TRENDMAESTRO recognizes a new TREND from the start, he never makes mistakes. The certainty of identifying a new TREND is priceless. DESCRIPTION TRENDMAESTRO identifies a new TREND in the bud, this indicator examines the volatility, volumes a
Miraculous 指标 – 100% 不重绘的外汇和二元期权工具,基于江恩九方图 这个视频介绍的 Miraculous 指标 是一款专为外汇和二元期权交易者开发的高精度、强大交易工具。该指标的独特之处在于它建立在传奇的 江恩九方图 和 江恩振动法则 之上,使其成为现代交易中可用的最精确预测工具之一。 Miraculous 指标 完全不重绘 ,这意味着它的信号在 K 线收盘后不会改变或消失——你看到的就是你得到的。这为交易者提供了可靠且一致的基础,让他们能够自信地进出场交易。 主要特点: 基于江恩九方图和江恩理论构建 100% 不重绘的信号系统 适用于所有时间周期(M1、M5、H1、H4、日线、周线) 适用于外汇和二元期权交易 清晰的买卖信号,准确率高 可用于剥头皮、日内交易或波段交易 兼容大多数 MT4 平台 这款工具旨在帮助初学者和专业交易者做出更好、更明智的决策。无论您是交易货币、指数还是二元期权,Miraculous 指标都将为您在市场中提供所需的优势。
Breakout Arrows Mt4
Michael Oko Oboh
5 (1)
Trend Breakout Arrows Indicator The Trend Breakout Arrows Indicator is a momentum-based signal tool designed to identify potential bullish and bearish breakout opportunities. It displays clear arrow signals directly on the price chart, helping traders quickly recognize possible trend changes and continuation setups. Up Arrow (Buy Signal) A magenta up arrow appears below a candle when bullish momentum begins to strengthen. This signal indicates that buying pressure may be overtaking selling press
TRADING STRATEGY GUIDE DELIVERY The full Trading Strategy Guide will be sent directly to you after purchase. Just message me on MQL5 and ask for it — you'll receive it instantly, along with priority support and setup help. Powered Market Scanner for Smart Trading Decisions Keypad Support & Resistance is a next-generation MT4 trading system built for serious traders who demand precision, reliability, and clarity. It combines advanced smart filters with real-time price structure logic to genera
CountSig
Yin Zhou Luo
一款信号统计指标(MT4)——实现基于当前图表周期下的单线MA转向和双线MA金叉/死叉统计 . 转向定义:前一K向下或走平,当前K向上,视为转向向上;反之,转向向下。 金死叉定义:前一K快线在慢线下方,当前K快线在慢线上方,为金叉;反之,死叉。 参数及使用说明: 1、可指定统计K线数。 2、可指定4个不同的日内时间段,格式如"03:00-07:59",4个时间段可交叉任意输入。 3、可配置ABC三个浮盈区间段点值。如:分界区间统计小点值设为500,即当某转向信 号出现后到下一反向信号止浮盈<=此点值,计入A区间; 若大于此点值<大分界点值时,计入B区间;若大于“大分界点值”计入C区间。 4、最大/最小浮盈统计。显示所有统计区间内的最大浮盈点值和最小浮盈点值(亏损点值)。 5、输出完整信号,按信号出现顺序排列,如“ACCBCA”之类。 6、综合预测。使用概率、周期、趋势、马尔可夫链等综合概算输出预测该信号出现的归类概率值。 7、加载指定MA线。在当前图表自动载入相应设置的MA线。 8、自适应列宽。以完整显示统计信号数。 9、用法:点击相应统计按钮即输出相应的统计表格.
Fxland Price Reversal Zones (MT4) FXLAND Smart Reversal Indicator is a professional technical analysis tool designed to help traders identify potential price reversal zones and key market turning points with clarity and precision. The best reversal indicator and price return by choosing only one ceiling or floor in each time frame A masterpiece of combining mathematics and Gann, fractal matrix, Fibonacci, movement angle and time. Completely intelligent Key Features Detects potential pr
VTrende Pro mt4
Andrii Diachenko
3 (2)
VTrende Pro MT4 - MTF indicator for trend trading with a display panel for MT5 *** Videos can be translated into any language using subtitles (video language - Russian) Although the signals of the VTrende Pro indicator can be used as signals of a full-fledged trading system, it is recommended to use them in conjunction with the Bill Williams TS. VTrende Pro  MT4 is an extended version of the VTrende indicator. Difference between Pro version and VTrende: - Time zones - Signal V - signal 1-2 wave
WanaScalper MT4
Isaac Wanasolo
1 (1)
A scalping indicator based on mathematical patterns, which on average gives signals with relatively small SL, and also occasionally helps to catch big moves in the markets (more information in the video) This indicator has three main types of notifications: The first type warns of a possible/upcoming signal on the next bar The second type indicates the presence of a ready signal to enter the market/open a position The third type is for SL and TP levels - you will be notified every time price re
FFx Engulfing Setup Alerter gives trade suggestions with Entry, Target 1, Target 2 and StopLoss. Below are the different options available: Entry suggestion - pips to be added over the break for the entry 3 different options to calculate the SL - by pips, by ATR multiplier or at the pattern High/Low 3 different options to calculate the 2 TPs - by pips, by ATR multiplier or at Risk/Reward Offset the dashboard - any place on the chart Remove the suggestion once the price reached the SL line Lines
FFx InsideBar Setup Alerter gives trade suggestions with Entry, Target 1, Target 2 and StopLoss. Below are the different options available: Entry suggestion - pips to be added over the break for the entry Minimum candle size - to avoid too close buy/sell entry suggestions 3 different options to calculate the SL - by pips, by ATR multiplier or at the pattern High/Low 3 different options to calculate the 2 TPs - by pips, by ATR multiplier or at Risk/Reward Offset the dashboard - any place on the c
FFx OutsideBar Setup Alerter gives trade suggestions with Entry, Target 1, Target 2 and StopLoss. Below are the different options available: Entry suggestion - pips to be added over the break for the entry. 3 different options to calculate the SL - by pips, by ATR multiplier or at the pattern High/Low. 3 different options to calculate the 2 TPs - by pips, by ATR multiplier or at Risk/Reward. Offset the dashboard - any place on the chart. Remove the suggestion once the price reached the SL line.
FFx PinBar Setup Alerter gives trade suggestions with Entry, Target 1, Target 2 and StopLoss. Below are the different options available: Entry suggestion - pips to be added over the break for the entry Minimum candle size - to avoid too small candles 3 different options to calculate the SL - by pips, by ATR multiplier or at the pattern High/Low 3 different options to calculate the 2 TPs - by pips, by ATR multiplier or at Risk/Reward Offset the dashboard - any place on the chart Remove the sugges
Lineverse Trendlines
Arkady Segal
5 (1)
Automatic, live & interactive picture of all trendlines. Assign push, email and sound alerts to the lines of your choice and be informed about price rollback, breakout, rollback after breakout, number of rollbacks, line expiration by double breakout. Correct, drag or delete the lines and interactively tune the line system. https://youtu.be/EJUo9pYiHFA . Chart examples https: //www.mql5.com/en/users/efficientforex Price Interaction Events All events are effective immediately and only after one
FFx MACD Divergences
Eric Venturi-Bloxs
The purpose of this new version of the MT4 standard indicator provided in your platform is to display in a sub-window multiple timeframes of the same indicator with its divergences. See the example shown in the picture below. But the display isn't like a simple MTF indicator. This is the real display of the indicator on its timeframe. Here's the options available in the FFx divergences indicator: Select the timeframes to be displayed (M1 to Monthly) Define the width (number of bars) for each tim
FFx RSI Divergences
Eric Venturi-Bloxs
The purpose of this new version of the MT4 standard indicator provided in your platform is to display in a sub-window multiple timeframes of the same indicator with its divergences. See the example shown in the picture below. But the display isn't like a simple MTF indicator. This is the real display of the indicator on its timeframe. Here's the options available in the FFx divergences indicator: Select the timeframes to be displayed (M1 to Monthly) Define the width (number of bars) for each tim
FFx CCI Divergences
Eric Venturi-Bloxs
The purpose of this new version of the MT4 standard indicator provided in your platform is to display in a sub-window multiple timeframes of the same indicator with its divergences. See the example shown in the picture below. But the display isn't like a simple MTF indicator. This is the real display of the indicator on its timeframe. Here's the options available in the FFx divergences indicator: Select the timeframes to be displayed (M1 to Monthly). Define the width (number of bars) for each ti
The FFx Dashboard MTF alerter will show you on a single chart all the timeframes (M1 to Monthly) with their own status for the indicator. 2 Alert Options: Single timeframe: each selected timeframe alert separately when a signal occurs Multi timeframes: all selected timeframes must agree for an alert to be triggered Both options have an input to select the timeframes to be used for the alert(s). How to Understand the Status: Green/Red square: histogram above/below 0 line Green square + Red bord
The FFx Dashboard MTF alerter will show you on a single chart all the timeframes (M1 to Monthly) with their own status for the indicator. 2 Alert Options: Single timeframe: each selected timeframe alert separately when a signal occurs Multi timeframes: all selected timeframes must agree for an alert to be triggered Both options have an input to select the timeframes to be used for the alert(s). How to understand the status: Green/Red square: RSI above/below 50 line Green square + Red border: R
The FFx Dashboard MTF alerter will show you on a single chart all the timeframes (M1 to Monthly) with their own status for the indicator. 2 Alert Options: Single timeframe: each selected timeframe alert separately when a signal occurs Multi timeframes: all selected timeframes must agree for an alert to be triggered Both options have an input to select the timeframes to be used for the alert(s). How to understand the status: Green/Red square: Stoch above/below 50 line Green square + Red border:
The FFx Dashboard MTF alerter will show you on a single chart all the timeframes (M1 to Monthly) with their own status for the indicator. 2 Alert Options: Single timeframe: each selected timeframe alert separately when a signal occurs Multi timeframes: all selected timeframes must agree for an alert to be triggered Both options have an input to select the timeframes to be used for the alert(s). How to understand the status: Green/Red square: Price above/below Cloud (Kumo) Green square + Red bo
The FFx Dashboard MTF alerter will show you on a single chart all the timeframes (M1 to Monthly) with their own status for the indicator. 2 Alert Options: Single timeframe: each selected timeframe alert separately when a signal occurs Multi timeframes: all selected timeframes must agree for an alert to be triggered Both options have an input to select the timeframes to be used for the alert(s). How to understand the status: Green/Red square: MA pointing Up/Down Green square + Red border: MA po
The FFx Dashboard MTF alerter will show you on a single chart all the timeframes (M1 to Monthly) with their own status for the indicator. 2 Alert Options: Single timeframe: each selected timeframe alert separately when a signal occurs. Multi timeframes: all selected timeframes must agree for an alert to be triggered. Both options have an input to select the timeframes to be used for the alert(s). How to understand the status: Green square: Price above PSAR Red square: Price below PSAR Options
The FFx Dashboard MTF alerter will show you on a single chart all the timeframes (M1 to Monthly) with their own status for the indicator. 2 Alert Options: Single timeframe: each selected timeframe alert separately when a signal occurs Multi timeframes: all selected timeframes must agree for an alert to be triggered Both options have an input to select the timeframes to be used for the alert(s). How to understand the status: Green/Red square: CCI above/below levels (ie. 100/-100) Grey square: C
The FFx Dashboard MTF alerter will show you on a single chart all the timeframes (M1 to Monthly) with their own status for the indicator. 2 Alert Options: Single timeframe: each selected timeframe alert separately when a signal occurs Multi timeframes: all selected timeframes must agree for an alert to be triggered Both options have an input to select the timeframes to be used for the alert(s). How to understand the status: Green/Red square: ADX above level Grey square: ADX below level Red bor
The FFx Dashboard MTF alerter will show you on a single chart all the timeframes (M1 to Monthly) with their own status. 2 Alert Options: Single timeframe: each selected timeframe alert separately when a signal occurs Multi timeframes: all selected timeframes must agree for an alert to be triggered Both options have an input to select the timeframes to be used for the alert(s). How to understand the status: Green/Red square: bullish/bearish candle Options available in the FFx Dashboard Alerter
The indicator of a Professional Trader is an arrow indicator for predicting the direction of price movement. I have been working on this indicator since 2014. You can use this indicator as your main indicator, use its entry signals, and use it as your only indicator to find entry points. About the product: Recommended TF [H4-D1-W1]   . The indicator predicts the direction of the next candle. Fits a variety of tools; Flexibility in settings for different instruments and intervals through the MO
THE GRAFF III
Charles Harper
The [GRAFF] III manual trading system is based on multiple MetaTrader (MT4) indicators. Together, the entire PACK of GRAFF III indicators makes an advanced trading tool. The system consists of over 20 different custom-built indicators which have been carefully selected and tested in the long term to produce strong and efficient trading signals. The particular indicators are based on different mathematical formulas, so the entire system is calibrated to remove false signals from its own indicator
FFx Universal Strength Meter PRO is more than a basic strength meter. Instead of limiting the calculation to price, it can be based on any of the 19 integrated strength modes + 9 timeframes. With the FFx USM, you are able to define any period for any combination of timeframes. For example, you can set the dashboard for the last 10 candles for M15-H1-H4… Full flexibility! Very easy to interpret... It gives a great idea about which currency is weak and which is strong, so you can find the best pai
作者的更多信息
线性回归指标==> 该指标表示线性回归线和支撑和阻力线,是基于线性回归的标准偏差得出的。自定义选项:以下值可以进行调整:: Rango Tendencia: 作为指标参考的周期或时间段内的柱数或期数 AmpDesv: 考虑线性回归的标准偏差的倍数来表示指标的幅度 Colores: 可以从调色板中选择颜色来表示每条线   线性回归指标用于衡量两个变量之间的关系,即价格和时间。该指标通过某一特定周期内的资产收盘价构建直线,用于确定市场趋势的方向。如果回归线上升,则市场处于上升趋势,如果回归线下降,则市场处于下降趋势 使用线性回归指标的主要优点是,它能够更准确地确定市场的买入和卖出点。此外,它还有助于建立支撑和阻力水平,帮助交易者确定利润目标和止损 线性回归线 线性回归线是一种在统计学中用于描述两个变量(在我们的情况下为价格和时间)之间关系的数学模型。它是一条适合数据点(收盘价)的直线,并代表数据的中心趋势。该线用于根据另一个变量(时间)的值预测一个变量(价格)的值,假设未来价格的行为基于过去价格 为了计算线性回归线,采用最小二乘法,即最小化点和直线之间的距离。直线的斜率表示独立变量每次变化
LinearRegressionBands — 基于回归通道与 RSI 的智能信号 将市场解读转化为清晰、直观的决策流程。LinearRegressionBands 在近期价格窗口上绘制线性回归线,并生成动态通道(± 标准差)以识别极值。只有在出现真实的通道突破并且 RSI 到达极端区间时才绘制入场箭头;可选地,您可以要求回归斜率与信号方向一致(“仅趋势”模式)。 解决什么问题 高概率回撤:在“仅趋势”模式下,于上升斜率中寻找回撤做多,于下降斜率中寻找反弹做空。 受控的均值回归:若关闭趋势要求,当价格突破通道且 RSI 达到极端时捕捉机会,适用于经过严格过滤的逆势策略。 噪声更少:与水平通道不同,回归通道随价格倾斜,更贴合主导方向,减少误导性信号。 关键优势 干净客观的信号:仅在突破通道且 RSI 确认极端时给出箭头(无容差)。 一键趋势模式:设置 OnlyInTrend=true 以要求有利斜率(m>0 做多,m<0 做空),适合在趋势中“逢低买入、逢高卖出”。 多品种与多周期:适用于外汇、指数、商品、加密资产及任意周期。 不重绘的箭头:默认在已收盘的 K 线上评估(RSI_Shif
NosTraderMus_RegLin_PRO 基于线性回归、MTF 过滤与主动交易管理的专业型 EA(Expert Advisor) 建议:先在 M5(5 分钟)周期上进行测试。 NosTraderMus_RegLin_PRO 面向追求量化、纪律性与可复现性的交易者。该 EA 通过 线性回归通道 识别 价值区域 ,仅在上下文条件匹配时入场(RSI、DeMarker、多周期动量、成交量与点差),并对每笔持仓进行 主动且自适应 管理:智能挂单、基于波动性的 SL/TP(标准差)、跟踪止损、逐步分批止盈,以及基于净值目标的总体止盈。 **风险提示: 任何系统都不保证收益。请务必做好风险管理,并在 M5(5 分钟)**周期的模拟账户中先行测试,确认后再用于真实账户。 工作原理 统计结构: 通过线性回归计算 斜率、截距、残差标准差与相关性 ( 买/卖分别计算 )。 上下文过滤: 校验 RSI (当前与多周期 MTF)、 DeMarker 、 动量(Momentum) 、 相对成交量 (VMA 20 × 系数)、 点差 与 交易时段 。 高斯概率: 以 标准差倍数 衡量价格到通道 中线/边带 的
Duna1
Victor Gauto
DUNA — 外汇算法交易专家顾问 DUNA 是一款专业的 Expert Advisor(EA),专为外汇市场的自动化交易而设计。该系统建立在严谨的算法框架之上,持续分析市场行为,并根据预先设定的规则执行交易,无需情绪或主观判断的干预。 系统实时监控价格波动,并识别市场条件对潜在交易变得有利的时刻。通过结构化的决策模型以及动态交易管理机制,DUNA 旨在在参与市场机会的同时保持一种可控且系统化的交易方式。 与手动交易不同,DUNA 在安装到交易平台后即可自动运行。EA 会评估市场数据,在策略条件满足时开启交易,并随着市场变化动态管理已开启的仓位。 DUNA 的设计重点在于稳定性、纪律性以及系统化执行。该算法更注重谨慎选择交易机会,而不是频繁交易,从而使系统能够适应不同的市场环境。 DUNA Expert Advisor 的主要特点包括: • 完全自动化的算法交易 • 持续的市场监控与分析 • 基于规则的交易执行 • 动态交易管理 • 结构化且纪律化的交易方法 • 易于集成到交易平台 为了获得最佳性能,EA 需要根据交易品种、时间周期以及经纪商条件对参数进行适当优化。建议用户在进行真实交
NosTraderMus LinearRegressionBands MT5 — 线性回归通道 + RSI 与信号箭头 NosTraderMus LinearRegressionBands MT5 是一款适用于 MetaTrader 5 的专业指标,它在价格的滚动窗口上构建 线性回归线 ,并基于 拟合残差的标准差 形成 动态通道 。在统计通道之上集成了 RSI 过滤 (可选时间框架)以及当满足“ 极值 + 确认 ”条件时显示的 买卖箭头 。指标强调清晰、纪律性的信号,并通过在 收盘柱 上确认来降低重绘。 指标功能与工作原理 回归线 + 自适应通道 指标以 RegPeriod 根K线计算 最小二乘 意义下的 最佳拟合直线 ,这条线即为通道的 中线 。通道的 宽度 等于 StdDevFactor × 残差标准差 ,因此通道会随当前波动性 自适应 收放。 趋势过滤(可选) 回归线的 斜率 体现方向性。当 OnlyInTrend=true 时,只在 顺着斜率方向 显示信号(斜率为正→仅看多;斜率为负→仅看空)。 信号(箭头)= RSI + 突破通道 每根K线 最多一枚箭头 ,同时满足下列
筛选:
无评论
回复评论