Visual Wave Dolphin Indicator
- 指标
-
AL MOOSAWI ABDULLAH JAFFER BAQER
 To trade successfully we need to go through the proven path that others had gone and reached!
Here are 17 quotes from such successful investors:
1- Limit your size in any position so that fear does not become the prevailing instinct guiding your judgment.
Joe Vidich - 版本: 1.0
- 激活: 5
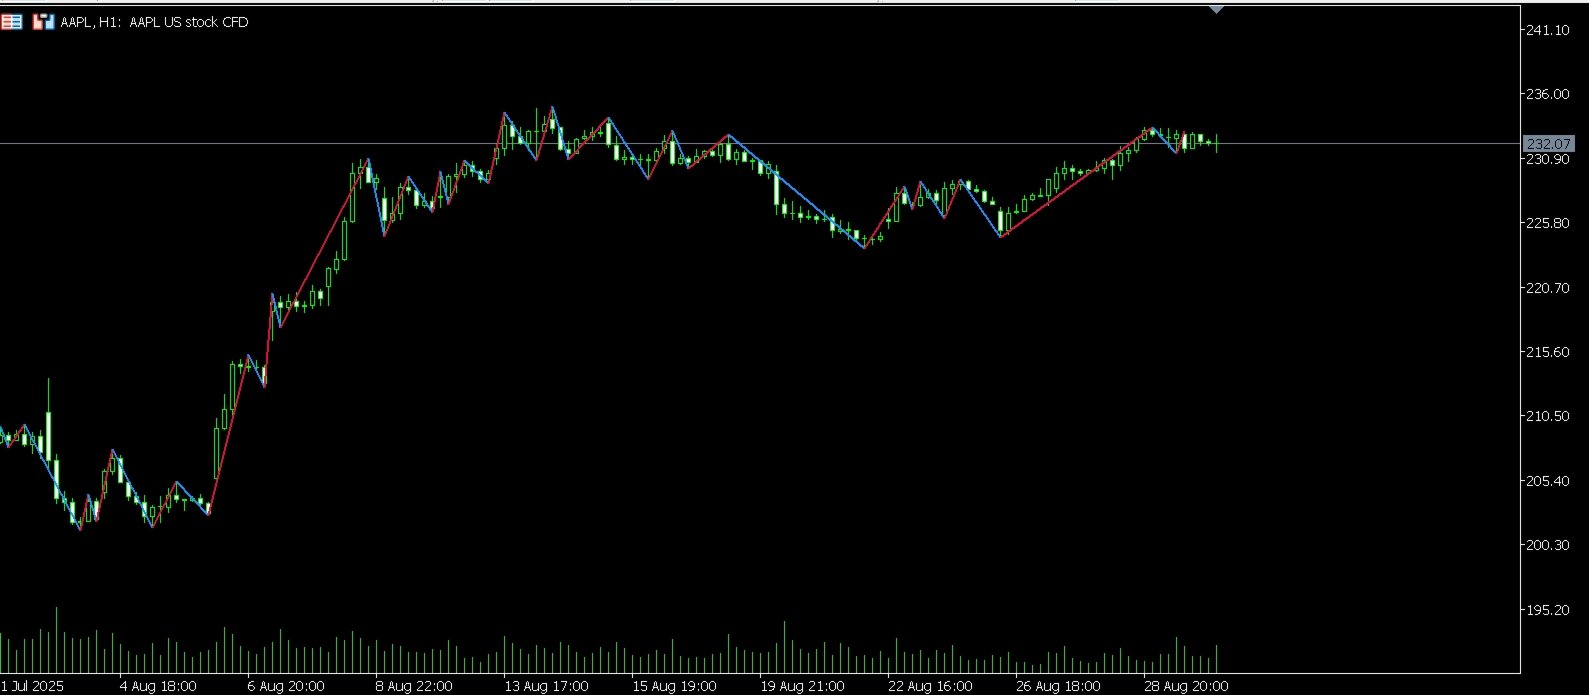
Visual Wave Dolphin Indicator: Ride the True Waves of the Market
Tired of chaotic charts and confusing signals? The Visual Wave Dolphin Indicator is your solution to cutting through market noise and identifying high-probability trading opportunities with stunning clarity. Designed for traders of all levels, this powerful tool transforms complex price action into a simple, elegant wave, allowing you to visualize market trends and catch turning points before they happen.
For just $30, you can equip your trading arsenal with an indicator that is not only intuitive but also highly customizable to fit any trading style, from scalping to swing trading.
The Logic Behind the Dolphin Wave
The core of the indicator is a sophisticated algorithm that intelligently filters out insignificant price fluctuations to reveal the market's true underlying structure. It operates on a clear and logical principle: identifying significant reversals based on a user-defined percentage change.
-
Wave Formation: The indicator first establishes a major high or low point. It then monitors the price as it moves away from that point. A new, opposing wave point is only drawn when the price has retraced by a significant, pre-defined percentage ( Wave Percentage Change ). For example, after a peak, the indicator waits for a substantial drop before confirming a new bottom. This process filters out minor volatility and ensures that only meaningful market movements are highlighted.
-
Trend Identification: The resulting visualization is a clean zigzag wave that clearly shows the prevailing trend. An upward-sloping wave indicates a bullish trend, while a downward-sloping wave signals a bearish trend. You are no longer guessing the trend; you are seeing it.
-
Signal Generation: The highest-probability entry signals occur at the exact moment the wave changes direction.
-
A Buy Signal (a lime up-arrow) is generated when the market sentiment shifts from bearish to bullish. This happens at the bottom of a wave, just as a new upward move is confirmed.
-
A Sell Signal (a red down-arrow) is generated when the trend shifts from bullish to bearish. This occurs at the peak of a wave as a new downward move begins.
-
Crucially, the signals are non-repainting. Once an arrow appears on a closed bar, it stays there, providing you with a reliable and historically accurate view of the indicator's performance.
Key Features
The Visual Wave Dolphin Indicator is packed with professional features to give you full control.
-
Fully Adjustable Wave Sensitivity: The Wave Percent input is the engine of the indicator. Lower the value to create more sensitive waves, perfect for scalpers and short-term traders. Increase it to smooth out the waves and focus on major trends, ideal for day traders and swing traders.
-
Clear and Unambiguous Arrow Signals: Eliminate guesswork with clear buy and sell arrows plotted directly on your chart, showing you the exact point of entry.
-
Built-in Signal Filter: Avoid over-trading during choppy market conditions. The unique Bars Delay feature ensures a minimum number of bars pass between signals, helping you to only take the highest quality setups and ignore market noise.
-
Complete Visual Customization: Tailor the indicator to your personal preference. You have full control over the colors of the up and down waves, the color and size of the signal arrows, and the thickness of the wave lines.
-
Optimized Performance: The code is clean and efficient, ensuring it runs smoothly without slowing down your MetaTrader terminal.
How to Trade with the Visual Wave Dolphin
-
Identify the Trend: Use the direction of the main wave to understand the current market trend.
-
Wait for a Signal: Look for a Buy arrow at the bottom of a wave in an uptrend, or a Sell arrow at the top of a wave in a downtrend.
-
Confirm Your Entry: For best results, combine the Dolphin Wave signals with your existing strategy. Confirm signals with support and resistance levels, candlestick patterns, or other indicators to maximize your win rate.
-
Set Your Stops and Targets: Place your stop-loss below the low of a buy signal or above the high of a sell signal. Aim for the next logical resistance or support level as your take-profit.
Stop navigating the market blindly. The Visual Wave Dolphin Indicator provides the clarity you need to make confident, informed trading decisions.
Add it to your chart today and start trading with the flow of the market!