 MetaTrader 5
 专家
 指标
 程序库
 实用工具
 窗口小部件
 规则
适用于MetaTrader 5的新EA交易和指标 - 532
 使用EA交易和指标,使外汇交易获得更多盈利。EA交易可使您自动开启和关闭交易,而指标将帮助您更准确地预测市场行为。
该页面提供MetaTrader 5应用程序的目录。
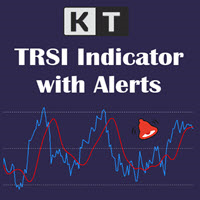
KT TRSI 是一种振荡器,由 RSI(相对强弱指数)、EMA(指数移动平均线)和 SMA(简单移动平均线)组合构建而成。与经典的 RSI 相比,TRSI 因为引入了 SMA 的平滑效果而减少了假信号的出现。此外,该指标支持所有类型的 MetaTrader 警报功能。
简单进场规则
买入:当蓝线(RSI)上穿红线(TRSI)。 卖出:当蓝线(RSI)下穿红线(TRSI)。
进阶进场规则 买入:当蓝线(RSI)跌破超卖区,然后再次上穿超卖区,同时红线(TRSI)出现多头交叉。 卖出:当蓝线(RSI)突破超买区后,再次跌破超买区,同时红线(TRSI)出现空头交叉。
使用 TRSI 时,建议配合其他指标和信号确认,以获得更稳健的交易决策。
TRSI 公式
三重 EMA = RSI 的三次 EMA。 TRSI = 三重 EMA 的 SMA,向右偏移 3 根 K 线。

直接在图表上监控每次布林带触碰 KT Bollinger Bands Alert 在图表上显示布林带上轨、中轨和下轨,并监控当前蜡烛是否触碰您选择的轨道。您可以启用符合自己交易方法的触碰事件,让指标在关键时刻提醒您,同时继续关注其他市场机会。 随时查看三条轨道的当前数值 可选价格标签会在图表上跟随上轨、中轨和下轨的实时数值。三条轨道均可独立设置颜色,便于在您的图表布局中清楚区分外部边界和中间基准线。 设置计算方式和提醒流程 布林带设置: 调整周期、偏差、位移和应用价格。 图表历史: 选择布林带显示的历史柱数量。 轨道选择: 分别开启或关闭上轨、中轨和下轨触碰提醒。 提醒间隔: 设置两次提醒之间的最少分钟数,以管理重复的触碰通知。 按需要选择通知方式 声音、弹窗、电子邮件和手机推送通知可任意组合使用,声音文件也可以选择。提醒消息会标明交易品种、时间周期和被触碰的轨道,便于快速返回相应图表。 无论您关注外轨测试、中轨附近的反应,还是波动边界的变化,KT Bollinger Bands Alert 都能围绕交易者熟悉的布林带提供清晰的图表显示和实用的提醒流程。
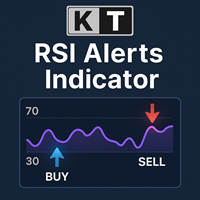
KT RSI Alerts 是对相对强弱指标(RSI)振荡器的个性化实现,能够在以下四种自定义事件中提供信号和提醒: 当 RSI 进入超买区域时。 当 RSI 离开超买区域时。 当 RSI 进入超卖区域时。 当 RSI 离开超卖区域时。
功能特点 非常适合关注 RSI 在超买/超卖区域中变动的交易者使用。 代码轻巧,不占用大量内存和资源,运行效率高。 实现了所有 MetaTrader 的提醒和通知功能。
相对强弱指数(RSI)的历史 RSI 由 J. Welles Wilder 开发,并于 1978 年首次发表于其著作《技术交易系统的新概念》和当年 6 月的《Commodities》杂志中。RSI 被归类为动量指标,它衡量价格变动的速度和幅度。RSI 的计算方法是将上涨收盘次数与下跌收盘次数的比值转换为指数值。

KT Forex Volume 以彩色柱状图的形式显示货币对的买入和卖出成交量。成交量由某一资产的买入和卖出交易构成。 在外汇市场中: 如果买入量大于卖出量,该货币对的价格通常会上涨。 如果卖出量大于买入量,该货币对的价格通常会下跌。
功能特点 通过使用点差成交量数据进行确认,避免不良交易。 帮助您跟随市场上的大资金参与者。 集成所有 Metatrader 警报提醒功能。
关于 Tick 成交量的使用 与其他市场不同,现货外汇市场是一个非集中式市场,因此零售交易者很难获得真实准确的成交量数据。 资深外汇交易员 Caspar Marney 于 2011 年提交的一份研究报告指出,Tick 成交量与实际成交量之间存在高度相关性和准确性。
柱状图计算公式
KT Forex Volume 指标基于 Chaikin 振荡器计算得出。该振荡器由 Marc Chaikin 提出,通过测量快速和慢速移动平均线之间的累积/分布关系来构建。
N = [(收盘价 - 最低价) - (最高价 - 收盘价)] / (最高价 - 最低价) M = N * 成交量(周期) ADL = M(前一周期) + M
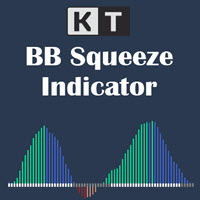
在动量扩张前看见波动率收缩 KT BB Squeeze 将波动状态与动量方向集中在一个清晰的振荡器中。它比较 Bollinger Bands 与 Keltner Channels,显示市场处于压缩还是扩张阶段,同时用零轴上下的柱状图呈现动量的发展。 灰色圆点: Bollinger Bands 位于 Keltner Channels 内部,表示挤压或收缩阶段。 白色圆点: Bollinger Bands 位于 Keltner Channels 外部,表示扩张阶段。 围绕零轴读取四种动量状态 彩色柱状图将方向和强弱分开呈现,便于判断多头或空头动量是在增强还是开始减弱。 绿色柱: 多头动量位于零轴上方并继续增强。 蓝色柱: 多头动量仍在零轴上方,但正在减弱。 红色柱: 空头动量位于零轴下方并继续增强。 鲑红色柱: 空头动量仍在零轴下方,但正在减弱。 标记扩张信号并跟踪动量减弱 当挤压之后出现白色扩张圆点,而且零轴上方或下方的动量正在增强时,指标可以在价格图表上绘制多头或空头垂直线。记录信号后,可选的动量减弱提醒会在当前走势发生变化时再次提示您。 从实用的默认视图开始 预设的 Momentum
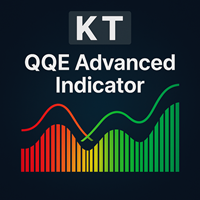
KT QQE Advanced 是对经典 QQE 振荡指标的改良版本,通过彩色柱状图配合快线与慢线 Trailing Line(TL)更直观、更精细地呈现市场动向,让交易者在瞬息万变的行情中也能一眼捕捉强弱转换、动能变化与潜在买卖区间。
与传统 QQE 不同,KT QQE Advanced 采用柱状体并附带超买/超卖水平,使过度延伸的行情一目了然,有助于及时做出高概率决策。
应用场景
借助多周期(MTF)扫描器,跨越所有时间周期快速捕捉买卖信号。 更精准地判断趋势方向,避免逆势操作。 及时识别超买/超卖状态,规避追高杀跌风险。 直观展示价格动能强弱,辅助顺势加仓或减仓。
输入参数 RSI 周期 平滑周期 MTF 扫描器 提醒设置
QQE 究竟是什么? QQE 全称 Quantitative Qualitative Estimation(定量定性估测)。它基于超平滑 RSI 与 ATR 的结合,既保留 RSI 的动量属性,又通过波动率因子过滤噪音。 不同于普通 RSI,QQE 采用 Wilder RSI,并用改良的指数移动平均进行平滑处理。 Wilder 平滑公式:前一 MA
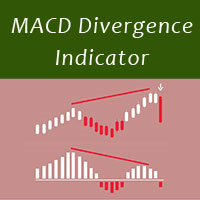
MACD divergence indicator finds divergences between price chart and MACD indicator and informs you with alerts (popup, mobile notification or email) . Its main use is to find trend reversals in the chart. Always use the divergence indicators with other technical assets like support resistance zones, candlestick patterns and price action to have a higher possibility to find trend reversals. Three confirmation type for MACD divergences: MACD line cross zero level Price returns to previous H/L Crea
FREE
Mouse You can draw fibonaccis moving the mouse over the zigzag indicator Pin them You can click on fibonacci with this option and it will no longer be deleted unless you click on it again :) Precision The tuned fibonacci gets the precise point in lower timeframes Enjoy it You can ask me for add more features, so please comment and leave your ranting for me to be happy, thank you :)
FREE

The market eagle - it is a Secure Automated Software for trade Forex market and indices.This EA takes perspective of the market looking like an eagle. From a distance, observe the entire market amphitheater detecting the entry points and the best points to implement the algorithm based on the set that we indicate in the input.This system allows us to use the key points of the market to adapt them to our algorithms, trend and countertrend. The system uses multiple lot depending on the algorithm
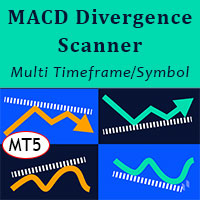
MACD Divergence Scanner is a multi-timeframe and multi-symbol dashboard and alert that checks all timeframes and symbols to find regular and hidden divergences between price chart and MACD indicator. This divergence scanner is integrated with support and resistance zones so you can check the MACD divergences in the most important areas of the chart to find trend reversals in the price chart. Download demo version (works on M4,M6,M12,M20,H3,H8 timeframes of 20 symbols of Market Watch window)
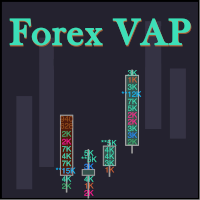
What do you see inside a candle? How to interpret the fight between bulls and bears? The candlestick chart brings a lot of information, but the volume is lacking in the candlestick body. This is where the Forex Volume At Price Expert Advisor comes in. This advisor searches for a set of recent trades, calculates the buy and sell attack volumes and prints on the candles, the volume value in each price range. You can also define up to ten colors to filter volumes and make it easier to
FREE

The added video will showcase all functionality, effectiveness, and uses of the trade manager. Drag and Drop Trade Manager. Draw your entry and have the tool calculate the rest. Advanced targeting and close portions of a trade directly available in tool (manage trades while you sleep). Market order or limit order on either side with factored spread. Just draw the entry, the tool does the rest. Hotkey setup to make it simple. Draw where you want to enter, and the stop loss, the tool calculates al
Tick Chart Monitor with countdown tick volume and easy to change tick size without going back to main chart. This work with Tick Chart Generator , which are available for download from the MQL5 Market: Tick chart generator: https://www.mql5.com/en/market/product/79763 NOTE: Custom symbols on MT5 are not directly tradable. This is by Metatrader5 design. If you want to place trades directly on the custom symbol generated by this product, you will either need a trade panel that offers this functi
FREE
EA create custom Tick bar charts and provide real-time updates for MT5. This is an MT4 "offline" chart equivalent which is very simple to use. Generated Tick bar Chart compatible to MT5 indicator or template and perform your technical analysis with Multi timeframe analysis. The generator uses tick data to plot the historical tick chart for a particular setting and live ticks for plotting live charts. This method of calculation gives very accurate charts as no approximation is used. This EA creat

Market Momentum Alerter Market Momentum Alerter will inform you about danger to operate in the market.
Imagine you see a very nice setup (Forex, Stocks, Indices) and you decide to place your trade...
And you finally lose your trade and don't understand what happened.
This can happen due to big operations in the market carried out by banks and big institutions.
These operations are invisible for most people.
Now with the Market Momentum Alerter you will be able to detect those operations...

LL Hedge EA is a structured hedge recovery system for MT5 designed for controlled drawdown and stable execution. Trader's guide available here . Built for disciplined traders who prioritize risk control over aggressive exposure.
Engine optimized with centralized position cache to reduce CPU load and improve execution efficiency.
Suitable for:
• Traders familiar with hedge strategies
• VPS users seeking stable execution
• Users who understand lot and risk control
Core Features Dynamic hedg

Vero Grid is an advanced grid system that has been working on real accounts for many months. The system is designed to detect market inefficiencies and find the best entry points to close trades in the positive.
The system supports many pairs but it is recommended to use it on pre-posted pairs:
Supported currency pairs: AUDNZD;NZDCAD;EURCHF WITH TIMEFRAME M15
Supported currency pairs: AUDUSD;AUDCAD;EURAUD WITH TIMEFRAME H1
Features: Only one chart for setup: You can use EA only on one pair

ATR Scanner Pro is a multi symbol multi timeframe volatility scanner that monitors and analyzes Average True Range indicator value in up to 28 symbols and 9 timeframes in 3 modes : ATR value: As a volatility dashboard it shows the ATR indicator value in all pairs and timeframes and signals when the ATR value reaches a maximum or minimum in a given duration. Short term ATR/Long term ATR ratio: It shows ratio of 2 ATRs with different periods. It's useful in detecting short term volatility and

SL Gold Scalper EA is optimized to trade GOLD (XAUUSD) asset. Based on the analysis of the market behavior a strategy that minimizes loss trades to successfully implement the martingale method. Multi-time frame analysis included for higher percentage of safe entries avoiding stop loss (SL) hunting from the market makers.
Expert Advisor Recommended Guide lines ================================================ Input Settings: MagicNumber => (Unique number per chart e.g 34505)
XAUUSD => 4 Hour Ch

Indicator and Expert Adviser EA Available in the comments section of this product. Download with Indicator must have indicator installed for EA to work.
Mt5 indicator alerts for bollinger band and envelope extremes occurring at the same time. Buy signal alerts occur when A bullish candle has formed below both the lower bollinger band and the lower envelope Bar must open and close below both these indicators. Sell signal occur when A bear bar is formed above the upper bollinger band and upper
FREE

Test it free first: load Hope EA in the MetaTrader 5 Strategy Tester, turn on visual mode, and watch how little it does while it waits and what it does when price turns against it. PATIENT ENTRIES. A LADDER WITH LIMITS. A BOOK THAT REMEMBERS. Hope EA is a two-sided grid for traders who prefer a quiet robot to a busy one. It enters only after a slow momentum reading turns back from an extreme, adds levels only when price has really moved, and pays down its oldest order with the profit of its newe
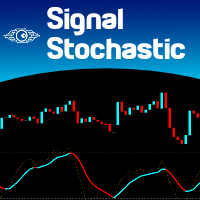
It is the very same classic Stochastic indicator, but with a little twist: we changed the Signal Line with a 2-color line, so we can use it with EAs as a filtering system. And that's it! I know it could seem stupid but I needed that, so I created it. The original formula is right from Metaquote's chest, no additions, no subtractions, it is Stochastics in its core.
So I will not publish here the Stochastics parameters as they are all the same as always... Enjoy!
If you like this indicator, all I
FREE

Script for Metatrader 5. One click to Delete the background grid and object, all objects on the chart such as Trend lines you have drawn or created by another program arrows text Fibonacci lines removes the background grid making a clearer clean chart horizontal and vertical lines
Easy for clearing a chart or when opening new charts. Please leave a review on how its working.
FREE
Application with Close Button.
Program include parameters to change settings:
Robot work with Symbols: - All Symbols - Current Chart Symbol
Transaction close (Profit/Loss): - All - Close Profit Only - Close Losing Only
Retries - max retries to close all transaction Sleep - time in ms between next Retries
Robot is free.
Robot designed for learn publish robots in Market.
FREE

• Please test the product in the Strategy Tester before purchasing to understand how it works.
• If you face any issues, contact me via private message—I’m always available to help.
• After purchase, send me a screenshot of your order to receive a FREE EA as a gift.
Time frame: M1
Leverage : Higher the better
Spread: Lower the better
Account type : All types
(EA may enter hedge positions, if you want to

KT Fisher Transform is an advanced version of the original Fisher Transform oscillator equipped with divergence detection, crossover alerts, and many more features. Originally it was developed by John F. Ehlers. It converts the asset's price into a Gaussian normal distribution to find the local extremes in a price wave.
Features
A light-weighted oscillator that efficiently identifies the upward and downward crossovers and marks them using vertical lines. It also finds regular and hidden diverg

PriceRunner MT5 The PriceRunner indicator is based on pure relative power. It gives promising results even in M1 timeframes in currency pairs and M2 in commodities and cryptos. The indicator is designed with user-friendly and simple settings. It is very suitable even for beginners who are interested in indicators and strategies. I am ready to make improvements on the indicator in line with the needs of those who buy or rent. However, even in its current state, you can see very promising results

FAST, PATIENT, TWO-SIDED: A STOCHASTIC GRID THAT KNOWS WHEN TO WAIT. Built for traders who want a quiet two-sided grid. One job: wait for a smoothed Stochastic turn, ladder 40 pips apart, close each side as one basket. Try it free first in the Strategy Tester with visual mode on. Reproduce it in two minutes: Strategy Tester, EURUSD H1, 2025.01.01 to 2026.09.30, 10,000 USD, leverage 1:100, 1 minute OHLC, default inputs. Our run on terminal data: +7.28 USD, 13 trades, profit factor 1.48, maximum e
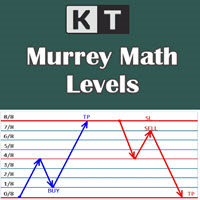
It shows the Murrey Math levels on chart and also provides an alert when price touch a particular level. T. Henning Murrey, in 1995, presented a trading system called Murrey Math Trading System, which is based on the observations made by W.D Gann.
Applications
For Murrey Math lovers, this is a must-have indicator in their arsenal. There is no need to be present on the screen all the time. Whenever the price touches a level, it will send an alert. Spot upcoming reversals in advance by speculatin

Only 1 copies left at a price of $99. Next price $199!
actual .set files (click me)
interactive panel manual (click me) Version for MT4: Smart Start MT4 Smart Start
is a smart trading system, the indicators of which allow it to be used both for trading with small deposits (fast acceleration) and for conservative trading. is a modernized trading indicator system that uses the MACD indicator to analyze the market. To analyze entry points, smart start takes into account the historical in

Утилита TemplateSwitcher позволяет автоматически переключать набор используемых на графике индикаторов и объектов в зависимости от текущего таймфрейма графика и/или символа. Часто бывает так, что на графике старшего таймфрейма используется индикатор с одним периодом расчета, а для младшего таймфрейма этот же индикатор необходим с увеличенным периодом расчета. Можно, конечно же, открыть два графика разных таймфреймов с нужными периодами индикатора. Но что, если мы не можем позволить себе дублиров
KT Candle Timer shows the remaining time in the closing of the current bar. You can use the bar closing time for multiple purposes, including time and trade management during the trading hours.
Features
It also shows the Symbol spreads along with the remaining time. It offers two convenient timer display positions, i.e., chart corner or next to the current bar. From colors to text size, it offers full customization according to user preferences. It is optimized to work without using extensive c

• Please test the product in the Strategy Tester before purchasing to understand how it works.
• If you face any issues, contact me via private message—I’m always available to help.
• After purchase, send me a screenshot of your order to receive a FREE EA as a gift.
In this EA you will have two sources of income:
1- Direct trades
2- Rebates from your broker.
Thus insure to register under an IB that shares with you their revenues
Scalping! What a thrill!
Forex trading had been a source of

KT Bullish Bearish shows the bullish/bearish regime of the market in the form of a colored histogram representing both of the market states alternately. Bull Market (Blue Histogram): A bull market indicates an uptrend when an instrument price rises over a continued period like days, months, or years. Bear Market (Red Histogram): A bear market indicates a downtrend when an instrument price rises over a continued period like days, months, or years.
Applications
It prevents trading against the big
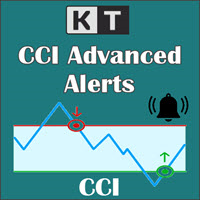
KT CCI Alerts is a personal implementation of the Commodity Channel Index (CCI) oscillator that provide signals and alerts on four custom events: When CCI enter in an overbought zone. When CCI exit from an overbought zone. When CCI enter in an oversold zone. When CCI exit from an oversold zone.
Features A perfect choice for traders who speculate the CCI movements within an overbought/oversold zone. Lightly coded without using extensive memory and resources. It implements all Metatrader alerts.
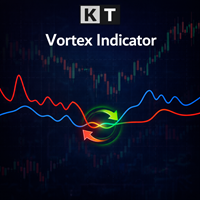
The Vortex Indicator was first presented by Douglas Siepman and Etienne Botes in January 2010 edition of Technical Analysis of Stocks & Commodities. Despite its based on a complex implosion phenomenon, the vortex is quite simple to interpret. A bullish signal is generated when +VI line cross above the -VI line and vice versa. The indicator is mostly used as a confirmation for trend trading strategies. The Vortex was inspired by the work of Viktor Schauberger, who studied the flow of water in tur

• Please test the product in the Strategy Tester before purchasing to understand how it works.
• If you face any issues, contact me via private message—I’m always available to help.
• After purchase, send me a screenshot of your order to receive a FREE EA as a gift.
Time frame: M1
Leverage : Higher the better
Spread: Lower the better
Account type : All types
(EA may enter hedge positions, if you want to
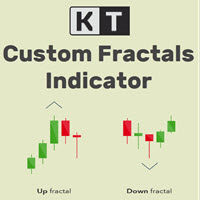
KT Custom Fractals is a personal implementation of the Fractal indicator first introduced by Bill Williams. With KT Custom Fractals you can choose a custom number of bars to allow to the left and right side of the fractal. For example, you can display the fractals that have "three" successive bars with the highest high in the middle and one lower high on both sides , or you can display the fractals that have "Eleven" consecutive bars with the lowest low in the middle and five higher lows on bot

KT Fractal Channel Breakout draws a continuous channel by connecting the successive Up and Down fractals. It provides alerts and also plots the Up and Down arrows representing the bullish and bearish breakout of the fractal channel.
Features
If you use Bill Williams fractals in your technical analysis, you must also include it in your trading arsenal. It can be very effective and useful for stop-loss trailing. A new market trend often emerges after a fractal channel breakout in a new direction.
Mago B3 Trader é um robô especialista baseado na estratégia do trader Dantas . A estratégia é baseada em cruzamento de médias móveis , com estabelecimento de stops fixos (alvo e stoploss). Além disso, é possível configurar o stoploss para ser dinâmico conforme análise de velas anteriores (máximas e mínimas). As funcionalidades de daytrade, habilitar apenas ordens de compra ou venda, bem como definição de horários para trades também podem ser configuradas. Funciona tanto para Miniíndice WIN , qua
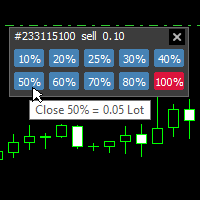
With this tool, you can easily and quickly close part of the trade. Click near the trade to display the closing panel. There are ten preset values for partial closing, but you can set your own values. You can also resize the panel according to Windows settings (125%, 150% ...) See the animation below for how it works. **********************************************************
Note: This tool does not work in the tester.

• Please test the product in the Strategy Tester before purchasing to understand how it works.
• If you face any issues, contact me via private message—I’m always available to help.
• After purchase, send me a screenshot of your order to receive a FREE EA as a gift.
Time frame: M1
Leverage : Higher the better
Spread: Lower the better
Account type : All types
(EA may enter hedge positions, if you want to

Some disadvantages of Rollover Scalper: Currently the markets aren't that favorable for night scalping because of the fundamentals, so the next few months the EA might show 0% or even negative return. However, it happened in the past too and it was still profitable over all ~20 years. It's a scalper, so you'll need a broker with low spread and good execution time, preferably an ECN broker. ICMarkets would be a good choice. It's susceptible to slippage (which can't be backtested or limited on ECN

With this indicator you have displayed on the chart the optimal lot size for the forex pair. No need for manual calculations or losing time on websites where you have to input the values to get the optimal lot size. The indicator values are preset for maximum percentage risk is 2% and for maximum pips loss is 50. For a customizable version you can buy using the this LINK . ATTENTION: This only works with forex pairs and it doesn't work on account deposits in YENS!!!!!!
FREE
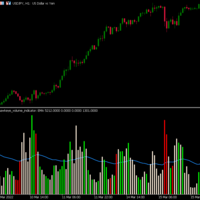
Hawkeye Volume Indicator contains a complex algorithm which executes over 300 calculations per bar in order to analyze the price action and associated volume, giving traders a tremendous advantage. Now Available in MT5 for U nlimited Use !
Volume is the only leading indicator which: .signals a price movement prior to it happening
.provides the fuel that drives the market Hawkeye Volume works in all markets and can be used in all timeframes for both tick and time charts – from longer term swing a

With this indicator you have displayed on the chart the optimal lot size for the forex pair. No need for manual calculations or losing time on websites where you have to input the values to get the optimal lot size. When adding the indicator to your chart change the values for maximum risk percentage (lossPrc) and for maximum loss in pips (lossInPips). If you like to try first the indicator you can download by clicking on this LINK . ATTENTION: This only works with forex pairs and it doesn't wor
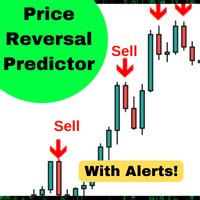
该算法预测价格的短期变化,准确率为90%*. 预测价格是否会高于或低于信号蜡烛。 完美的平均回归交易,二元期权或期货合约在更大的时间框架。 该指标在5年的数据上进行了回溯测试,预测价格随时间变化的准确率为90%。
特征:
简单的设置 拖放到任何图表上 启用警报(可选) 你就完了! 视觉和音频警报 警报直接发送到您的手机 发送到终端的弹出警报 高胜率 赢得高达90%的交易 回溯测试5年和多种货币。 (请参阅网站的回测细节和分析)。 大量信号 在活动模式下,每个符号每天需要3到6个信号 在被动模式下,每个符号每天有1到2个信号. *这是如果你有30分钟蜡烛的指示灯。 灵活 适用于外汇,指数,商品和股票。 适用于任何时间范围 从5分钟到每天的酒吧都能很好地工作。 但是,它在更高的时间范围内更准确 很容易在图表上看到。 您可以更改信号条和信号箭头的颜色 关于我:
这个算法是由一个博士工程师,定量和活跃的交易者. 我开发了这些算法来交易我的个人资本,他们正在成功地做到这一点。 但是,我无法在一个组合中使用所有这些算法。 所以我为您提供了一个选择数量的算法,以使用您认为合适的。
我正在从
FREE

DYJ CashRegisterEA致力于DYJ技术指标。当市场强劲时,价格位于高位做空,价格位于低位时做多,保持全天后交易
这就是安全市场中的机会和交易。与安全交易时间一致的收益。
EA使用单一订单模式来最小化交易量和最大化利润结算算法策略。并根据DYJ技术指标自动关闭仓位,EA始终保持1个订单
没有网格交易。
没有套利。
没有对冲。
没有马丁。 请在产品评论区下载回测测试报告的设置文件和PDF文件
建议
最低存$100,建议$1000以上或更高. 使用Synthetic和外汇账户。 专注M1, Crash 500 Index. 回测存款 $100 回撤=0.53% 15 个月利润=$30069 专注M1, Crash 500 Index. 回测存款 $100 回撤=2% 15 个月利润=$4429 专注M1, Crash 500 Index. 回测存款 $100 回撤=6% 15 个月利润=$13041 专注M1, Crash 500 Index. 回测存款 $100 回撤=1.76% 15 个月利润=$21379 专注M1, Bo
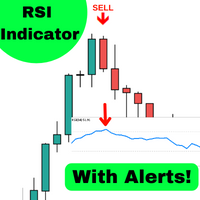
该算法预测价格的短期变化,准确率为86%*. 当有一个大的移动由ATR确定,在超买或超卖条件,指标将提醒您。 预测价格是否会高于或低于信号蜡烛。 完美的平均回归交易,二元期权或期货合约在更大的时间框架。 该指标在5年的数据上进行了回溯测试,预测价格随时间变化的准确率为90%。
特征:
简单的设置 拖放到任何图表上 根据您的喜好调整参数(可选) 启用警报(可选) 你就完了! 视觉和音频警报 警报直接发送到您的手机 发送到终端的弹出警报 高胜率 赢得高达90%的交易 回溯测试5年和多种货币。 (请参阅网站的回测细节和分析)。 大量信号 预计每个符号每天1到2个信号*。 *这是如果你有30分钟蜡烛的指示灯。 灵活 适用于外汇,指数,商品和股票。 适用于任何时间范围 从5分钟到每天的酒吧都能很好地工作。 但是,它在更高的时间范围内更准确 很容易在图表上看到。 您可以更改信号条和信号箭头的颜色 关于我:
这个算法是由一个博士工程师,定量和活跃的交易者. 我开发了这些算法来交易我的个人资本,他们正在成功地做到这一点。 但是,我无法在一个组合中使用所有这些算法。 所以我为您提供了一个选择数量
FREE

An equity protection EA for MetaTrader that enforces your loss limits and profit target for you: when your account reaches a rule you set, it closes your trades on every symbol, before one bad day turns into a lost account. It suits prop firm challenges and personal accounts alike. Attach it to one chart, answer a few questions in the on-chart setup wizard, and it watches your whole account in the background while you trade by hand or with other EAs. What it protects Daily loss limit: a percenta
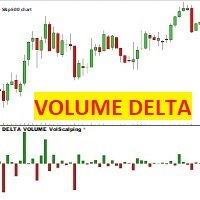
VOLUME DELTA Volscalping 该指标针对每根价格蜡烛绘制一个 Delta 蜡烛,即买入和卖出合约之间的差额。 如果买价(卖出)交易的合约超过卖价,蜡烛将是红色和负数,相反,如果卖价(买)交易的合约超过买价,蜡烛将是绿色和正数。
注意:该指标仅适用于提供真实市场数据流的经纪商,并将签订的合约分为 BID 和 ASK。 外汇、差价合约和加密货币属于合成市场,它们没有真实的市场数据流,因此该指标将不适用于它们。 AMP FUTURE 经纪商是提供真实市场数据流的经纪商,即使有模拟账户,也无需存款。 适用于在真实市场上交易的指数、商品、商品(例如 CME、EUREX、ICE ...)
VOLUME DELTA Volscalping 该指标针对每根价格蜡烛绘制一个 Delta 蜡烛,即买入和卖出合约之间的差额。 如果买价(卖出)交易的合约超过卖价,蜡烛将是红色和负数,相反,如果卖价(买)交易的合约超过买价,蜡烛将是绿色和正数。
注意:该指标仅适用于提供真实市场数据流的经纪商,并将签订的合约分为 BID 和 ASK。 外汇、差价合约和加密货币属于合成市场,它们没
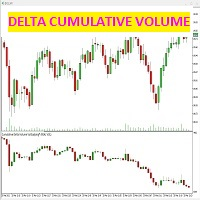
該指標檢測每根蠟燭的買價和賣價(侵略)合同之間的差異。
該指標在價格圖表下方的專用窗口中顯示蠟燭圖,蠟燭圖由買賣合約之間的差額精確給出,從而產生市場的成交量強度。
可以(從屏幕截圖中查看)如何僅選擇累積燭台 delta 圖表,甚至使用蠟燭本身的趨勢線:通過選擇第二個框 u “NONE”,不會繪製趨勢線,而通過選擇顏色,體積蠟燭的趨勢線將與它們一起出現在圖表上。
這個指標有什麼用?將價格圖表與體積delta圖表進行比較,您可以看到市場的真實實力,兩個圖表的收斂將確定價格的正確上漲/下跌,而價格與體積delta之間的背離必須是信號警報對於交易者來說,因為價格應該反轉。該指標必須與交易策略一起使用,以過濾虛假信號,消除出現在價格和數量之間背離階段的信號。
注意:該指標僅適用於提供真實市場數據流並劃分賣出/買入合約 (BID / ASK) 的經紀商。 CFD、FOREX 和 CRYPTOCURRENCIES 屬於合成市場,它們沒有真實的數據流,因此該指標不適用於這些工具- AMP FUTURE 是一家提供無存款且具有真實數據流的免費模擬賬戶的經紀商,該指標可在該賬戶上運行。

概述:
跨式剥头皮交易是一种 EA 在特定时间和/或日期开盘跨式交易。 止盈是使用 ATR 比率动态生成的。
要求:
开立跨式交易需要一个对冲账户。 严格的优化(在公开价格中)是强制性的。
什么是跨骑?
跨式交易是同时打开买入和卖出的操作。
这个 EA 是如何工作的?
成功优化后,EA 将在优化指定的每个新柱(H1 时间框架)处打开一个跨式。 开立新交易的决定是根据所需的最小波动率做出的(由 ATR 衡量并在交易历史上进行统计) 止盈将根据优化计算的 ATR 比率动态放置。 同时只能有 1 或 2 笔交易,以获利或新柱关闭。 此 EA 不使用以下系统:对冲、网格、鞅。
如何优化? 看一下图片,有一张显示优化集文件的基本设置。 始终在 H1 中优化和使用,它不适用于任何其他时间范围。 首先,优化开盘价,因为 EA 只在新柱上设置交易。 (明确适用于开盘价)
安全的长期交易:
如果你想真正安全,最好是长期优化,比如几年。 尝试找到具有许多交易和最低回撤的结果。 观察利润曲线,它必须尽可能稳定地呈现上升趋势,尤其是在最后。 潜在快速大回报的风险交易:
使用像 100

KT Coppock Curve 将平滑后的动量读数转化为清晰的市场方向视图。指标显示在价格图表下方的独立窗口中,零轴是主要参考。您不必对曲线的每一次细小变化作出反应,就能快速判断动量是保持在多头一侧还是空头一侧。 该曲线结合较长和较短周期的价格变化率,并对结果进行平滑处理。因此,它适合观察更广泛的动量转换,同时减少快速振荡指标中常见的部分噪声。 先看位置,再看交叉 曲线位于零轴上方时,正向动量占主导。曲线位于零轴下方时,负向动量占主导。当曲线持续停留在零轴同一侧时,它可以帮助您跟随当前的方向压力,而不是每出现一根新K线就改变判断。 曲线向上穿越零轴时会显示向上箭头,向下穿越零轴时会显示向下箭头。借助这些标记,您无需目测精确交叉点,也能轻松识别新的动量变化。 将它用于实际交易流程 作为方向过滤器,您可以在曲线高于零轴时重点寻找做多机会,在曲线低于零轴时重点寻找做空机会。当您的入场方法会同时给出多空信号,而您需要一个简单的动量过滤条件时,这种用法尤其方便。 用于把握时机时,需要结合价格图表观察交叉出现的位置。支撑位附近或回调后的看涨交叉,与阻力位正下方出现的相同交叉有着不同的市场背景。看

THIS EA HAD A WINRATE OF 80% !!!
How to use: The EA must be attached to ONLY one chart Symbol must be EURUSD . Timeframe should be M5. Minimum deposit 100 USD. Recommended leverage 1:50 - 1:500. The EA should run on a VPS continuously. Recommended Inputs:
Use Risk Percent: true Risk Percent: 1 Lot Size: 0.01 Target Points: 100 Magic Number: 123456789
Recommended broker: XM or any broker that has a lower spread. If you choose XM as your broker please select MT5 for trading platform type an

ROC 衡量的是当前价格相对于较早周期的变化速度。当价格创出新的波段高点或低点,而推动这次走势的动量没有同步确认时,它尤其有用。KT ROC Divergence 会自动寻找这种分歧,并在价格图表和 ROC 窗口中绘制对应连线。 与限制在固定区间内的振荡指标不同,ROC 会随市场速度扩大或收缩。您不需要比较不同交易品种之间的绝对数值,真正有用的是价格波段与振荡指标波段之间的关系。 用交易语言理解四种形态 常规看涨背离: 价格形成更低的低点,而 ROC 形成更高的低点。即使价格继续下探,卖方动量也可能正在减弱。 常规看跌背离: 价格形成更高的高点,而 ROC 形成更低的高点。价格仍在上涨时,买方动量可能已经开始减弱。 隐藏看涨背离: 价格守住更高的低点,而 ROC 形成更低的低点。这可能提示当前上涨趋势中的一次回调。 隐藏看跌背离: 价格形成更低的高点,而 ROC 形成更高的高点。这可能提示当前下跌趋势中的一次反弹。 它适合用在图表的什么位置 常规背离通常值得在一段成熟走势的末端、支撑位、阻力位或其他具备转向逻辑的区域观察。隐藏背离更适合已经有明确方向判断,并希望确认回调是否接近结束的情

我们的指标将提供一个价差筛选器来同时监控多对的价差,并且蜡烛计时器倒计时显示当前柱关闭和新柱形成之前的剩余时间。
限时优惠:我们所有的溢价指标仅售 50 美元,通过访问我们的 MQL5 博客,您将找到我们溢价指标的所有详细信息。 点击这里。
主要特征 我们的指标将提供一个价差筛选器来同时监控多对的价差,并且蜡烛计时器倒计时显示当前柱关闭和新柱形成之前的剩余时间。
监控多对同时传播。 跟踪服务器时间,而不是本地时间。 可配置的文本颜色和字体大小 优化以减少 CPU 使用率 个性化的配对列表。
接触 如果您有任何问题或需要帮助,请通过私信联系我。
警告 警告 我们所有的指标和工具只能通过官方 Metatrader 商店 (MQL5 市场) 获得。
作者 SAYADI ACHREF,金融科技软件工程师和 Finansya 创始人
FREE
具有双线信号、零水平系统、多时间框架支持、可自定义视觉信号和高度可配置警报系统的高级相对活力指数(RVI)指标。
自由编程服务、更新和其他 TrueTL 产品可在我的 MQL5 资料页 上获取。
非常感谢您的反馈和评价!
什么是相对活力指数(RVI)? 相对活力指数(RVI)是由 John Ehlers 开发的动量振荡器,通过将收盘价与开盘价进行比较(以交易区间为标准化基准),来衡量近期价格走势的可信度。其基本原理是:在牛市中,收盘价往往高于开盘价;而在熊市中则相反。 RVI 在零线附近振荡——正值表示看涨动量,负值表示看跌动量。该指标由两条线组成:主线(RVI 值)和信号线(主线的 4 根K线对称加权移动平均线)。两条线之间的交叉通常被用作进场和出场信号。 功能: 具有零水平参考系统的双线 RVI(主线和信号线) 具有三个独立可配置信号缓冲区的视觉信号标记(箭头、垂直线) 高级信号检测:方向变化、线交叉、级别交叉、两条线的峰值/谷值 可配置的警报功能(电子邮件、推送、声音、弹出窗口),带有时间范围过滤 带插值的多时间框架(MTF)、多种颜色模式以及用于 EA 集成的 iCust
FREE
直接在您的 MetaTrader 5 图表上看到您正在哪个外汇交易时段交易,以及每个时段走了多少点(pips)。 KT Forex Sessions MT5 是一款交易时段指标,它用彩色方框画出东京、伦敦和纽约时段,并把每个时段的波动幅度以点数写在它的方框上。 指标会自动读取您经纪商的 GMT 时差,每个时段都按照所在城市的当地时间和夏令时运行。方框全年都在正确的位置,无需任何设置。 您在图表上看到的内容 每个方框上的点数: 在您交易的每个货币对上,一眼就能分清平静的时段和活跃的时段。 无需换算时区: 不用查 GMT 时差,春季和秋季调整时钟时也不用做任何更改。 重叠时段有自己的方框: 伦敦和纽约同时开盘的几个小时,有一个单独的紫色方框。 正在进行的时段实时扩展: 它的方框跟随每一个新高和新低,直到时段结束,它的标签实时计算点数。 下一个时段以虚线方框显示: 在东京、伦敦和纽约时段开盘之前,您就能看到它们的位置。 显示时间的面板: 您经纪商的时钟、当前时段及其收盘剩余时间,以及距离每个下一个时段开盘的时间。 五个时段,样式由您选择: 悉尼、东京、法兰克福、伦敦和纽约,每个都可以显示为填
众所周知,金融市场只有大约30%的时间处于趋势状态,其余70%的时间都在区间震荡。然而,大多数初学者交易者很难判断市场当前是处于趋势还是震荡区间。 KT Chop Zone 通过将市场状态清晰地划分为三个区域:看跌区、看涨区和震荡区(Chop Zone),有效地解决了这个问题。
功能特点
通过避免在震荡行情中交易(Chop Zone),即时提高您的交易表现。 也可以用作离场信号。例如,当市场进入震荡区时,您可以选择平掉多单离场。 完全支持自动交易系统(EA),可轻松集成至您的EA中优化交易策略。 包含所有 MetaTrader 平台的提醒功能。
输入参数 主周期: 用于震荡指标的整数值。建议设置在10到30之间。 看涨区间值: 设置看涨区的参考值。 看跌区间值: 设置看跌区的参考值。 颜色设置 提醒设置
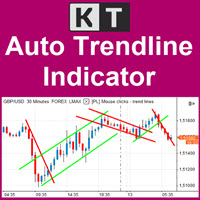
让关键趋势线随图表结构保持更新 KT Auto Trendline 根据近期 ZigZag 摆动点自动绘制上方和下方趋势线,并在当前图表上向前延伸。您无需反复手动画线,即可通过清晰的价格结构观察正在形成的突破、回落以及方向变化。 同时观察较近与更广的摆动结构 第一组趋势线默认启用,采用反应较快的 ZigZag 配置。需要更广的市场视角时,可以启用第二组趋势线,加入另一对具有独立灵敏度的上方和下方趋势线。这样便能在同一图表中比较较近的价格结构与更大的市场摆动。 控制每组趋势线的反应方式 Show First Trendline: 显示或隐藏主要的上方和下方延伸趋势线。 Depth、Deviation 和 Back Step: 调整第一组 ZigZag 识别摆动点的方式。 Show Second Trendline: 添加或移除可选的第二组上方和下方趋势线。 第二组灵敏度: 为更广或不同的摆动视角单独设置 Depth、Deviation 和 Back Step。 价格穿越延伸趋势线时及时获知 当价格向上穿越延伸的上方趋势线,或向下穿越延伸的下方趋势线时,指标可以发出提醒。您可组合使用弹窗、
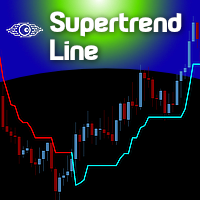
The Supertrend indicator was originally created by a french fellow named Olivier Seban , and its goal is to identify the Primary Trend of prices . Its calculation is easy and based on the average of Highs and Lows and then we add the volatility of a custom period, plus a multiplier. This way we get the Supertrend Line. You can find in the web several approaches and trading strategies using this very useful indicator.
HOW TO "READ" THIS INDICATOR
If the closing prices are above Supertrend Line,
FREE

The Analytical cover trend indicator is a revolutionary trend trading and filtering solution with all the important features of a trend tool built into one tool! The Analytical cover indicator is good for any trader, suitable for any trader for both forex and binary options. You don’t need to configure anything, everything is perfected by time and experience, it works great during a flat and in a trend.
The Analytical cover trend indicator is a tool for technical analysis of financial markets

Stargogs Spike Catcher EA V3 !!!PLEASE MESSAGE ME AFTER PURCHASING THE EA I WILL HELP AND SET IT UP FOR YOU OR I'LL SEND YOU THE RIGHT SETFILES!!! !!! IMPORTANT THIS ROBOT WON'T WORK OR MAKE PROFIT WITH DEFAULT SETTINGS!!! With The Right Settings so that you can make your daily or monthly Income. This Is the best version so far. With the right Parameters you won't fail. I will also show you the results. In Version 3.0 you can Switch on/off to Choose on which indices to catch spikes on Boom and
Key Features: Multi-Target Volatility: Configure multiple Take Profit and Stop Loss levels based on real-time market volatility. Fully Customizable: Set specific volatility multipliers (e.g., 4x for Stop, 10x for Take) using any look-back period (e.g., previous 20 bars on a 2-minute chart). Clear Visuals: Assign unique names to each level to be displayed directly on your symbol's chart for easy monitoring. Consistency: Every level calculated is synchronized with the volatility of your chosen per
FREE

Volume profile indicator that tells you which levels price is likely to reach today. Daily profiles with POC, VAH and VAL, naked POCs and a drag box for any range, and every level labelled with how often price reached a level at that distance on your own chart. What you see on the chart A profile for every day on M1 to H1 charts, with the value area in a stronger colour. Yesterday's POC, VAH and VAL across today, each with its odds for today, or "reached" once price gets there. Naked POCs: earli

According to Sir Isaac Newton's 3rd law, every action has its reaction and every movement must be compensated by an opposite movement of equal magnitude. The market cannot be oblivious to this physical principle, so when the force of gravity in the market of the big sharks hides like the sun behind the horizon, the night session allows us to see this law in all its splendor. This EA takes advantage of this movement to trade in the night session . Newton´s third law is designed to operate in the

OBOS indicator
OBOS Indicator is an exclusive indicator to spot entries based on price action.
The OBOS Indicator is both effective and user friendly.
Indicator uses simple color codes and levels to indicate Overbought and Oversold conditions. No more headache.
The OBOS Indicator will only gives you indication when there are possible entries. Means you only get useful information.
Inputs of the indicator are:
MaxBars : number of bars to display in your chart Smoothing period : number of b
Tick imbalance bars (TIB), described in the book Advances in Financial Machine Learning (2018) by Marcos López de Prado. Indicator that show candlestick bars with an different sampling method than time fixed. Real time data is sourced to the indicator and it may be used as substitute of the default graph. Each bar is formed when a predefined tick balance is exceeded, showing in the graph the OHLC of this cluster of ticks. The input variable is the amount of ticks of each bar. The indicator may
FREE

Assistant_for_Reopen - an Expert Advisor that helps to re-set pending orders. Many brokers force the order to expire at the end of the trading session or at the end of the trading day. Therefore, a trader has to restore all pending orders manually every time at the beginning of a new trading session. Assistant_for_Reopen frees the trader from this routine work. It controls expiration by the order expiration time and resets it if the trader ticked the checkbox. The maximum number of orders the EA
FREE
MetaTrader 市场 - 在您的交易程序端可以直接使用为交易者提供的自动交易和技术指标。
MQL5.community 支付系统 提供给MQL5.com 网站所有已注册用户用于MetaTrade服务方面的事务。您可以使用WebMoney,PayPal 或银行卡进行存取款。
