 MetaTrader 5
 专家
 指标
 程序库
 实用工具
 窗口小部件
 规则
适用于MetaTrader 5的新EA交易和指标 - 527
 使用EA交易和指标,使外汇交易获得更多盈利。EA交易可使您自动开启和关闭交易,而指标将帮助您更准确地预测市场行为。
该页面提供MetaTrader 5应用程序的目录。
This indicator combines RSI(14) and ADX(14) to find out the signal that price moves strongly. When it appears signal (represent by the yellow dot), and price is going down, let consider to open a SELL order. Otherwise, let consider to open a BUY order. In this case, the strength of moving is strong (normally after sideway period), so we can set TP by 3 times of SL .
FREE

Description :
A utility to create and save screenshots automatically and send to a chat/group/channel on telegram.
The saved/sent image file will include all objects that exist on the chart and also all indicators are displayed on the chart.
Features: Save screenshot of chart including all objects, indicators, ... Send screenshots to a telegram chat/group/channel
Wide range options to select when create screenshots
Logo and text adding feature
Inputs and How to setup the EA :
Various option
趋势线是外汇交易中最重要的技术分析工具。不幸的是,大多数交易者没有正确绘制它们。自动趋势线指标是专业交易者的专业工具,可帮助您可视化市场的趋势运动。
有两种类型的趋势线看涨趋势线和看跌趋势线。
在上升趋势中,外汇趋势线是通过价格变动的最低摆动点绘制的。
连接至少两个“最低点”将创建一条趋势线。
在下跌趋势中,趋势线是通过价格走势的最高摆动点绘制的。
连接至少两个“最高点”将创建一条趋势线。
趋势线何时突破?
当看跌蜡烛收于看涨趋势线下方并且蜡烛的高点在趋势线上方时,看涨趋势线会被打破。
当看涨蜡烛收于看跌趋势线上方并且蜡烛的低点低于趋势线时,看跌趋势线会被打破。
趋势线何时删除?
当一根完整的蜡烛在看涨趋势线下方形成时,看涨趋势线将被删除。
当完整的蜡烛在看跌趋势线上方形成时,看跌趋势线将被删除。
您可以从输入参数更改看涨和看跌趋势线的颜色和宽度。

用户手册:智能交易系统“通用指标连接器”
本系统是一个高性能自动化桥接器,无需重新编程即可执行任何自定义指标(.ex5)的信号。该智能交易系统充当智能订单管理器,允许您将退出规则、资金风险管理和时间控制应用于原本仅用于视觉控制的策略。
1. 指标链接配置
要使智能交易系统正常工作,您必须正确“映射”外部指标:
指标名称:指标文件夹中的指标文件的确切名称。
信号类型:
K线内:信号出现后立即执行订单。
K线收盘后:等待K线收盘以确认信号,避免“重绘”。
买入/卖出缓冲区大小:指定指标生成箭头的通道数(0、1等)。
操作类型:筛选条件,仅允许买入、仅允许卖出或两者兼有。
添加到图表:启用后,指标将自动绘制在图表上。
2. 风险与资金管理(资金管理)
系统提供三种计算仓位大小的方法:
FIX_LOT:用户自定义的固定手数。
LOT_RISK_MONEY:根据止损位计算承担固定金额风险所需的手数。
LOT_RISK_PERCENT_BALANCE:承担总余额的百分比风险(例如,1%)。
SL/TP 点数:以点数表示的保护和目标价位。注意:使用 0 表示不设固定

Lion King EA v13 – MetaTrader 5 高级神经网络增强型智能交易系统
Lion King EA 是一款功能强大且灵活的 MetaTrader 5 自动交易系统,专为 H1 时间框架下的 XAUUSD(黄金) 交易而优化。13 版本引入了一项重大升级:完全集成的 神经网络 ,将自适应智能融入到久经考验的算法核心中,为交易者提供前所未有的选择和控制力。 三种强大的交易模式 Lion King 提供 三种不同的操作模式 ,以适应不同的交易风格和偏好: 纯算法模式 (神经网络已禁用):EA 系统采用其久经考验的原始技术指标逻辑运行——基于布林带、移动平均线、CCI 指标和波动率分析,提供可靠的入场/出场信号。非常适合偏好稳定、基于规则的交易者,无需机器学习。 神经网络作为信号过滤器 (默认模式):核心算法信号的生成方式与之前相同,但所有潜在交易都会经过神经网络的最终验证。神经网络充当智能过滤器,仅当其置信度超过用户设定的阈值(默认为 0.2)时才允许交易。这显著提高了信号质量和对不断变化的市场环境的适应能力。 全神经网络决策器: 神经网络完全掌控交易决策。它分析市场状

https://c.mql5.com/31/761/best-trend-indicator-logo-200x200-8493.png 该指标用一条红绿相见的实线来反映市场价格的万千变化。 绿线表明市场价格处于上 升期间 , 红线表明市场价格处于下跌期间。
实线颜色 的改变预示着市场已经发生变化行情极有可能会出现逆转! 建议您在日K线图上使用该指标。该指标不适合您做超短线交易! 众所周知,趋势线是技术分析家们用来绘制的某一证券 (股票) 或商品期货过去价格走势的线。目的是用来预测未来的价格变化。这条 趋势 线是通过联结某一特定时期内证券或商品期货上升或下跌的最高或最低价格点而形成的。它可以预测该证券或商品期货是处于上升的趋势还是处于下跌的趋势。但是,您一定要认识到每一个指标都有是有缺陷的,这个世界上没有任何一个指标可以精准的预测到市场未来的发展方向。因此,我建议您在使用这个指标的时候结合其他的技术分指标,以此获得更好 的 效果 。

Impulse Creative is a more advanced indicator of impulses for making decisions (compared to the Impulse Change indicator). The main task of this indicator is to warn the trader about the moment of price changes and also to give a command to enter according to the current trend. To determine the trend, use any other tool, this development forms only an entry point but not the entry direction.
First, look at the screenshots and notice that we see clearly expressed figures that the indicator form

Shift Trend is an indicator of the formation of entry signals, entry points. The indicator must be selected to work for a sufficiently short period of time. But who works in short ranges, then this indicator is well suited.
Options: Length1 - The first parameter. Length2 - Second parameter; PointActivity - Parameter controlling peak levels. PointMinDist - The parameter that sets the minimum distance. AvgLengthBar - Bar averaging.
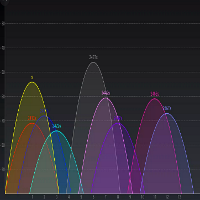
Change Analyzer - The indicator can be called an indicator of market balance. Since the indicator is on the zero line, then the market is balanced in a certain timeframe and a certain instrument.
Based on two virtual windows and their mutual placement, this graph is built. As a result of its work, the price chart normalizes relative to the zero line, which helps to draw conclusions about the price behavior. The indicator is somewhat reminiscent of the overbought and oversold system, but the al

Trading Direction is an indicator that will never go against a long trend, stable, accurate and without the slightest redrawing. The indicator goes through the whole story! You can find settings for any tool for which there is a free TDO utility .
Trade rules. When a signal appears (always at the bar opening price), we immediately close the opposite position, if it exists, despite the fact of a drawdown or profit. And we open a new position following the arrow in the right direction. And these

The Recuroid indicator shows very good entry points. Just look at the screenshots, then download the free version and look in the strategy tester and see for yourself.
The system is based on two key algorithms. The first algorithm (managed) creates a system of balanced transition from the buy zone to the sell zone and vice versa, draws arrows and lines, and forms entries. The second algorithm (managing) corrects the initial data for the first algorithm (managed) by measuring virtual windows, t
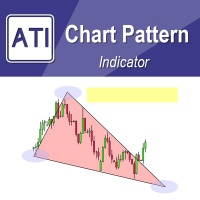
Introduction to Chart Pattern MT Chart Pattern MT is a chart pattern scanner to detect the triangle pattern, falling wedge pattern, rising wedge pattern, channel pattern and so on. Chart Pattern MT uses highly sophisticated chart pattern detection algorithm. However, we have designed it in the easy to use with intuitive user interface. Chart Pattern MT will show all the patterns in your chart in the most efficient format for your trading. You do not have to do tedious manual pattern detection an
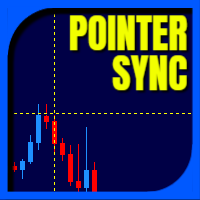
Pointer Sync is a pointer synchronizer between open charts. It makes the MT5 cross (activated by the middle mouse button) to be replicated on all open charts. In addition, it is possible to create horizontal lines (letter H) and vertical lines (letter V), very useful for studying. The appearance of the lines is customizable. Note: Synchronization is through the X and Y scale in pixels , not price and/or date. It is a simple and free utility. Enjoy!
This is a free indicator, but it took hours to
FREE
TDO is a free utility for optimizing the Trading Direction indicator. In addition to signals for trading, the indicator also has an information vector that fully provides all the statistical information on the operation of the indicator; this effect can be used to ensure that the indicator is automatically optimized. You just need to select the instrument and timeframe and specify the hourly interval in the utility settings and drop it on the chart chart. That's all, now we are waiting for the
FREE

Reward Multiplier is a semi-automatic trade manager based on pyramid trading that opens additional orders with the running profit of your trades to maximize return exponentially without increasing the risk. Unlike other similar EAs, this tool shows potential profit/loss and reward to risk ratio before even entering the first trade! Download Demo here (starting lot is fixed at 0.01) Contact me to get a 7 days trial version of the product with full functionality.
Guide + tips here MT4 version

KrakNix is a trending Expert Advisor for quiet trading. The Expert Advisor is designed for long-term trading, it does not bring huge profits in the short term, but it can work stably in the market for a long time, throughout history. The higher the timeframe, the more stable the work of the Expert Advisor. The tests are shown on the M5 timeframe for clarity, but for real work it is recommended to work on the H1 or even H4 timeframes. Let's analyze the EA structure and optimization principles.

Itiko is a modern professional robot that implements a trading strategy based on several indicators in a complex. Unique trading system! Permission to trade is formed by an indicator that delimits the levels of flat and nrend, and the entry point is set by the SAR indicator, separately for buy and sell. Also, the bot has a built-in filter indicator that cuts out peaks and valleys on the price chart. Itiko correctly handles errors and works reliably with capital. The EA uses the basic concepts:
Stable Trading - a stable bot for the whole history with one setting! Works on the basis of the Trading Direction indicator. Since the Trading Direction indicator generates stable signals for trading without redrawing exactly at the opening prices, the EA works as stably and reliably as possible. Everything that you read in the description of the indicator is also suitable for an expert. The expert goes through the whole story! The EA is designed for stable long-term trading, although it can be

The result is visible in the first hours of operation!
The bot opens a grid of orders with a minimum lot. And it fixes a small profit, but it does it very often. Thus, the profitable zones
are always close to the current price.The Expert Advisor has a trading panel. With it, you can open positions that will be picked up by the Expert Advisor and taken into account in trading. The built-in switchable filter ensures trading in the direction of the trend.
Use a $ 1,000 deposit
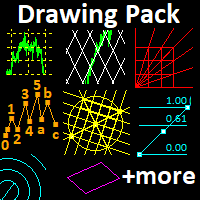
This indicator provides several drawing tools to assist in various methods of chart analysis.
The drawings will keep their proportions (according to their handle trendline) across different chart scales, update in real time, and multiple drawings are supported.
#
Drawing Option
Description
1 Grid box draggable boxed grid, user defines rows x colums, diagonal ray option 2 Grid partial or fullscreen grid, sized by handle line 3 Grid flex a diagonal grid, sized and sloped by handle line
4 Cyc

Overlay indicator on chart between 2 pairs
The Timeframe Overlay indicator displays the price action of timeframes on a single chart, allowing you to quickly assess different timeframes from a single chart. The advantage is to observe and follow the correlations of price movements in real time to help you find potential trades at a glance.
---- Symbol 1 ----
Symbol = EURUSD
Correlation Inverse = false
Display = true
Ratio
FREE

T5L Library is necessary to use the EAs from TSU Investimentos, IAtrader and others. It contains all the functions framework needed to Expert Advisors working properly. ツ
- The Expert Advisors from TSU Investimentos does not work without this library, the T5L library can have updates during the year - At this Library you will find several funcionalities like order sends, buy and sell, trigger entry points check, candlestick analyses, supply and demmand marking and lines, and much more.

--- Last 5 copies left free. Next there will be a price 30$ ---
DRAGON SWING EA (for EUR/USD 20 minutes) NO MARTINGALES NO CUMULATE ORDERS NO PARTIAL CLOSURES OR HEDGING NO CONFUSIONAL PARAMETERS, MULTI-CHARTS OR MULTI TIMEFRAME NOT OVER-FIT OR COMPLICATED AND RISKY STATEGIES THAT CRASH AFTER FEW DAYS
This is a healty, simple, durable and solid Expert Advisor. Suitable and simple to use also for beginners with little capital.
DESCRIPTION: The strategy of this expert advisor is to operate du

It is an Expert Advisor who uses the famous Dave Landry strategy, widely used to operate swing trades in various types of markets, Forex, B3, indices, stocks and cryptocurrencies.
The Dave Landry Setup is one of the most well-known setups that operate in favor of the trend, there is a preference for the larger H4, Daily, Weekly and Monthly timeframes, due to its high hit rate, but the TsuTrader Dave Landry robot allows complete customization of the strategy .
- TSUTrader Dave Landry is the on

Robot for the DERIV broker. Trade synthetic indices. Crash 500 index, boom 500 index, Volatily 10, Volatily 10 (1s), volatily 100 and volatily 300 (1s) Scalping operations. It has a hidden profit and loss limiter. You can set it in your parameters. Recommended minimum balance to trade all indices is $1,000.
Follow our signal in real time: https://www.mql5.com/en/signals/1630173

--- ! Last 8 copies left free. Next there will be a price $30 ! --- DRAGON RALLY SNIPER EA (USD/JPY 5min) NO MARTINGALES NO CUMULATE ORDERS NO PARTIAL CLOSURES OR HEDGING NO CONFUSIONAL PARAMETERS, MULTI-CHARTS OR MULTI TIMEFRAME NOT OVER-FIT OR COMPLICATED AND RISKY STATEGIES THAT CRASH AFTER FEW DAYS DESCRIPTION: The idea behind this system is very simple: identifies break-outs in price levels and starts trade on the pull-backs . It works perfectly on the USD/JPY cross with a 5-minute tim

This indicator is designed for those people, who want to trade and earn on any instruments and timeframes .The indicator gives out very good points to enter the market,it's very easy to trade,the arrows will show when to open trades,set and trade without thinking about anything,stop loss and take profit,set each one yourself,it all depends on your trading style,someone scalps and someone holds trades on a few days..In the strategy tester, the indicator simply cannot physically show accurate res

Are You Better than Monkey? Prove it...
The trade of this EA is based on random output with customizable lot size (use martingale or not), stop-loss, and take-profit levels. Easy to use and Simple Great for benchmarking tests against other EAs or manual trade. Works for ECN/Non-ECN brokers and 2-3-4-5 digit symbols Support us by open My recommended broker. Exness Tickmill robot monkey uses Adx trend filter for fair game no-trade unfavorable market ( you can turn off set adx = 0) . EA starts wi
FREE
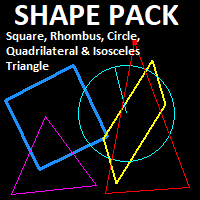
This indicator provides common shapes as drawing object options. The shapes are rotatable, resizable, draggable, and will keep their proportions (according to their handle trendline) across different chart scales. Multiple drawings are supported.
Shapes: Square Rhombus
Triangle (quadrilateral & isosceles) Circle (grid, overlapped grid, flexi grid, rotatable grid, concentric circles) Features: rays (all object edges will be rays) show/hide each individual drawing type, or all delete last drawn ob
FREE
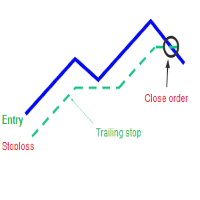
A trailing stop loss is a type of day-trading order that lets you set a maximum value or percentage of loss you can incur on a trade . If the security price rises or falls in your favor, the stop price moves with it. If the security price rises or falls against you, the stop stays in place. With this version, you can run trailing stoploss with currencies (ex start when profit more 1$, trailing stop with 2$...)
FREE
Multi-Timeframe Chart Overlay Indicator
The Timeframe Overlay indicator displays price action for multiple timeframes on a single chart, allowing you to quickly assess different timeframes from a single chart. The advantage is to observe and follow the correlations of price movements in real time to help you find potential trades at a glance.
---- Symbol 1 ----
Symbol = EURUSD
Correlation Inverse = false
Display = true
Ratio
FREE

Prime Algo Gold HFT Coded by Prime Capital Vietnam Best with XAUUSD - High frequency trading
Find your best setting with the backtest before trade with a real account please! With default setting: - Deposit: 10k - Lot trade from 0.01 - Max DD: ~5-10% - Profit: ~1%-3% per month with default setting
Note: - Best with spread max < 30 - Time frame: any - Important: Contact Us before buy ------ ------ ------ ------ ------ ------ ------ ------ ------ ------ ------ ------ -
Divergence is one best ways to trade the financial market as it is a leading indicator of price action that detect high probability reversal and continuation setups. The AlgoKing Divergence Detector is an RSI and Stochastics Indicator with Divergence Detection. Features Hidden Divergence for trend continuation. Standard or Normal Divergence for trend reversal. Screen Alerts. MetaQuotes Notifications. Email Notifications. RSI Indicator built in. Stochastics Indicator built in. Types of Divergen
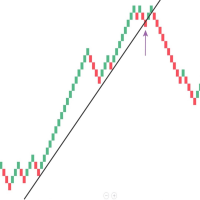
Mean Renko Bars are used for alternate price charting. Unlike the usual time framed chart – where every candle represents a fixed time interval – the goal of Renko chart is to display price movement in increments, called bricks. Best with the momentum strategies. Can make some Algo with this candel ---- ---- ---- ---- ---- ---- ---- ---- ---- ---- Support: primecapitalvn@ gmail. com

Данный советник - это аналог TakeProfit и StopLoss, только невидимый брокеру и остальным участникам рынка. Удобная вещь для скальпирующих стратегий, использующих одинаковый StopLoss и TakeProfit - один раз установил размер предполагаемых убытка и прибыли и далее остается только при соответствующем сигнале открыть позицию, а советник закроет ее сам при достижении установленных уровней.
This EA trails your stops based on percentage of current TP, for both manually and auto-opened trades. You can edit the percentage value in the inputs. Trailing stop is a more flexible variation of a normal exit order. T railing stop is the practice of moving the stop-loss level closer to the current price when the price moves in your favor. Trailing the stop-loss allows traders to limit their losses and safeguard their positive trades. It is a very popular practice. This EA will manage you

VixAlgo is fully automated Expert Advisor for trading Volatility 75 Index offered by Deriv formerly known as Binary Dotcom. The EA will spot entries when the conditions are met. It is based on Candle Breakout on Support or Resistance level and also is incorporated with Envelopes price Break Strategy. The EA will automatically open trades and close on Take Profit. Lot size or can can be also changed depending on account balance you have. This is not just a bot which miss trade opportunity, it ma
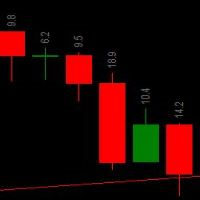
Introducing candlestick count trading. Let's make profit together When the candlestick reaches a trading size of 110 pips, there is always a reversal in the opposite direction. Therefore, we have brought technical techniques to write e-mail to make more profits. and can be used in all currency pairs
advice The minimum micro account capital is 10 dollars. and the standard is 100 dollars. Lot 0.1

AW MT5 To Telegram 是一款把 MetaTrader 5 账户事件发送到 Telegram 的工具:开仓和平仓、部分平仓、Stop Loss 和 Take Profit 的修改、挂单、账户警报和报告。该工具本身不交易。它读取账户的成交历史,把每一项变化转换成消息,发送到私聊、带话题的群组或频道。 它适用于同时运营 VIP 频道(即时发送)和 Free 频道(延迟发送)的信号销售者,也适用于希望在手机上收到回撤、保证金和连接警报的交易者。 使用手册与说明 -> 这里 / MT4 -> 这里 特点: 最多五个聊天,每个聊天都有各自的样式、事件、过滤、延迟和按钮 图表上的 AW Message Designer:12 个现成模板和实时预览 消息在磁盘上的队列中等待,网络故障后会重新发送 平仓和 SL/TP 修改以回复开仓消息的形式发出 消息支持 8 种语言:EN、RU、ES、PT、DE、FR、IT、TR 隐藏账户规模模式:以风险 % 和 pips 代替手数和金额 截图在单独的图表上生成,交易者自己的图表保持不变 工作特点: 发送 - 队列在终端重启后依然保留,并对每个聊天
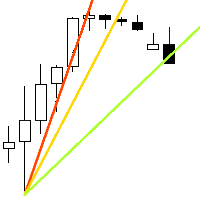
速度阻力线是确定趋势和阻力线的有力工具。 该指标使用图表极值和特殊的数学公式构建线条。 该指标可用于确定趋势方向和枢轴点。
<---------------------------->
指标参数:
"Depth of search" -搜索图表极值的深度(以条形为单位) "Back step of search" -极值之间的最小距离(以条为单位) "Deviation of price" -同一类型极端之间的允许价格差异 "Line color" -带有相应索引的线条颜色 "Line style" -带有相应索引的线条样式 "Line width" -具有相应索引的线宽 <---------------------------->
你可以在"艾德森*古尔德的稀有作品集"一书中找到更多信息,也可以在私人信息中与我联系。
<---------------------------->
提前感谢所有有兴趣的人,祝你好运征服市场!
FREE
UR 趨勢疲憊
UR TrendExhaustion 是不想處理參數值或其他設置的交易者的最佳解決方案 - 它對每個人來說既簡單又直觀易懂。
使用 UR TrendExhaustion 的優勢:
無參數 您有 3 條線最能描述圖表上的情況:趨勢耗盡線、鯨魚資金線和零售資金線。 該界面展示了兩個極端(紅色區域)上任何一條線的耗盡 最大優勢:簡單且可適應所有資產。 有一個特殊的電報聊天,您可以在其中了解最新的工具更新,如果您覺得缺少什麼,也可以發送請求!
為什麼是 UR TrendExhaustion?
在我的整個職業生涯中,我一直在編寫多種指標,並達到了這樣一個地步,即我收集了我所有的知識來編寫這個簡單但最好的 (imo) 工具來進行交易,而不需要圖表上的任何其他工具。 易於理解,易於設置。 該策略的執行方式使做市商很難與它進行交易 - 將死 MM! 您與 UR TrendExhaustion 一起使用的任何其他工具都會增加您的交易,但我一直單獨使用它並取得了很好的效果。 祝你好運!
如何使用 UR TrendExhaustion ?
YT 上有一段視頻展示瞭如何使

用户手册:MICROLOTS DERIV(交易量管理面板) MICROLOTS DERIV 系统是一款先进的执行工具,旨在克服某些经纪商施加的交易量限制,特别是在合成指数或衍生品市场中。其主要目的是允许交易者以低于资产合约允许的最小交易量开设仓位,前提是经纪商允许较小的交易量步长。
1. 简介与目的 在许多市场中,经纪商会设置最小手数(例如 0.20)。如果交易者想以 0.05 进行交易,标准平台会阻止该操作。此面板使用即时部分平仓逻辑:系统以允许的最小值开仓,并在几毫秒内平掉多余部分,使最终仓位正是用户想要的“微型手数”。
2. 参数指南(输入菜单) 加载可执行文件时,您将在“输入”选项卡中找到以下选项:
MagicNumber:此面板开启的交易的唯一数字标识符。有助于防止其他系统干扰这些订单。
Desviation:您允许的请求价格与执行价格之间的最大点数差异(滑点)。
InitialVolume:在图表上打开面板时默认显示的手数值。
3. 视觉解读 安装后,您将在图表的左上角看到一个交互式面板:
播放按钮 (">"):允许展开或隐藏控制面板以保持图表整洁。
交易
你的高點和低點
UR Highs&Lows 對價格變動及其波動性進行深入分析,並創建價格變動的通道。 該通道現在作為振盪器移動,並與價格偏差重疊,以表明潛在的耗盡和可能的逆轉。
使用 UR Highs&Lows 的優勢:
無參數 您有 3 條線描述價格變動 - 白線是價格的平均值,藍線是價格的極值 直方圖是價格背景下最大偏差的可視化 該界面展示了兩個極端(上部紅色區域和下部藍色區域)上任一條線的耗盡 最大優勢:簡單且可適應所有資產。 有一個特殊的電報聊天,您可以在其中了解最新的工具更新,如果您覺得缺少什麼,也可以發送請求!
為什麼是 UR 高點和低點?
該指標可用作獨立的進入或退出指標。 由於它對價格的依賴 - 它可以應用於每個圖表,其偏差計算算法基於多年的經驗和觀察。
如何使用 UR Highs&Lows ?
請參閱下面的描述以更熟悉它:
設置 沒有任何 展示
價格平均主線(白色):價格的平均值。 價格極值(藍色):價格極值的計算通道。 直方圖:顯示波動率的偏差。 極端區域:價格將耗盡並可能反轉的區域。
添加
我所有的工具在組裝後都能發揮最佳效果。

使用前优化EA。
在 Apple 股票上交易此 EA。 它按趋势进行交易,并具有先进的资金管理和时间管理。 用于小时间范围内的日间交易。 它具有收支平衡和可移动的止损。 它是用 2016 年至今的数据制作的。 按月或年优化以查找设置。 这是一项正在进行的工作,这将是第一个 EA。 使用前需要优化,回测。
笔记:
请自行决定使用。 使用前优化EA。
在 Apple 股票上交易此 EA。 它按趋势进行交易,并具有先进的资金管理和时间管理。 用于小时间范围内的日间交易。 它具有收支平衡和可移动的止损。 它是用 2016 年至今的数据制作的。 按月或年优化以查找设置。 这是一项正在进行的工作,这将是第一个 EA。 使用前需要优化,回测。
笔记:
请自行决定使用。
使用前优化EA。
在 Apple 股票上交易此 EA。 它按趋势进行交易,并具有先进的资金管理和时间管理。 用于小时间范围内的日间交易。 它具有收支平衡和可移动的止损。 它是用 2016 年至今的数据制作的。 按月或年优化以查找设置。 这是一项正在进行的工作,这将是第一个 EA。 使用前需要优化,回测

水行者黄金 交易规则: 图表:H6 最低余额:1000 手数:0.01 关于本 EA Waterstrider GOLD 专为 GOLD/ XAUUSD 市场而设计。这是一个 4 仓位的日间交易策略。没有马丁格尔,都是一样的。入场位置基于 D1 分析,由 h6 图表触发。每支蜡烛只能开 1 个仓位。如果市场反对仓位,在最后一个仓位(4 个仓位),它将计算一个总仓位大小的 0.1 倍的对冲仓位,这是为了在等待所有仓位平仓的同时保持净值保持增长。对冲头寸的止损设置为 1000 点。此 EA 的默认最大 DD 为 50%,可在参数输入中进行调整。 这个ea上的设置是基于历史的,截图也是基于回测的。远期测试和实时交易可能是不同的结果。交易风险自负,我们不保证使用此 EA 所发生的损失。 谢谢 Shuǐ xíngzhě huángjīn jiāoyì guīzé: Túbiǎo:H6 zuìdī yú'é:1000 Shǒushù:0.01 Guānyú běn EA Waterstrider GOLD zhuān wèi GOLD/ XAUUSD shìchǎng ér shèjì. Zhè
Sales Sales for seasonal traders.A new type of indicator for Professional and Experienced Traders. Specifically designed for trend identification. A great tool for investors to invest at the right and suitable time for decent trading. You can present it to your potential clients and customers for their satisfaction. A very handy and trendy tool. Easy to read , comprehend and user friendly. By this tool you can easily identify the potential to enter in trading and low potential to exit.
It c

水平(極值、止損、獲利)
用於更改止損訂單的放置水平(由用戶手動完成,指標僅可視化水平)。它也可用於在與運動相反的水平上獲取部分利潤。 該指標將允許您採取大部分強勁的運動。您不必擔心過早退出該職位。如果您陷入強勢走勢,只需觀察支撐位並在價格突破該水平時止損退出。 該指標並非旨在搜索入場位置 設置: 極值區域 - 最初搜索極值的區域。 在這種情況下,之前有 2 根蠟燭,之後有 2 根蠟燭。 类型级别-负责级别的值-蜡烛的极端或收盘价 Any Break - 啟用此參數可在第一級更改時提供更高的靈敏度。 重新開始新的一天 - 用於具有潛在大範圍第一根蠟燭的工具的日內圖表。 否則,第一根帶有尾巴的蠟燭可能會立即決定全天的水平。 Bar's Quantity - 顯示指標的左側蠟燭數 .... 演示版在"讨论"。 出于某种原因,MQL默认制作的演示不起作用。

O Robô Trader EMAGap faz operações de curto prazo no timeframe 1min buscando as pequenas variações do mercado no instrumento: Mini-índice(B3), utiliza nova tecnologia de trade, os resultados no intraday são íncríveis.
Versão exclusiva para os instrumentos WIN$ e IND$ (Mini-índice B3).
Estratégia utilizada: média móvel e volatilidade. Lote Inicial: Versão Mini-índice, a partir de 1 lote. Versão Bra50, a partir de 0.05 Mini-Lotes. StopLoss e Take Profit Ajustáveis. Gerenciamento de risco: (
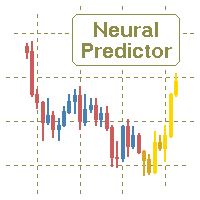
The indicator refers to the means of probabilistic analysis. Prediction is performed by the Monte Carlo method together with a mathematical model of a neuron. But, the modeling of samples for this method is made not artificially, but comes from the original "nature", that is, from history. The number of samples and the detail of their modeling is achieved using the lower (relative current) timeframe.
Indicator algorithm :
In general terms, the algorithm boils down to the fact that the indica

Impulse Change is an indicator of impulses for decision making. The main task of this indicator is to warn the trader about the moment of price changes.
Do you often doubt when to make a decision? Leave the market or wait? This indicator is for you, Impulse Change will help you and provide a clearly defined correct hint.
There are always moments in history in which the behavior of the market differs sharply from what happens for the longest periods of time, such uncharacteristic behavior can

In the Apple is a stable indicator of exit points, no signal will change or redraw.
The indicator displays buy and sell signals with recommended markers for exiting a position. Each exit marker is accompanied by an information mark about the profit from the operation. The label consists of two parts. The first label displays the profit from the last operation in instrument points, and the second label displays the total balance. The total balance starts to be calculated from the moment when th

STARGOGS INVESTMENT EA is a fully automated “TREND & SCALPING” trading robot. As the Name tells it all "investment EA" Invest or Deposit and the EA Will do the work. TIMEFRAME: M1 - D1 .... But I prefer M15 BASE/RECOMMENDED PAIRS: EURUSD, GBPUSD, XAUUSD, NASDAQ AND VOLATILITY 75 (1s)
ADDITIONAL PAIRS: ALL Currency Pairs, ALL Metals, All Indices, All Volatility Indices, All Boom and Crash and Stocks MINIMUM BALANCE : $20 Cent Account For Currency and Gold MINIMUM BALANCE: $80 Account F

For Nasdaq trading, the most important principle is to know the trend of the fund.
This indicator with 6 green and red lights provides you with the daily path of this important indicator.
This indicator has been tested for 6 months and has a win rate of over 85%.
Be sure to contact me before purchasing to get the necessary instructions on how to use and set up this indicator.
You should use a broker that has dollar index, vix, and commodities. MT4 Version
You can contact us via Instagram, Teleg
FREE

O Robô Trader BRA50SC faz operações de curto prazo no timeframe 1min buscando as pequenas variações do mercado no instrumento: Índice BRA50, utiliza nova tecnologia de trade, os resultados no intraday são íncríveis.
Versão exclusiva para o Bra50 (Mini-índice internacional).
Estratégia utilizada: média móvel e volatilidade. Lote Inicial: Versão Mini-índice, a partir de 1 lote. Versão Bra50, a partir de 0.05 Mini-Lotes. StopLoss e Take Profit Ajustáveis. Gerenciamento de risco: (%) Rebaix
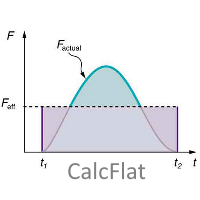
CalcFlat is a flat indicator.
At first glance, a simple indicator, but if you look at the screenshots for people who are not specialists, it may seem that the indicator is not very informative. But in fact, the indicator is very informationally active. It needs to be adjusted for each instrument and each timeframe. Very flexible in the settings there are two key settings, but they can significantly change the results of the display of the indicator. In addition to the main histogram, the indic

With Renko Plus you can use the features in the Indicator functionality, just add it to the Metatrader5 chart.
The Renko chart is a type of chart, developed by the Japanese, that is constructed using price movement rather than standardized prices and time intervals like most charts. It is believed to be named after the Japanese word for bricks, "renga", as the graphic looks like a series of bricks.
A new brick is created when the price moves a specified pri
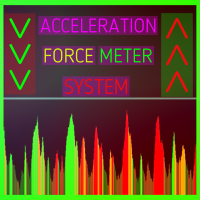
Acceleration Force Meter Indicator - is a trend system that join market in trend phase and after trend pull-back. AFM indicator - is the system that watchs market phases from flat to extreme volatility and prefers to enter in market when it's active, more volatility, ignoring most flat places. This is 100% complete trading system including enter and exit points. It works well with profitable trades - maximizing take profit targets(analysis of recent market volatility, its pips range to adapt cur

This Service, export the account Orders/History Orders/Deals/Position on each new change. It save at a common folder with path = <DATE>\\<Server Name>.<Login>.<DATE>.<filetype>.csv Each file type have an header You can use it to receive OMS changes and source SQL Servers outside metatrader with bash scripts or others tools, each time the file change you can read it and get new updates, it works using SharedRead option when opening/flock the file.

EA probado desde Noviembre de 2018 en el par EURUSD, optimizado solo para M1 con un comportamiento muy uniforme y estable. Basado en medias y cambios de SAR rápidos. Trading deshabilitado las primeras horas del lunes para evitar fluctuaciones en las medias debido a los periodos de inactividad del Mercado los fines de semana. No cierra los viernes por defecto. Posibilidad de optimizar en función del TP para combinar con los valores de Trailing. Posibilidad de controlar el ratio de riesgo. Trai

Golden section price action indicator - is a trend-scalping complete system with enter and exit points. Indicator is based on most powerfull price action japan patterns that are filtered by volume, volatility, market phase. Pattern is not a simple combinations of candles. Patterns must have "weight" to move market in right direction. "Weight" - is the summary of pattern's volume, the size of pattern candles according to last average volatility and ofcourse pattern must appear in correct market p

Spots EA — Candlestick Patterns, Fully Automated
Spots EA turns the Spots indicator into a fully automated trading robot, trading the classic candlestick patterns — engulfing, hanging man, doji and more. It was built with one goal in mind: dependable automation with low drawdown. Ready-to-use set files are included.
What it does for you Pattern-based automation: trades classic candlestick signals automatically. Built for low drawdown: designed around steady, controlled trading. Set files inclu
FREE

Identification of support and resistance areas
A useful indicator for traders
completely free
Can be used in all symbols
Can be used in all time frames
It has three different trends: short term, medium term, long term
Settings:
Clr1,2: You can change the color of the lines
Type Trend: You can determine the trend
Message me for questions, criticism and suggestions
FREE
AlgoKing Chandelier Exit Indicator (MT5)
The Chandelier Exit Indicator is a volatility based indicator that maximizes returns using the Average True Range (ATR) value and the highest high or lowest low of a period. Benefits Should be used as a trailing stop. Helps you exit a position when you have a respectable profit. Identifies a high probability of a trend reversal when the price moves against the prevailing trend by a distance equal to 3x the average volatility. Join the AlgoKing Lightning
The AlgoKing Squawk Trendlines script will auto draw trendlines on your chart to use with trendline break and retest strategies. Simply drag the script onto your chart.
Recommendation: Be sure all candle bars that you want to include in the trendline calculation are visible. Draw trend lines using multiple timeframes. Delete all lines that you do not want to use in your strategy. Benefits: Join the AlgoKing Lightning Bolt Expert Advisor support group: https://www.mql5.com/en/messages/02E3BDCF

Diagnosis of major and minor pivot
Trend detection
with many signals
Can be used in all symbols
Can be used in all time frames
Settings:
Back Show: The number of candles it displays
If you need any adjustments, or have any questions or suggestions, message me
How to trade:
Blue: sell signal
Red: buy signal
Blue and red at the same time: no signal
Exit signal: Opposite signal

Forecasting the future by combining trend and average price
with many signals
Can be used in all symbols
Can be used in all time frames
Settings:
BackShow: The number of candles displayed
Osi: Main setting, the larger the number, the longer the trend
If you need more settings, or have any questions or suggestions, message me
How to trade:
Blue: sell signal
Red: buy signal
Blue and red at the same time: no signal

This is available on lowest price, price will further increase. Don't miss this opportunity. Buy it now. This expert adviser has been designed to be used on EURUSD pair. Recommended to use this EA with account balance of at least 200 USD . This has been developed using best indicators RSI and Moving average. Moving average analyse the trend of the market and RSI indicator analyse the support and resistance. when both the signal is buy or Sell then only order is placed. Market trend and support

用於手動交易以管理未平倉頭寸和掛單的 EA。 內置追踪止損有五種模式和七種工具。 有虛擬止損和虛擬止盈,可以在圖表上自由移動。 借助內置的交易模擬器,您可以檢查 EA 在策略測試器中的工作方式 UTrailingMT5 指南可以在“評論”部分找到。 在 MT5 策略測試器中,手動移動虛擬線(SL 和 TP)不起作用!
好處 5種追踪止損模式:虛擬、正常、總計、百分比和移動止損; 7 個選項:按點、按柱極值、按分形、按交易量、按 MA、按拋物線 SAR 和按 ATR; 虛擬 TP 和 SL - 根據圖表手動自由移動; 為所有未平倉頭寸添加止損和止盈; 通過以下方式設置止損:點、分形、ATR 指標、每日高/低; 圖表上打開的所有訂單的追踪止損; 迷你利潤開始追踪止損。; 通過幻數和方向為未平倉頭寸設置追踪止損; 掛單的尾隨:按類型、方向、點、分形、柱極值; 圖表上的“熱鍵”用於快速執行命令; 適用於具有 4 位和 5 位報價的帳戶; 5位數賬戶,參數自動加10; 用於處理加密貨幣、指數、期貨、差價合約的特殊參數乘數。. 參數 Block 1. GENERAL SETTINGS Allow

UR發散觀察儀
UR DivergenceSpotter 是多年經驗的結晶,有時最簡單的方法就是最好的。 一些指標之間存在良好的相關性,但當它們不匹配時 - 價格試圖“重新調整” - 正是在那個時刻我們通過 UR DivergenceSpotter 收到信號。
使用 UR Divergence Spotter 的優勢:
無參數 蠟燭創建後不重繪 當信號不再有效時發出信號(這意味著您可以持有更長時間的交易,將止損設置為 BE 並讓它運行,獲取部分利潤或完全關閉它!)。 該指標是多年經驗和觀察的結果。 它堅固且經過測試。 最好在更高的時間範圍 (h1/h4) 中使用以獲得更好的結果和更安全的信號。
另一種方法是將它與我的其他指標(如 UR TrendExhaustion 或 UR VolumeTrend)一起使用,以獲得更好的信號准確性。 有一個特殊的電報聊天,您可以在其中了解最新的工具更新,如果您覺得缺少什麼,也可以發送請求!
為什麼選擇 UR DivergenceSpotter?
如前所述 - 該指標是將體驗整合到一個指標中。 以某種方式對其進行編碼,以便每個人都可
UR 成交量趨勢
UR VolumeTrend 是顯示交易量持續趨勢的最清晰的交易量指標。 與 UR TrendExhaustion 等其他指標完美配合,以發出局部頂部和底部信號。
僅限於 2 個參數 - 值越高,顯示的趨勢越長。 梯度極端顯示成交量可能耗盡以捕捉潛在的逆轉。 兩條線 - 成交量趨勢和平均值。 最大優勢:簡單且可適應所有資產。 有一個特殊的電報聊天,您可以在其中了解最新的工具更新,如果您覺得缺少什麼,也可以發送請求!
為什麼選擇 UR VolumeTrend?
所有人都會同意,成交量是把握趨勢的關鍵。 這個震盪指標是我所有交易量工具的總和,壓縮成一個易於使用的指標。 它以易於查看的方式顯示正/負音量。 後面的界面顯示音量與過去相比是否可能會耗盡 - 或者它是否會推到新的水平。
如何使用 UR VolumeTrend?
請參閱下面的描述以更熟悉它:
設置 Volume Period:值越高,它會嘗試捕捉的趨勢越大 交易量趨勢:此附加行顯示僅基於交易量的潛在反轉條目 展示
漸變界面:顯示基於過去的極值水平。 成交量主線:顯示成交量是看漲*高於 0*
MetaTrader市场是您可以下载免费模拟自动交易,用历史数据进行测试和优化的唯一商店。
阅读应用程序的概述和其他客户的评论,直接下载程序到您的程序端并且在购买之前测试一个自动交易。只有在MetaTrader市场可以完全免费测试应用程序。
